- About QlikView Scripting & Qlikview Hidden Scripts
- QlikView Circular Reference
- OLE DB/ ODBC Connection to Qlikview Data Sources
- Best Practices for Data modelling in QlikView
- Definition And Advantages of QVDs in QlikView
- How to Fix Circular References & Remove Synthetic Tables
- Concatenating Two Tables in QlikView
- Creating Data Islands in QlikView using Data Source
- Optimize QlikView Application User Interface
- Learn SET Analysis Syntaxes, Examples in QlikView
- QlikView Table Viewer - Previews Records
- Process of Incremental Load in QVD QlikView
- QlikView Architecture
- Binary Load in QlikView
- QlikView Bubble Chart
- QlikView Data Transformations in Flat Files
- Intervalmatch Function in Qlikview
- QlikView Interview Questions
- Qlikview Management API
- Qlikview Mapping
- QlikView Metadata
- QlikView Qualify
- QlikView Tutorial
- QlikView vs Qlik Sense
- Color Alerts and Calculated Colors In QlikView Scripting - QlikView
- Rename Field and Qualify in Qlikview
- Script Editor Features and Commands in QlikView
- Script Expressions & Quotation marks in Qlikview
- Qlikview Scripting Features and Functions
- Star schema and Snowflake schema in QlikView
- Synthetic keys in QlikView
- Table Viewer in QlikView
The scripting feature of QlikView allows you to control the data load and transformations. Scripts are developed in the script editor. After developing the scripts, we have to execute them to get the required output. But, before execution, we have to debug the scripts to remove the errors. Debugging is helpful for the successful execution of the program.
| In this blog, we will discuss the following topics. |
Debug Script in QlikView
What is Debugging?
When the software is in the development phase, it will go through troubleshooting, testing, updating, etc. Generally, the software comprises bugs, errors that need to be fixed. Debugging is a mechanism of solving the error or bug of the software. Debugger detects, analyzes, and removes errors.
Need of Debugging
Debugging process starts immediately when the development of the software code is completed. The debugging process continues in consecutive stages. The advantages of Debugging are as follows:
It identifies the error spontaneously. This makes the software development process hassle-free and uncomplicated.
It helps the developers in minimizing ineffective information.
With the help of debugging, developers can evade difficult testing code.
| Want to Become an Expert in QlikView? Then visit here to Learn QlikView Online Certification. |
QlikView Debugging
In QlikView, we will run the script in the Debugger to ease the identification of the script error. The Debugger will oversee every statement of the script and check the values of the variables when the script is executed.
We can open the Debugger by pressing the “Debug” button present in the “Edit Script” window. The script is displayed at the upper end of the Debugger. The script execution is indicated with a yellow bar. The statement that is presently executed is displayed in the middle of the window. The script is debugged in the following ways:
-
Through the “Run” button. We can run the script until a breakpoint has arrived.
-
By clicking the “Animation” button, we can run the script, but after every statement, a pause button is added to monitor the script execution.
-
When we press the “Step” button, a single statement is executed by the script.
| Related Article: How to Use QlikView |
Key Features of QlikView Debugger
1) BreakPoint
We insert breakpoints to the script to stop the debug execution at particular lines of code to check the values of the variables and output messages. When we arrive at the breakpoint, we will stop the execution. Breakpoints in the script are included in referring to the section.
Adding a BreakPoint
For adding a BreakPoint, we should do any of the following:
Inside the script, press the area instantly at the right side of the line number where you have to insert a breakpoint.
Deleting a BreakPoint
The deletion of a BreakPoint is carried out by doing any one of the following:
-
Within the script, press “eclipse” following the line number.
-
In the catalog of the breakpoints, press “*” following to a breakpoint.
We can enable and disable the Breakpoints. In the breakpoints menu, we can see the following options:
-
Enable all
-
Disable all


2) Limited Load
Through lengthy load times, debugging scripts that heaps plenty of data that can be massive. In this situation, a limited load is useful. When this option is used, QlikView will load the data that is mentioned in the input box.
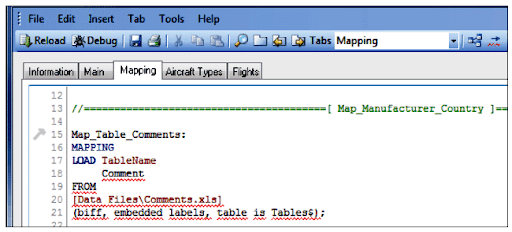
3) Syntax Check
The primary reason for errors is the inappropriate use of syntax. QlikView has a feature called “Syntax Check” through which we can check the syntax errors of the QlikView scripts. If any syntax error is detected, it will be underlined. In the below screenshot, we can see how a syntax error is underlined:
4) Tracing Script

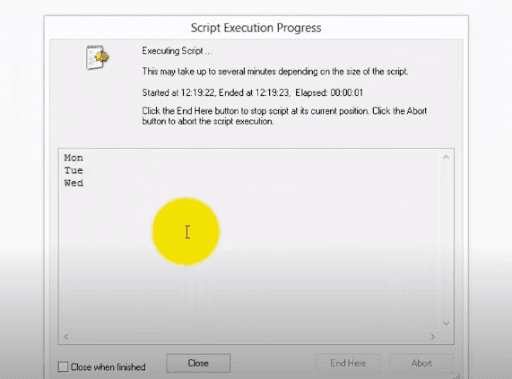
Along with Limited Load, we will use a “Trace” statement for debugging the scripts. This statement is invoked from the script and used to develop all kinds of information to the “script execution progress”.
5) Debug Toolbar
Data Load editor debug panel includes a toolbar through the following choices, they are:
-
Help: This option is used for openingQlikView Help.
-
EndHere: This option is used for closing the Debugger.
-
Cancel: It stops the script execution.
| Related Article: Qlikview Interview Questions for Experienced |
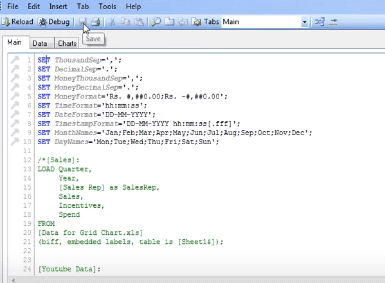
Working of Debug tool
The Debugger will debug the QlikView Scripts, so now we will look at a sample QlikView Script:

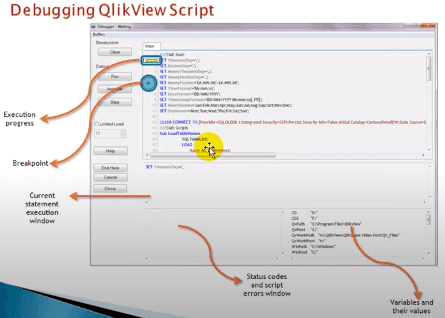
The features of the Debug toolbar can be seen in the below screenshot

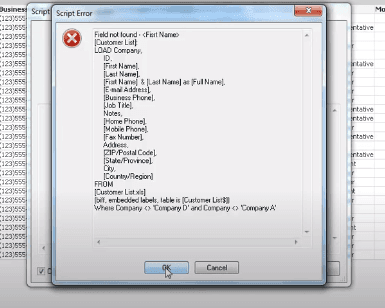
While debugging, the script editor will display the script errors:

The QlikView script execution progress is displayed in the below screenshot:

| Related Article: Set Analysis in QlikView |
With the help of the above screenshots, we can understand the Debugging Process. First, a QlikView script will be taken as input, and with the help of some key features like a breakpoint, the debugging process is indicated. The script execution progress displays the current status of the script execution. After the execution, we will get the required output.
| Explore QlikView Sample Resumes! Download & Edit, Get Noticed by Top Employers! |
Conclusion
Debugging process is important for every program or script.QlikView Script Debugging is conducted by the debugger tool embedded in the script editor. It will use features like a breakpoint, tracing script to make sure that the script is debugged efficiently.

.svg&w=750&q=75)
Stay updated with our newsletter, packed with Tutorials, Interview Questions, How-to's, Tips & Tricks, Latest Trends & Updates, and more ➤ Straight to your inbox!
| Name | Dates | |
|---|---|---|
| QlikView Training | Apr 20 to May 05 | View Details |
| QlikView Training | Apr 23 to May 08 | View Details |
| QlikView Training | Apr 27 to May 12 | View Details |
| QlikView Training | Apr 30 to May 15 | View Details |


Viswanath is a passionate content writer of Mindmajix. He has expertise in Trending Domains like Data Science, Artificial Intelligence, Machine Learning, Blockchain, etc. His articles help the learners to get insights about the Domain. You can reach him on Linkedin


Copyright © 2013 - 2024 MindMajix Technologies