- Advanced OpenStack Tutorial
- Configuring Account Server - Openstack
- Installing OpenStack Dashboard
- OpenStack Object Storage Tutorial
- OpenStack Interview Questions
- OpenStack Tutorial
- Attaching volumes to an instance – OpenStack
- Automating OpenStack Installations of Opscode Chef Server and Chef Client - OPENSTACK
- Automatically assigning and modifying fixed networks of tenants – OpenStack
- Checking OpenStack Services
- Configuring Object Server - OpenStack
- Configuring OpenStack Compute for Cinder volume - Openstack
- Creating containers - Openstack
- Creating and Deleting a Neutron network – OpenStack
- Creating an external Neutron network – OpenStack
- Creating and Managing Keypairs - OpenStack
- Creating an OpenStack Object Storage sandbox environment
- Creating a sandbox Compute server with VirtualBox and Vagrant - OpenStack
- Creating a sandbox Network server for Neutron with VirtualBox and Vagrant – OpenStack
- How to Create the Service Tenant and Service Users - Openstack
- OpenStack – Detaching volumes from an instance
- Downloading objects In OpenStack
- Configuring OpenStack Keystone user & Role Management - OpenStack
- How to Configure Ubuntu Cloud Archive in OpenStack
- How to Create Sandbox Environment for the OpenStack
- Create Tenant Users and Roles in OpenStack
- Install and Configure Compute Node – OpenStack
- How to Install Compute Controller Services – OpenStack
- Installing and configuring OVS and API server for Neutron - OpenStack
- Installing and setting up Pacemaker and Corosync - Highly Available OpenStack
- Managing Images with OpenStack Image Service
- Manually associating and dissociating floating IPs of instances – OpenStack
- Monitoring Compute services with Munin – OpenStack
- OpenStack Networking
- Registering a remotely stored image – OpenStack Cloud
- OpenStack – Removing nodes from a cluster
- Setting up a Chef Environment for OpenStack
- Troubleshooting OpenStack
- Troubleshooting OpenStack Authentication and Networking
- Troubleshooting OpenStack Compute Services
- Uploading Large Objects In OpenStack
- Using OpenStack Dashboard to Launch and Terminate Instances
- Using OpenStack Object Storage
- Starting OpenStack Block Storage
- Stopping and starting Nova services - Openstack
- Why OpenStack is Popular?
There are a number of ways to monitor computer systems and their services, but the principles remain the same. Adequate monitoring and alerting of services is the only way to ensure that we know there is a problem, before our customers. From SNMP traps to agents running on machines specific to the services running, configuration of monitoring is an essential step in production deployments of OpenStack. This portion of further topics introduces some tools that can be used to monitor services within our OpenStack environment.
| If you would like to become an OpenStack Certified professional, then visit Mindmajix - A Global online training platform: " OpenStack Certification Training Course ". This course will help you to achieve excellence in this domain. |
In researching and developing the monitoring sections for the Grizzly release, we found a wide and varied state of available tools. To that end, we are covering Nagios in this field and will continue to update openstackcookbook.com with information on other available tools.
Monitoring OpenStack Services with Nagios
Nagios is an open-source, mature, and robust network and system monitoring application. It is comprised of a Nagios server and a number of plugins, or checks. Plugins can run either locally to the Nagios server, or as we will be installing them, with the NRPE (Nagios Remote Plugin Execution) plugin. The NRPE plugin allows us to run agent-like checks on remote systems.
| Related Article: Learn OpenStack Tutorial |
How to Start
We will be configuring Nagios on a server that has access to our OpenStack COMPUTE environment hosts with IP address 172.16.0.212. Ensure this server has enough RAM, disk, and CPU capacity for the environment you are running. As a bare minimum in a test environment, it is possible to run this on a VM with 1vCPU, 1.5 GB of RAM, and 8 GB of disk space.
How to Achieve It
To set up Nagios with OpenStack, carry out the following steps:
- Install Nagios server.
- Configure the NRPE plugin on the nodes.
- Configure Nagios with OpenStack checks.
| Related Article: OpenStack Interview Questions and Answers |
Nagios Server
The Nagios server provides the web interface as well as monitors the services. Before we can start monitoring with Nagios, we must install it as follows:
- Configure a server with Ubuntu 12.04 64 bit Version with access to the servers in our OpenStack environment.
- Install Nagios from the Ubuntu repositories:
sudo apt-get update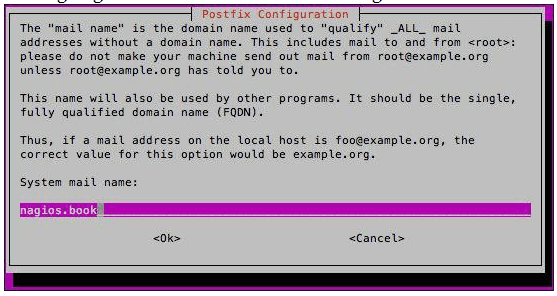
sudo apt-get -y install nagios3 nagios-nrpe-plugin- The installation is interactive and will prompt us to fill in the various options. When presented with Postfix Configuration, select Local only as the mail delivery option if you have no other mail services configured in your environment. This will send all alerts to root on the local box. This is shown as follows:


Tip
If you are installing Nagios in an automated, non-interactive way, you may need to run sudo apt-get -f install to configure Postfix.
- You will then be asked for the host and domain that the local mail delivery will be sent to. Enter the fully qualified domain name (FQDN) of the host that is running Nagios. This is as shown in the following screenshot:

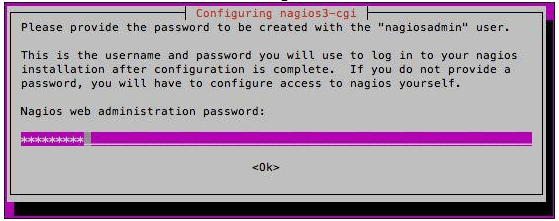
- We will then be asked to enter and confirm a password for the “nagiosadmin” user, which will be used to log in to the Nagios web interface as shown in the following screenshot:

- At this stage, we have a basic installation of Nagios that is gathering statistics, for the running machine where we have just installed Nagios. This can be seen if you load up a web browser and browse to https://nagios.book/nagios3 as shown below:

.png&w=16&q=75)
- Configuration of Nagios server is done in the /etc/nagios3/conf.d/*.cfg. Here, we will use individual configuration files to provide a definition for each host and the services it will run.
- We can now proceed to configure the nodes, controller and compute.


Configuring NRPE on Nodes
With the Nagios server installed, we can now configure the Nagios NRPE on each node, where we want to monitor:
- We first need to install the nagios-nrpe-server and nagios-plugins- standard package on our OpenStack hosts. So, for each one, we execute the following:
sudo apt-get update
sudo apt-get -y install nagios-nrpe-server nagios-plugins-standard- Once installed, we need to configure this so that our Nagios server host is allowed to get information from the node. To do this, we edit the /etc/nagios/npre.cfg file and add in an allowed_hosts. For example, to allow our Nagios server on IP address 172.16.0.212, we add the following entry in:
allowed_hosts=172.16.0.212- Additionally, we need to modify the same /etc/nagios/nrpe.cfg file to specify the commands to be used when running checks. The checks listed will need to be placed in the same cfg file of the node running the respective service.
On the Controller Server
Add the following to /etc/nagios/nrpe.cfg:
command[check_keystone_api]=/usr/lib/nagios/plugins/check_http
localhost -p 5000 -R application/vnd.openstack.identity
command[check_keystone_procs]=/usr/lib/nagios/plugins/check_procs -C
keystone-all -u keystone -c 1:1
command[check_glance_api_procs]=/usr/lib/nagios/plugins/check_procs - C
glance-api -u glance -c 1:4 command[check_glance_registry]=/usr/lib/nagios/plugins/check_procs -C glance-registry -u glance -c 1:2
command[check_nova_api]=/usr/lib/nagios/plugins/check_http localhost -p
5000 -R application/vnd.openstack.identity
On the Computer Server
Add the following to /etc/nagios/nrpe.cfg:
command[check_nova_metadata]=/usr/lib/nagios/plugins/check_procs -C
nova-api-metadata -u nova -c 1:4
command[check_nova_compute]=/usr/lib/nagios/plugins/check_procs -C
nova-compute -u nova -c 1:4
For Swift
To check Swift, you will need to install the check_swift plugin in the /usr/lib/nagios/plugins folder of your swift servers. At the time of writing, this plugin can be downloaded from: https://exchange.nagios.org/directory/Plugins/Clustering-and-High-2DAvailability/check_swift/details
This can be set up as followed in the swift server’s /etc/nagios/nrpe/nrpe.cfg file:
command[check_swift_api]=/usr/lib/nagios/plugins/check_swift check_swift -A https://172.16.0.200:5000/v2.0/ -U swift -K swift -V 2 -c nagiosRemaining OpenStack Services
In addition to the above services, you can add additional OpenStack related checks to your environment using similar check_procs commands and the NRPE server on your various nodes. Additionally, while outside the scope of this book, there is a robust set of Chef cookbooks for Nagios, so you can integrate monitoring as you scale out your OpenStack build.
Once the lines are in on each of the node’s nrpe.cfg files, we can restart the nagios-npre server service to pick up the change:
service nagios-nrpe-server restartConfiguring Nagios to Monitor OpenStack Nodes
Now that we have configured NRPE checks on each of our OpenStack nodes, we now need to tell our Nagios server which hosts it should be monitoring with the NRPE plugin. To do this, we need to create a file for each node in /etc/nagios3/conf.d/ on the Nagios server.
Following is the example file for the controller (/etc/nagios3/conf.d/cookbook-controller.cfg) nodes:
define host{

use
|
generic-host |
host_name |
controller |
alias | controller |
address |
172.16.0.200 |
} |
define service{ host_name controller
check_command check_nrpe_1arg!check_keystone_api use generic-service
notification_period 24x7 service_description cookbook-keystone
}
define service { host_name controller
check_command check_nrpe_1arg!check_keystone_procs use generic-service
notification_period 24x7 service_description cookbook-keystone_procs
}
define service { host_name controller
check_command check_nrpe_1arg!check_glance_api_procs
use generic-service notification_period 24x7
service_description cookbook-glance_api_procs
}
define service { host_name controller
check_command check_nrpe_1arg!check_glance_registry use generic-service
notification_period 24x7
service_description cookbook-glance_registry
}
define service { host_name controller
check_command check_nrpe_1arg!check_nova_api use generic-service
notification_period 24x7 service_description cookbook-nova_api
}
Following is the example file for the compute (/etc/nagios3/conf.d/cookbook-compute.cfg) nodes:
define host{

use
|
generic-host |
host_name |
compute |
alias |
compute |
address |
172.16.0.201 |
} |
define service { host_name compute
check_command check_nrpe_1arg!check_nova_compute use generic-service
notification_period 24x7 service_description cookbook-nova_compute
}
define service { host_name compute
check_command check_nrpe_1arg!check_nova_metadata use generic-service
notification_period 24x7 service_description cookbook-nova-metadata
}
If building checks for the remaining OpenStack services, you will need to configure them similarly:
| Explore OpenStack Sample Resumes! Download & Edit, Get Noticed by Top Employers! |
How it Works
Nagios is an excellent, open-source networked, resource-monitoring tool that can help you analyze resource trends and identify problems with our OpenStack environment. Configuration is very straightforward, with out-of-the-box configuration providing monitoring checks. By adding in a few extra configuration options and plugins, we can extend this to monitoring our OpenStack environment.
Once Nagios has been installed, we have to do a few things to configure it to produce graphed statistics for our environment:
- Configure the NRPE on each of the individual nodes that we are monitoring to check for role-specific issues (nova-compute). This is configured with the command option in the /etc/nagios/nrpe/nrpe.cfg file.
- We then define the corresponding hosts on the Nagios server by creating individual configuration files that describe how and when to run those services. These are defined in /etc/nagios3/conf.d/*.cfg on the Nagios server.
- Finally, we restart the nrpe-server service on the nodes as well as the Nagios server service on the Nagios server.

.svg&w=750&q=75)
Stay updated with our newsletter, packed with Tutorials, Interview Questions, How-to's, Tips & Tricks, Latest Trends & Updates, and more ➤ Straight to your inbox!
| Name | Dates | |
|---|---|---|
| OpenStack Training | Apr 27 to May 12 | View Details |
| OpenStack Training | Apr 30 to May 15 | View Details |
| OpenStack Training | May 04 to May 19 | View Details |
| OpenStack Training | May 07 to May 22 | View Details |


Ravindra Savaram is a Technical Lead at Mindmajix.com. His passion lies in writing articles on the most popular IT platforms including Machine learning, DevOps, Data Science, Artificial Intelligence, RPA, Deep Learning, and so on. You can stay up to date on all these technologies by following him on LinkedIn and Twitter.


Copyright © 2013 - 2024 MindMajix Technologies