
- Alteryx vs Tableau
- The Assistance of Tableau Rest API, You Can Now Automate Server Administration Tasks
- How to Blend Different Data sources in a Single Worksheet in Tableau
- Tableau Essentials
- Components Of Data Warehouse - Tableau
- How to Connect to Your Data and Generated Values of Tableau
- Create Visual Analytics Using Tableau Desktop
- Generate a new data with forecasts in an ad hoc analysis environment
- Future and Career Growth as a Tableau developer
- Import Custom Geocode Data / Map in Tableau
- Tableau Essentials: Chart Types
- How to Enhance Views with Filters, Sets, Groups and Hierarchies in Tableau?
- How to become a Tableau Developer -A Perfect Guide
- How to edit views in tableau server?
- Detailed Guide to Get Certified in Tableau
- Building Interactive Tableau Dashboards
- Introducing the Tableau Desktop Workspace - Tableau
- How to Join Database Tables with Tableau
- Introduction to Joins In Tableau
- Lumira Vs Tableau
- Top Reasons To Learn Tableau
- Authoring and editing reports via server in tableau
- Tableau 10.2.1 – New Capabilities and Corrected Issues in TABLEAU
- Tableau Advanced Interview Questions
- Introduction to Tableau API
- Why Tableau is Considered the Best BI Tool ?
- Growth of Tableau BI (Business Intelligence) Among Trending Technologies
- Tableau Calculated fields
- Table calculation in Tableau
- Tableau Careers and Salaries
- Tableau Case Statements
- Tableau Certification
- Create Pie charts, Scatter Plot, Area Fill charts & Circular View in Tableau
- Tableau Competitors
- Tableau Data Blending
- Tableau Desktop Tutorial
- Tableau Drivers
- Tableau Ecosystem Contains Of Different Components
- Tableau Latest Version
- What are the web mapping service pros and cons in tableau?
- Tableau Maps Tutorial
- Tableau Parameters
- Tableau Reporting
- Tableau Reporting Tool
- Tableau Reshaper Tool
- Tableau Server
- Tableau Server interview Questions
- Tableau Server Tutorial
- Tableau Show Me feature
- Tableau Tutorial
- Tableau Version History
- Tableau Visualization Course and its advantages in the current job market
- Tableau vs Cognos
- Tableau vs Domo
- Tableau vs Looker
- Tableau Vs Microstrategy
- Tableau vs Power BI
- Tableau vs QlikView
- Tableau Vs Spotfire
- Animating maps using the pages shelf or slider filters in Tableau
- Succession Planning analytics and Hr Dashboard in Tableau
- How to publish dashboards in tableau server?
- How Tableau geocodes your data?
- How to use Date Field in Tableau?
- How the Table Calculations Use Building Formulas in Tableau
- How to Add Flexibility to Calculations with Parameters in Tableau
- How to Build your first Advanced Dashboard in Tableau?
- How to Change the Scope of Trend Lines Tableau
- How to configure tableau server for the first time?
- How to consume information in tableau server?
- How to create a Standard Map View in Tableau?
- How to Create Calculated Values using Dialog Box in Tableau
- How to Customize Shapes, Colors, Fonts and Images in Tableau?
- How to deploy tableau server in high availability environments?
- How to deploy tableau server in multi-national entities?
- How to Determine your Hardware and Software needs in Tableau server?
- How to embed tableau reports securely on the web?
- How to improve appearance to convey meaning more precisely in tableau?
- Install Tableau Server and Reasons to Deploy it
- How to Install the Command Line Tools in Tableau?
- How to monitor activity on tableau server?
- How to organize reports for consumption in tableau server?
- How To Sort Data In Tableau
- Use Custom Background Images to Plot Spatial Data
- How to use maps to improve insight in Tableau?
- How to use performance recorder to improve performance in tableau server?
- Tableau Subscription and Report Scheduling
- How to use tabadmin for administrative task automation in tableau?
- How to Use Table Calculation Functions in Tableau
- Learning to leverage tabcmd in tableau
- Leverage existing security with trusted authentication in tableau server
- Managing tableau server in the cloud
- Planning for a successful tableau deployment at ACT
- How to Plot Your Own Locations on a Map in Tableau
- Tableau Self-Service Ad Hoc Analysis with Parameters
- Quality metrics in a hospital in tableau
- Trend Lines and Reference Lines In Tableau
- What Are Calculated Values and Table Calculations in Tableau?
- What are the advanced chart types in tableau?
- Tableau Dashboard Best Practices
- What are the common use cases for tabcmd in tableau?
- What are the licensing options for tableau server and tableau online?
- What are the Options for Securing Reports in Tableau?
- Sharing Connections, Data Models, Data Extracts in Tableau
- What are the tips, tricks and timesavers in tableau?
- What are the typical map errors and how to deal with them in tableau?
- What do tabcmd and tabadmin do in tableau’s command line tools?
- Tableau Aggregate Functions
- What is the right way to build a dashboard in tableau?
- What is the wrong way to build a dashboard in tableau?
- What kinds of tasks can be done with tabcmd commands
- When and how to deploy server on multiple physical machines in tableau?
- Tableau Extracts or Direct Connection - When to Use
- The Practicality of Using Tableau Mobile to Create Visualization
- Web Data Connector in Tableau Server
- Data Visualization and its influence on Businesses
- Tableau Charts Types
- How to Use Date Functions in Tableau
- Tableau Architecture and Ecosystem Components
- Looker vs Power BI
- How to Create Sets in Tableau
- Tableau Projects and Use Cases
- Tableau Integration with Salesforce
- Excel vs Tableau
- Tableau Server Administration
The practice of data visualization is becoming crucial to bridge the gap between the human and a machine to mediate analytical insight in a productive way.
Almost 50% of Fortune 500 companies have started using Tableau. So the demand for skilled tableau professionals has been increasing over the years. So, if you wish to start your career in data visualization, then get trained from the MindMajix Tableau Training.
We have compiled here Frequently Asked Tableau Interview Questions and Answers. The questions presented in this blog are collected based on the opinions of tableau experts.
To make it easy and understandable format, we have divided these questions into three categories as Freshers, Experienced, and Real-time.
Top 10 Frequently Asked Tableau Interview Questions
- What is TABLEAU?
- Why Tableau?
- What is data visualization?
- What is the latest version of Tableau Desktop?
- What are the products offered by Tableau? Explain a few things about them.
- Define LOD Expression?
- List out Tableau File Extensions.
- What are the different Joins in Tableau?
- How to create a calculated field in Tableau?
- State some ways to improve the performance of Tableau.
| If you want to enrich your career and become a professional in Data Visualization, then enroll in "Tableau Training". This course will help you to achieve excellence in this domain. |
Basic Tableau Interview Questions and Answers
1. What is TABLEAU?
Tableau is the most powerful and fastest visualizing tool that is used in the Business Intelligence(BI) Industry. It simplifies the raw data into an understandable format. Analysis of the data becomes faster with Tableau. The visualizations can be created in the form of dashboards. The visualizations or diagrammatic representation of data can easily be understood by the employees of the organizations who are at different levels.
2. What is Data Visualization?
Data visualization means the graphical representation of data or information. We can use visual objects like graphs, charts, bars, and a lot more. Data visualization tools provide an accessible way to see and understand the data easily.
3. List out Tableau File Extensions.
Below are a few extensions in Tableau:
- Tableau Workbook (.twb)
- Tableau Data extract (.tde)
- Tableau Datasource (.tds)
- Tableau Packaged Datasource (.tdsx)
- Tableau Bookmark (.tbm)
- Tableau Map Source (.tms)
- Tableau Packaged Workbook (.twbx) – zip file containing .twb and external files.
- Tableau Preferences (.tps).
4. What is the latest version of Tableau Desktop?
Tableau Desktop's latest version is 2021.3(as of, 7thSep 2021).

5. Define LOD Expression?
LOD Expression stands for Level of Detail Expression, and it is used to run complex queries involving many dimensions at the data sourcing level.
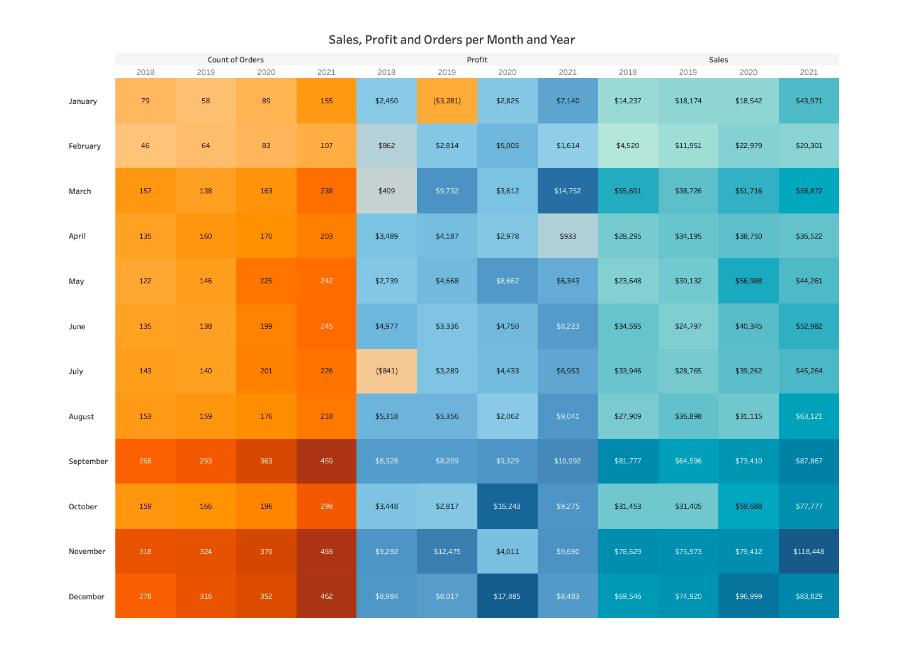
6. Define HeatMap?
A heatmap is a graphical representation of data that uses the color-coding technique to represent different values of data. As the marks heat up due to their higher value, dark colors will be shown on the map.
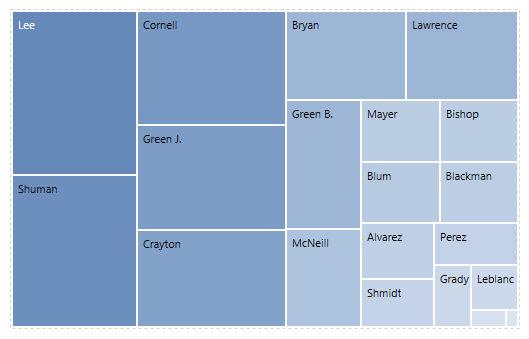
7. Define TreeMap?
TreeMap is a visualization that organizes data hierarchically and shows them as a set of nested rectangles. The size and colors of rectangles are respective to the values of the data points they project. Parent rectangles will be tiled with their child elements.
8. What is the difference between a Heat map and Treemap?
TreeMap Heat MapIt represents the data hierarchically and shows them as a set of nested rectangles. It represents the data graphically which uses multiple colors to represent different values. It is used for comparing the categories with colors, and size, and it can also be used for illustrating the hierarchical data and part-to-whole relationships. It is used for comparing the categories based on color and size. And also it is great in spotting patterns based on the density of the information.
The colors and size of rectangles are respective to the values of the data points When their values are higher or the density of records, the data will represent in dark color.
9. What is a parameter Tableau? And how does it work?
Parameters are dynamic values, we can replace the constant values in calculations.
10. What are the different data types in Tableau?
Tableau supports below data types. Data TypeMeaningExamplesStringCharacter Sequence. Enclosed in ''.Tableau', 'World'Number (Whole)Integers9Number (decimal)Floating values.123.45BooleanThey are logical values.TRUE, FALSEDateDate"02/01/2015"Date & TJmeDate and Time01 January 2019 05:55:00 PMGeographic ValuesGeographical ValuesIndia, Italy, Canada
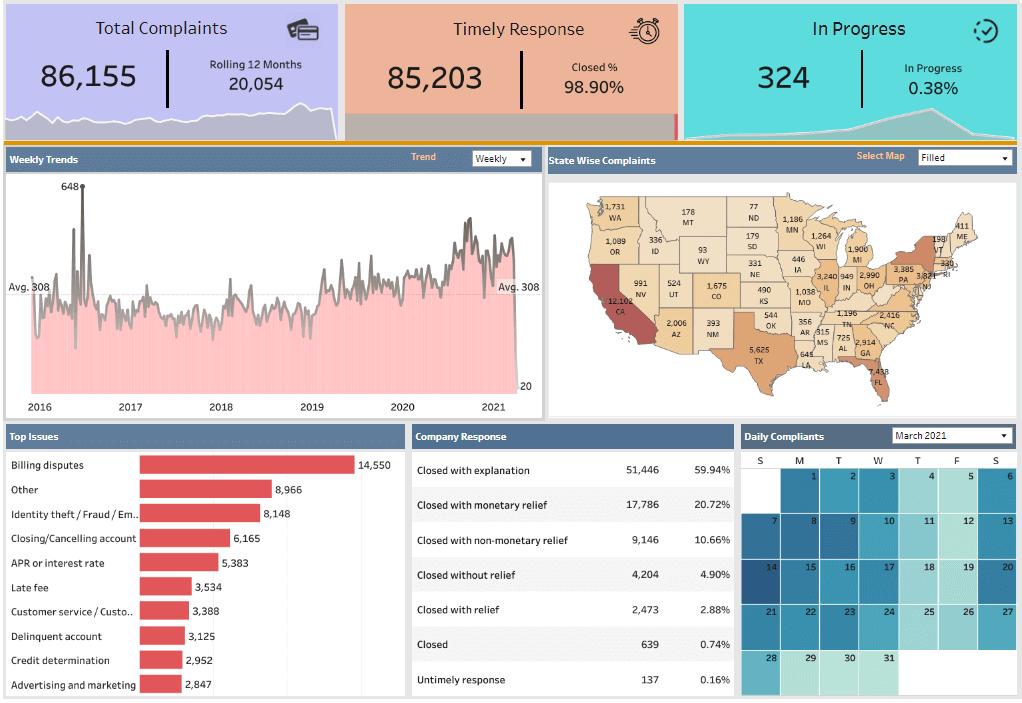
11. Give a brief about the tableau dashboard?
Tableau dashboard is a group of various views that allows you to compare different types of data simultaneously. Datasheets and dashboards are connected if any modification happens to the data that directly reflects in dashboards. It is the most efficient approach to visualize the data and analyze it.
[ Related Article: The Right Way to Build a Dashboard ]
12. Define Page Shelf in Tableau?
Page shelf breaks the views into a series of pages. It displays an alternate view on each page. Due to this feature, you can analyze the effect of each field on the rest of the data in the view.
13. Define the story in Tableau?
The story can be defined as a sheet which is a collection of series of worksheets and dashboards used to convey the insights of data. A story can be used to show the connection between facts and outcomes that impacts the decision-making process. A story can be published on the web or can be presented to the audience.
14. Give an overview of the facts and dimensions of the table?
Facts are numeric measures of data. They are stored in fact tables. Fact tables store the type of data that will be analyzed by dimension tables. Fact tables have foreign keys associated with dimension tables.
Dimensions are descriptive attributes of data. Those will be stored in the dimensions table. For example, customer information like name, number, and email will be stored in the dimension table.
15. State some ways to improve the performance of Tableau
- Use an Extract to make workbooks run faster
- Reduce the scope of data to decrease the volume of data
- Reduce the number of marks on the view to avoid information overload
- Try to use integers or Booleans in calculations as they are much faster than strings
- Hide unused fields
- Use Context filters
- Reduce filter usage and use some alternative way to achieve the same result
- Use indexing in tables and use the same fields for filtering
- Remove unnecessary calculations and sheets
16. Explain different connection types in Tableau?
There are 2 connection types available in Tableau.
Extract: Extract is a snapshot of data that will be extracted from the data source and put into the Tableau repository. This snapshot can be refreshed periodically fully or incrementally. This can be scheduled in Tableau Server.
Live: It creates a direct connection to the data source and data will be fetched directly from tables. So, data will be up-to-date and consistent. But, this also affects access speed.
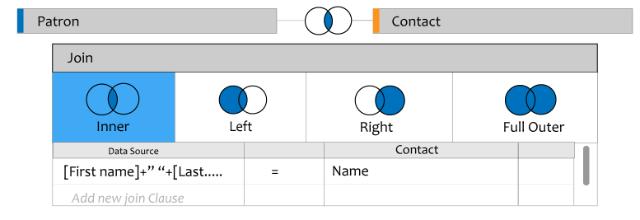
17. What are the different Joins in Tableau?
Tableau works the same as SQL. So, it supports all Joins possible in SQL
- Left Outer Join
- Right Outer Join
- Full Outer Join
- Inner Join.
18. What is Data Modelling?
Data modeling is the analysis of data objects that are used in a business or other context and also used as identification of the relationships among these data objects. It is the first step of doing object-oriented programming.
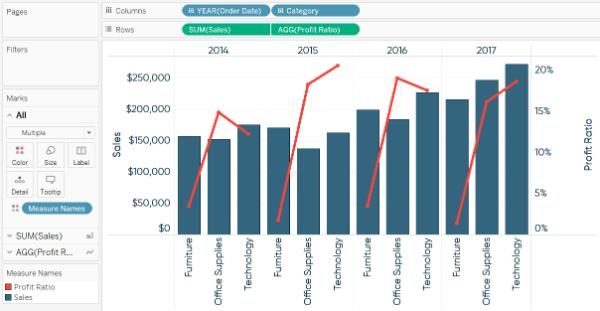
19. Define Dual-axis?
Dual-axis is used to show 2 measures in a single graph. It allows you to compare 2 measures at once. Many websites like Indeed use this Dual-axis to show the comparisons and growth rate.
20. Define blended axis?
Multiple measures can share in a single axis so that all the marks will be shown in a single pane. We can blend measures by dragging the 1st measure on one axis and the 2nd on the existing axis.
21. Define shelves and sets?
Shelves: Every worksheet in Tableau will have shelves such as columns, rows, marks, filters, pages, and more. By placing filters on shelves we can build our own visualization structure. We can control the marks by including or excluding data.
Sets: The sets are used to compute a condition on which the dataset will be prepared. Data will be grouped together based on a condition. Fields which is responsible for grouping are known assets. For example – students having grades of more than 70%.
22. Explain the limitation of context filters in Tableau?
Whenever we set a context filter, Tableau generates a temp table that needs to refresh each and every time, whenever the view is triggered. So, if the context filter is changed in the database, it needs to recompute the temp table, so the performance will be decreased.
23. What is Mark Card in Tableau?
There is a card to the left of the view where we can drag fields and control mark properties like color, size, type, shape, detail, label, and tooltip.
24. Define published data source?
When you are ready to make a data source available to other Tableau desktop users. You can publish it to the Tableau server or online. Or else you can make it available by saving the same like an embedded excel or text file.
25. Define Dual axis?
Dual-axis is used to show 2 measures in a single graph. It allows you to compare 2 measures at once. Many websites like Indeed use this dual-axis to show the comparisons and growth rate.
26. Define Bullet graph?
A bullet graph is a variant of Bar graph. It is responsible for comparing the performance of one measure with other measures.
27. Define Gantt chart?
Gantt Chart displays the progress of value over the period. It consists of bars along with the time axis. It is a project management tool. Here, each bar is a measure of a task in the project framework.
28. Define a Histogram chart?
A histogram chart shows the distribution of continuous information over a certain period of time. This chart helps us to find extreme points, gaps, unusual values, and more concentrated values.
29. What are the file size limitations with Tableau?
In Tableau, there are no limitations to the file sizes. Moreover, there is no row or column limit to import the data.
30. What is Tableau Reader?
Tableau Reader is a free desktop application, where you can read and interact with the Tableau packaged workbooks. It can only open the files but cannot create new connections to the workbook.
31. What is the difference between published data and embedded data sources?
The published data source contains connection information that is independent of workbooks and can be used by multiple workbooks.
The embedded data source contains connection information but it is associated with the workbooks.
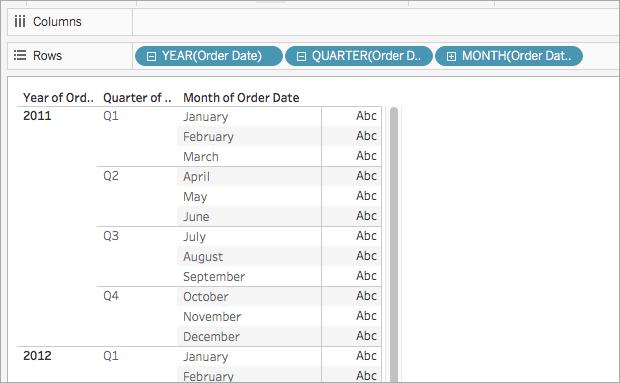
32. What is the Hierarchy in Tableau?
When we are working with large volumes of data, incredible data may be messed up. With Tableau, you can easily create hierarchies to keep your data neat. Even if you don’t need it, it is built into your data, which you can easily manage or organize the data and you can track the data easily.
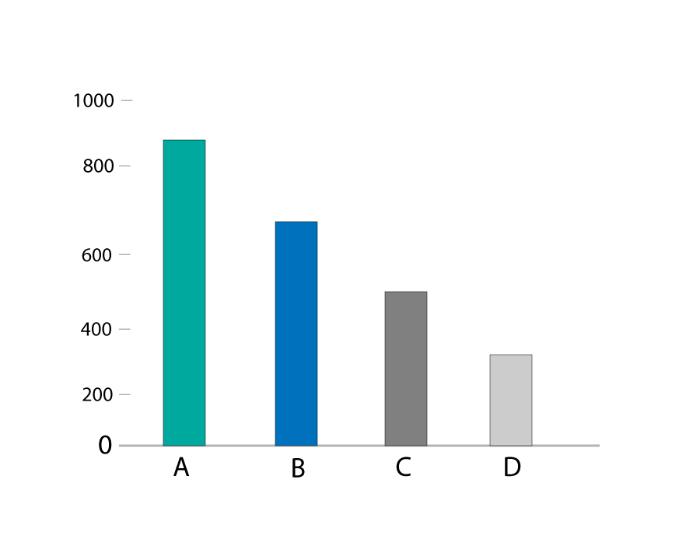
33. What is a Column chart?
A column chat visualizes the data as a set of rectangle columns, as their lengths are proportional to values when they represent the data. The horizontal axis shows the category to which they belong, and the vertical axis shows the values.
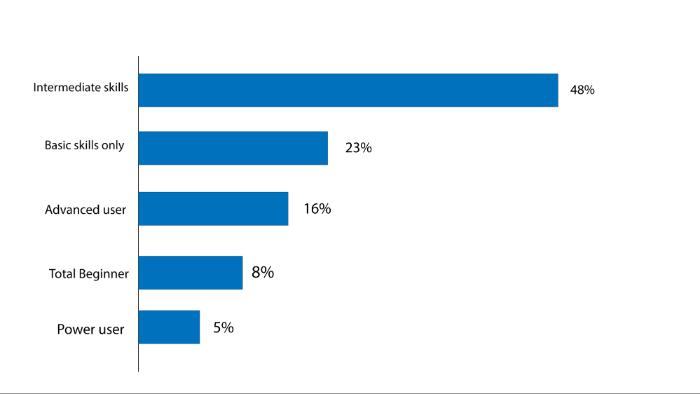
34. What is the Bar Chart in Tableau?
The bar chart visualizes the data as a set of rectangle bars, as their values are proportional to lengths when they represent the data. The vertical axis shows the category to which they belong to and the horizontal axis shows the values. So, the bar chart is a vertical version of the Column chart.
35. What is the Line Chart?
The line chart is a popular type of diagrammatic way for visualizing the data, it connects the individual data points to view the data. We can easily visualize the series of values, we can see trends over time or predict future values. The horizontal axis holds the category to which it belongs and the vertical axis holds the values.
36. What is a Stacked Bar chart?
Stacked Bar Chart, composed of multiple bars stacked horizontally, one below the other. The length of the bar depends on the value in the data point. A stacked bar chart makes the work easier, they will help us to know the changes in all variables presented, side by side. We can watch the changes in their total and forecast future values.
37. What is a Stacked Column Chart?
Stacked Column Chart, composed of multiple bars stacked vertically, one on another. The length of the bar depends on the value in the data point. A stacked column chart is the best one to know the changes in all variables. This type of chart should be checked when the number of series is higher than two.
38. What is an Area Chart?
An area chart is nothing but a line chart, the area between the x-axis and lines will be color or patterns. These charts are typically used to represent accumulated totals over time and are the conventional way to display stacked lines.
[ Check out Tableau Charts ]
39. How to download Tableau Public?
Step 1: Go to public.tableau.com and enter your e-mail address and click “ Download the App “.
Step 2: After downloading the file, run the file and follow the prompts to install Tableau.
Step 3: Now, you can see the Tableau shortcut on your desktop.
Step 4: Double click on the icon, to load Tableau public. Now you see the screen below.
40. What is a Context Filter and what are the steps to create the Context Filter Tableau?
Context Filters are applied to the data rows before any other filters. They are limited to views, but they can be applied on selected sheets. They define Aggregation and Disaggregation of data in Tableau
Step 1: Drag the subcategory dimensions to the row shelf and measure sales to the column shelf. Now choose the horizontal bar chart as chart type and again drag the sub-category dimensions to the filter shelf. Then we will get the following chart.
Step 2: Right-click on the Sub-Category field in the filter shelf and go to the Top fourth tab. Choose the option field, from the next drop-down and choose the option Top 10 by Sales Sum as shown in the following screenshot.
Step 3: Drag the dimension Category to the filter shelf. Right-click on the general tab to edit and under that choose Furniture from the list. As you can see the result shows three subcategories of products.
Step 4: Right-click the Category: Furniture filter and select the option Add to Context. This produces the final result, which shows the subcategory of products from the category Furniture which are among the top 10 subcategories across all the products.
Visit here to learn Tableau Training in Hyderabad
Tableau Interview Questions and Answers For Experienced
41. What are the products offered by Tableau? Explain a few things about them.
Tableau has 4 main products.
- Tableau Prep: Tableau Prep is responsible for preparing data for analysis. This tool provides 3 coordinated views which provide us with a complete picture of data.
- Tableau Desktop: Tableau Desktop is the place where the analysis happens. It has powerful drag and drop analytics which is very easy to use. Through the desktop, you get your data insights quickly.
- Tableau Online: Tableau Online is a secure and scalable self-service analytics cloud tool. You can use it anywhere, anytime and it has eliminated the complexities of IT.
- Tableau Server: From small to large enterprises, Tableau server is used for fulfilling their BI requirements. This is an on-premise solution. This tool can take data from anywhere and shared it across the organization through the desktop or mobile browsers.
42. Differentiate parameters and filters in Tableau
Filters are the simpler and more straightforward feature in Tableau. It applies to dimensions or measures directly. For example, to only show Gujarat or Karnataka in a State dimension, we can apply the filter on that. In Tableau, there are multiple UI options available for filters like radio buttons, drop-down lists, checkboxes, sliders, and more. Filters on sheets are also available in Tableau.
Parameters are like variables. They are complex and more powerful. Like a variable, a parameter can be used in calculations. So, that means, it only allows a single value. Parameters have the same UI options except for checkboxes because checkboxes don’t have a single value. For example, we can create a parameter for interest rate and period, and then we can use these parameters to calculate interest and principal payments.
43. Explain how many types of filters are available in Tableau?
Filters are used to provide the correct information to viewers after removing unnecessary data. There are various types of filters available in Tableau.
- Extract Filters – Extract filters are used to apply filters on extracted data from the data source. For this filter, data is extracted from the data source and placed into the Tableau data repository.
- Datasource Filters – Datasource filters are the same as extract filters. They also work on the extracted dataset. But, the only difference is it works with both live and extract connections.
- Context Filters – Context Filters are applied on the data rows before any other filters. They are limited to views, but they can be applied on selected sheets. They define Aggregation and Disaggregation of data in Tableau
- Dimension Filters – Dimension filters are used to apply filters on dimensions in worksheets. Dimension filters are applied through the top or bottom conditions, formula, and wildcard match.
- Measure Filters – Measure filters are applied to the values present in the measures.
44. Differentiate between Tiled and Floating in Dashboards?
In a tiled layout, items don’t overlap. The layout will be adjusted according to the dashboard size. In the floating layout, items can be placed on some other layers. Floating items can have fixed positions and sizes.
45. Categorize dimensions in Tableau?
Dimensions are divided into 9 various categories
Slowly ever-changing dimension: The value of the dimension changes over an amount of time for slowly ever-changing dimensions.
Example – student of worker
Chop-chop ever-changing Dimension: Value in the dimension is rapidly changing for chop-chop ever-changing dimensions.
Example – Age (It changes every second)
Unchanged Dimension: Values are constant for unchanged dimensions.
Example – Traffic Signals
Shrunken Dimension: A set of 1 dimension is termed as Shrunken Dimension.
Example – A week is Shrunken dimension for the month
Junk Dimension: Junk values or unrelated dimensions are termed as Junk Dimension.
Conformed Dimension: If any dimension is provided by various business areas, then such a dimension is termed a Conformed Dimension.
Example – Time (9-5) for any company or hospital or college
Degenerated Dimension: Degenerated dimensions have primary keys only without any matter of info.
Role enjoying Dimension: If one dimension is employed in multiple roles, then they are termed as Role enjoying Dimensions.
Example – Date for e-commerce site order (Date of Order, Date of Shipment, Date of delivery)
Inferred Dimension: Empty dimensions are called inferred dimensions. They are usually used in ETL.
Example – Customer email which he may not enter while submitting any form will be filled as null.
46. What is VIZQL in Tableau?
VIZQL is Visual Inquiry Language. It is a combination of VIZ and SQL. It is similar to SQL language. But instead of SQL commands, the VIZQL language converts data queries into visual images.
47. Explain the disaggregation and aggregation of data in Tableau?
Aggregation → The process of summarizing the data and viewing a single numeric value is called aggregation. Example – sum/avg of salary for each employee
Disaggregation →The process of viewing each transaction for analyzing all the measures both dependently and independently. Example – individual salary transactions for each employee.
48. State the components of the Dashboard?
The dashboard consists of 5 components.
- Web: it consists of a web page embedded in the dashboard.
- Horizontal component: it is a horizontal layout container in which we can add objects.
- Vertical component: it is a vertical layout container in which we can add objects.
- Image Extract: it allows you to upload an image to the dashboard from a computer.
- Text: it is a small Wordpad where we can format and edit the text.
49. Differentiate discrete and continuous data roles in Tableau
Discrete data roles consist of values that are separate and distinct. Discrete data roles can take individual values within a range. For Example – cancer patients in the hospital, no. of threads in a sheet, state. Discrete values are displayed as blue icons in the data window and blue pills on shelves. Discrete fields can be sorted.
Continuous data roles consist of any value within the finite or infinite intervals. For Example – age, unit price, order quantity. Continuous values are displayed as green icons in the data window and green pills on shelves. Continuous fields cannot be sorted.
50. What is the difference between Traditional BI Tools and Tableau?
Traditional BI Tableau BI Architecture has hardware limitations. Tableau does not have dependencies. It does not support in-memory, multi-thread, and multi-core computing. It supports memory when using advanced technologies. It has a predefined view of data. It uses predictive analysis for various business operations. We should need a good knowledge of BI and skills. It is easy to work and understanding without the knowledge of BI and the skills data security is provided data security is not provided for the public, whereas in the professional version.
[ Check out Date Functions in Tableau ]
51. Define performance testing in terms of Tableau
We can check the performance of Tableau in the following 2 ways.
- We can create performance recordings to keep track of performance details of main events while interacting with workbooks. Then, these performance metrics can be viewed by the user and analyzed. Navigation to start/stop performance recording is Help→Settings and Performance>→ Start Performance Recording Help→ Setting and Performance → Stop Performance Recording
- Review the logs created by Tableau Desktop. The location for log files is C: Users My DocumentsMy Tableau Repository.
- For live connection, check the log files log.txt and tabprotosrv.txt.
- For Extract connection, check the log file tdeserver.txt
52. What is the difference between .twb and .twbx extensions?
.twb: .twb means Tableau workbook. .twb is an XML sheet, that stores the data about your documents, stories, and dashboards. This file is the reference to the source file such as Excel or tde. This file will be linked to your source file when you save the TWB file. If you want to share your workbook you need to send both the workbook and data source file.
.twbx: It is a compressed file, where you have all files. It includes data source files, twb, and other files to produce the workbook. TWBX is obsolete for sharing because it will share the copy of the file instead of an original source file. .twbx is used for reports and we can view them using the Tableau viewer.
53. Why Tableau?
- Tableau is very simple and user-friendly.
- Tableau helps in analyzing the data and using this one can change the raw data into an understandable format.
- Users can blend the data with the other data to create their own views on the data and to share it with the customers, and colleagues.
- Users can manage a large amount of data.
- It can easily integrate with multiple data sources.
- Tableau can create complex graphs which simply look like pivot table graphs in Excel.
- It gives quick calculations on datasets.
- Users can create the visuals easily and switch between the types, to find the model to represent the user messages.
54. How to create a calculated field in Tableau?
Step 1: Select Analysis -> drop down will open -> Select Create calculated field
Step 2: The Calculation Editor Box will open, and give the name to the calculated field.
Step 3: Enter a formula in the calculation editor.
Example: Sum(Profits)/Sum(Sales). (Calculation Editor validates the formula)
Step 4: Click, OK.
Now, the new calculated field added to the data pane.
Real-Time Tableau Interview Questions and Answers
55. Are there any limitations of parameters in Tableau? If yes, give details.
Tableau dashboard allows the representation of parameters in four ways only. They don’t allow any multiple values like a filter can do. They only allow a single value.
56. State some reasons for the low performance of Tableau? Explain in detail.
The following are the reasons for low performance
- Filters - filters need to create an extra query and if it is used in large numbers and inefficiently then they can reduce the performance. So, it is advised to use filters whenever it is mandatory
- Live connection - Tableau extract works much better in comparison with a live connection.
- Data sources - a wrong query to a wrong data source can reduce performance. Also, the data source’s performance can also affect Tableau’s performance.
57. State some ways to improve the performance of Tableau.
Following are a few ways to improve the performance
- Use an Extract to make workbooks run faster
- Reduce the scope of data to decrease the volume of data
- Reduce the number of marks on the view to avoid information overload
- Try to use integers or Booleans in calculations as they are much faster than strings
- Hide unused fields
- Use Context filters
- Reduce filter usage and use some alternative way to achieve the same result
- Use indexing in tables and use the same fields for filtering
- Remove unnecessary calculations and sheets.
58. Tell me different ways to use parameters in Tableau
- Filters
- Calculated fields
- Actions
- Measure-swaps
- Changing views
- Auto-updates.
59. Can we see SQL generated by Tableau Desktop?
Tableau Desktop Log files are placed in C: UsersMy DocumentsMy Tableau Repository. In case of live connection to any data source, check the log file “log.txt” and “tabprotosrv.txt” files. In case of extract connection to any data source, check the “tdeserver.txt” file which has detailed information about queries.
60. If the owner of the published workbook license expires, then can other users see those workbooks?
If the owner of a published workbook license expires then his/her role will change to “Unlicensed”. He/She cannot access those workbooks, but others can. Only site admin can change the ownership of those workbooks.
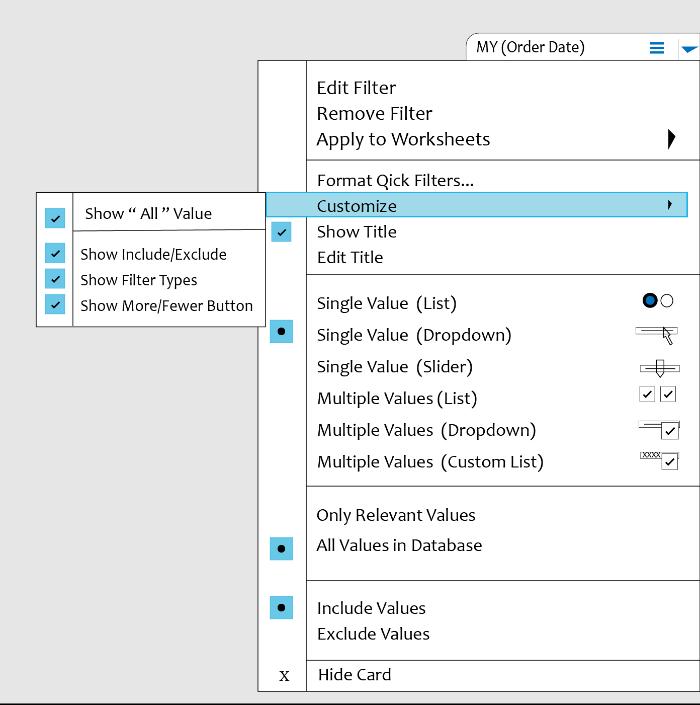
61. Can we remove the All options from a Tableau auto-filter?
Follow few steps
- Go to the Segment filter, Click on the small drop arrow which is on the right side.
- Select Customize.
- Then we can visible a small dropbox under customize, uncheck the option for “ All” Value.
62. Which one is better? Extract or Live connection?
Extract connection is better than live connection because extract connection can be used from anywhere, anytime without connecting to the database. We can construct our own visualizations on it irrespective of the database connection.
63. Tell me something about the workbook version controlled in Tableau.
Versioning of workbooks can be done in 2 ways in Tableau.
- At the desktop level, you keep copies of your changes and files or use 3rd party system like Microsoft TFS.
- At the server level, where you publish the data source and version will be saved in revision history on Tableau Server or Online. Reverting to a previous version is also possible here.
64. Where can we apply global filters?
Global filters can be applied to sheets, stories, and dashboards.
65. How to add custom color to Tableau?
To add custom color in Tableau, we need to follow 3 steps
- Generate a custom color code and create it in “Preferences.tps”
- Navigate to Documents→ My Table Repository→ Preferences.tps
- Add a note for custom color code
66. Can we create cascading filters without using context filters?
Cascading filters mean filter2 values are dependent on filter1 values. For Example, filter1 is country and if we select “India” for filter1, filter2 values should show all Indian states. This feature we can achieve by using the option “Only Relevant Values”.
67. How can we display the top and bottom 5 of records in a single Tableau view?
To achieve this, we need to create 2 views
- View1 which contains the top 5 records
- View2 which contains the bottom 5 records
- View3 which is a join of View1 and View2
68. State a few charts that we should not use with valid reasons
Below are a few charts that we should avoid.
- 3D Charts: Visual representation of numbers in 3D charts will be skewed and it makes it difficult to compare and analyze.
- Pie Charts: Pie charts are not as accurate as bar charts. In Pie charts, we have areas and angles to compare instead of length in a bar chart. Areas and angles cannot be analyzed with ease.
- Donut Charts: This is the same as the Pie chart, but here, we have a hole in the middle to make it look like a donut. Due to that hole, we need to compare arc length with other arcs to analyze the values. Comparing arc lengths is also a difficult task for our eyes.
69. Do we have any way to handle null values in Tableau?
Tableau cannot plot null values on the-axis. So, it will display an indicator at the lower right corner of the view. Once you click on that indicator, you have options to handle null values. Below are the options available to handle null values.
- Filter Data – If you choose this option, null values will be filtered out from the view.
- Show Data at Default Position – It replaces the null value with the default value and shows the data at the default position on-axis. These default values depend on the data type of field. Below are the defaults of a specific data type.
- Numbers →0
- Dates → 12-31-1899
- Geographic Location → (0,0)
- Negative Values → 1
70. Do we have any data limitations in Tableau Public?
Yes, Tableau Public can only allow 10 million rows to users for data visualization.
| Related Article: Create Pie charts, Scatter Plot, Area Fill charts & Circular View in Tableau |
71. Can we download views or workbooks from the server? If yes, in which data formats?
We can download views or workbooks from the server. But, data formats available to us depend on the permissions granted by site administrators or content owners.
- Image: .png format
- Data: .csv file.
We can also download selected sheets into PDF format, but while generating PDF, web page objects won’t be included.
72. Can we use unused columns (Columns that are not used in reports but data source has columns) in Tableau Filters?
Yes, we can use unused columns in tableau filters.
Let us consider one example.
In the data source, I have columns like emp_id, emp_name, emp_sal, emp_dep, and emp_designation. But, in reports, I am using emp_name in columns and emp-sal in rows. I can use emp_designation on filters.
73. What is the benefit of the Tableau extract file over the live connection?
Extract files can be used without any connections and you can build your own visualization without connecting to the database.
74. How many tables join are possible in Tableau?
We can join 32 tables in Tableau.
75. Can we place an excel file in a shared location and use it to develop a report and refresh it in regular intervals?
Yes, we can place an excel file in a shared location and we can use it to develop a report, but for better performance, we need to extract the file.
76. How do we do testing in Tableau?
Yes, we can do testing in Tableau by using tools and the easiest way is using the desktop application. We need to check it before we publish it on the Tableau server.
77. Can you get values from two different sources as a single input into a parameter?
Tableau, currently not supporting the multi-valued parameters. As Tableau parameters are not dynamic, we cannot filter the list of values at runtime.
78. Design a view in a map such that if a user selects any state the cities under that state have to show profit and sales.
If you want to show the profit and sales of each and every city under the state in the same worksheet, then follow a few steps.
The data which you want to display under the state, it must be in the same worksheet.
- Double click on the state filed.
- Drag the city and drop it under the state(Mark Card).
- Drag the Sales and drop into the size.
- Drag the Profit and drop it into the color.
- Click on the size legend and increase the size (75%).
- Give a right-click on State filed and select show filter.
- Select the state and check whether you got the required view or not.
In the View, Size indicates the Sales, and Color indicates the profit of the respective state(which you have selected).
79. How can u set permissions or protect the data in tableau public?
Tableau does not have any security permissions or to protect the data in Tableau public. Whatever we shared in Tableau public those files, workbooks can be viewed by all users. There is no security option in Tableau public.
80. If I delete a workbook from tableau public and there are links to other blogs and other web locations. What happens to them?
Tableau public is like a repository, if you delete anything in the Tableau public the data will be lost, even if links are in other locations and blogs. We cannot access those links.
81. Mention whether you can create relational joins in Tableau without creating a new table?
Yes, we can create relational joins in Tableau without creating a new table
82. When publishing workbooks on Tableau online, sometimes an error about needing to extract appears. Why does it happen occasionally?
It happens when the user is trying to publish the workbook which is connected to the internal or local server that means the company’s network.
83. Can parameters have a drop-down list?
Yes, Parameters have their own drop-down list, which enables the users to view the data entries which are available in the parameter during the creation.
84. How do you optimize the performance of the dashboard?
- Minimize the number of fields.
- Minimize the number of records.
- Reduce the marks (data points) in your view( remove unneeded dimensions).
- Reduce the number of filters.
- Use an include filter.
- Use a continuous data filter.
- Use action filters and parameters.
- Reduce the number of nested calculations.
- Remove custom SQL.
- Clean up your workbooks.
85. How to use group in calculations field?
Option 1:
We can create the group by using the calculated field.
- Step 1: Select Analysis-> click the calculated field
- Step 2: Enter the field name (a dialogue box will appear)
- Step 3: Enter the calculation -> Click Ok.
Example:
IF [Container]=’Jumbo Box’ then ‘Big Containers’
ELSEIF [Container]=’Jumbo Drum’ then ‘Big Containers’
ELSEIF [Container]=’Large Box’ then ‘Big Containers’
ELSEIF [Container]=’Medium Box’ then ‘Midsize Containers’
ELSEIF [Container]=’Wrap Bag’ then ‘Midsize Containers’
ELSEIF [Container]=’Small Box’ then ‘Little Containers’
ELSEIF [Container]=’Small Pack’ then ‘Little Containers’
END
The above calculation creates the group with four values: Little Containers, Big Containers, Small Containers, Midsize Containers.
Option 2:
Create a set from the group, and use the set in the calculated field.
Step 1: Right-click on the Data Pane and then select Create Set.
Step 2: Create a set dialogue box that will open,
Enter the field name.
Select the group, on the general tab.
Step 3: Click Ok.
86. Can Tableau be installed on macOS?
Yes, Tableau can be installed on both the Windows Operating system and macOS.
87. How to automate reports in Tableau?
When we are publishing the reports to Tableau Server, there we will find an option to schedule the report, just select the time when you want to refresh the data.
88. Which databases give the best performance when connected live?
Native Database gives the best performance when connected live.
89. What are the challenges faced when working with huge volumes of data?
- View running will be slow.
- Data Extraction.
- Alignment issues with data.
- Testing Data.
Leave an Inquiry to learn Tableau Training in Bangalore
90. State limitation of context filters in Tableau
Whenever we set a context filter, Tableau generates a temp table that needs to refresh each and every time the view is triggered. So, if the context filter will be changed, the database needs to recompute and rewrite the temp table, which in turn slows down the performance.
91. What is a marks card in Tableau?
There is a card to the left of the view where we can drag fields and control mark properties like color, size, type, shape, detail, label, and tooltip.
92. Define a published data source
The published data source has connection information in it. It is independent of any workbook and can be accessed by multiple workbooks.
93. Define blended axis
Multiple measures can share a single axis so that all the marks will be shown in a single pane. We can blend measures by dragging the 1st measure on one axis and the 2nd on the existing axis.
94. Can we remove the “All” option from the auto-filter in Tableau?
Yes, we can. Navigate to filter→ Right-click on it→ select customize→ uncheck the option “Show All”
95. Define Bullet graph
A bullet graph is a variant of a Bar graph. It is responsible for comparing the performance of one measure with other measures.
96. Define Gantt chart
Gantt Chart displays the progress of value over the period. It consists of bars along with the time axis. It is a project management tool. Here, each bar is a measure of a task in the project framework.
97. Define Histogram chart
A histogram chart shows the distribution of continuous information over a certain period of time. This chart helps us to find extreme points, gaps, unusual values, and more concentrated values.
98) What is Tableau Public?
Tableau Public is an open-source and free service that allows anyone to publish the data source and visualizations to the web. These visualizations can then be embedded into blogs or web pages. They can also be distributed through email or social media. Moreover, they can be made downloadable by other end users. For Tableau Public, no programming skills are needed. It can be accessed by anyone free of cost.
| Explore Tableau Sample Resumes! Download & Edit, Get Noticed by Top Employers! Download Now! |
Check out other Popular BI Tool Interview Questions
List Of Tableau Courses: Tableau Advanced Tableau Server Data Visualization and Dashboarding Fundamentals
 On-Job Support Service
Online Work Support for your on-job roles.

Our work-support plans provide precise options as per your project tasks. Whether you are a newbie or an experienced professional seeking assistance in completing project tasks, we are here with the following plans to meet your custom needs:
- Pay Per Hour
- Pay Per Week
- Monthly
| Name | Dates | |
|---|---|---|
| Tableau Training | Aug 01 to Aug 16 | View Details |
| Tableau Training | Aug 04 to Aug 19 | View Details |
| Tableau Training | Aug 08 to Aug 23 | View Details |
| Tableau Training | Aug 11 to Aug 26 | View Details |

Usha Sri Mendi is a Senior Content writer with more than three years of experience in writing for Mindmajix on various IT platforms such as Tableau, Linux, and Cloud Computing. She spends her precious time on researching various technologies, and startups. Reach out to her via LinkedIn and Twitter.


