
- Alteryx vs Tableau
- The Assistance of Tableau Rest API, You Can Now Automate Server Administration Tasks
- How to Blend Different Data sources in a Single Worksheet in Tableau
- Tableau Essentials
- Components Of Data Warehouse - Tableau
- How to Connect to Your Data and Generated Values of Tableau
- Create Visual Analytics Using Tableau Desktop
- Generate a new data with forecasts in an ad hoc analysis environment
- Future and Career Growth as a Tableau developer
- Import Custom Geocode Data / Map in Tableau
- Tableau Essentials: Chart Types
- How to Enhance Views with Filters, Sets, Groups and Hierarchies in Tableau?
- How to become a Tableau Developer -A Perfect Guide
- How to edit views in tableau server?
- Detailed Guide to Get Certified in Tableau
- Building Interactive Tableau Dashboards
- Introducing the Tableau Desktop Workspace - Tableau
- How to Join Database Tables with Tableau
- Introduction to Joins In Tableau
- Lumira Vs Tableau
- Top Reasons To Learn Tableau
- Authoring and editing reports via server in tableau
- Tableau 10.2.1 – New Capabilities and Corrected Issues in TABLEAU
- Tableau Advanced Interview Questions
- Introduction to Tableau API
- Why Tableau is Considered the Best BI Tool ?
- Growth of Tableau BI (Business Intelligence) Among Trending Technologies
- Tableau Calculated fields
- Table calculation in Tableau
- Tableau Careers and Salaries
- Tableau Case Statements
- Tableau Certification
- Create Pie charts, Scatter Plot, Area Fill charts & Circular View in Tableau
- Tableau Competitors
- Tableau Data Blending
- Tableau Desktop Tutorial
- Tableau Drivers
- Tableau Ecosystem Contains Of Different Components
- Tableau Interview Questions And Answers
- Tableau Latest Version
- What are the web mapping service pros and cons in tableau?
- Tableau Maps Tutorial
- Tableau Parameters
- Tableau Reporting
- Tableau Reporting Tool
- Tableau Reshaper Tool
- Tableau Server
- Tableau Server interview Questions
- Tableau Server Tutorial
- Tableau Show Me feature
- Tableau Tutorial
- Tableau Version History
- Tableau Visualization Course and its advantages in the current job market
- Tableau vs Cognos
- Tableau vs Domo
- Tableau vs Looker
- Tableau Vs Microstrategy
- Tableau vs Power BI
- Tableau Vs Spotfire
- Animating maps using the pages shelf or slider filters in Tableau
- Succession Planning analytics and Hr Dashboard in Tableau
- How to publish dashboards in tableau server?
- How Tableau geocodes your data?
- How to use Date Field in Tableau?
- How the Table Calculations Use Building Formulas in Tableau
- How to Add Flexibility to Calculations with Parameters in Tableau
- How to Build your first Advanced Dashboard in Tableau?
- How to Change the Scope of Trend Lines Tableau
- How to configure tableau server for the first time?
- How to consume information in tableau server?
- How to create a Standard Map View in Tableau?
- How to Create Calculated Values using Dialog Box in Tableau
- How to Customize Shapes, Colors, Fonts and Images in Tableau?
- How to deploy tableau server in high availability environments?
- How to deploy tableau server in multi-national entities?
- How to Determine your Hardware and Software needs in Tableau server?
- How to embed tableau reports securely on the web?
- How to improve appearance to convey meaning more precisely in tableau?
- Install Tableau Server and Reasons to Deploy it
- How to Install the Command Line Tools in Tableau?
- How to monitor activity on tableau server?
- How to organize reports for consumption in tableau server?
- How To Sort Data In Tableau
- Use Custom Background Images to Plot Spatial Data
- How to use maps to improve insight in Tableau?
- How to use performance recorder to improve performance in tableau server?
- Tableau Subscription and Report Scheduling
- How to use tabadmin for administrative task automation in tableau?
- How to Use Table Calculation Functions in Tableau
- Learning to leverage tabcmd in tableau
- Leverage existing security with trusted authentication in tableau server
- Managing tableau server in the cloud
- Planning for a successful tableau deployment at ACT
- How to Plot Your Own Locations on a Map in Tableau
- Tableau Self-Service Ad Hoc Analysis with Parameters
- Quality metrics in a hospital in tableau
- Trend Lines and Reference Lines In Tableau
- What Are Calculated Values and Table Calculations in Tableau?
- What are the advanced chart types in tableau?
- Tableau Dashboard Best Practices
- What are the common use cases for tabcmd in tableau?
- What are the licensing options for tableau server and tableau online?
- What are the Options for Securing Reports in Tableau?
- Sharing Connections, Data Models, Data Extracts in Tableau
- What are the tips, tricks and timesavers in tableau?
- What are the typical map errors and how to deal with them in tableau?
- What do tabcmd and tabadmin do in tableau’s command line tools?
- Tableau Aggregate Functions
- What is the right way to build a dashboard in tableau?
- What is the wrong way to build a dashboard in tableau?
- What kinds of tasks can be done with tabcmd commands
- When and how to deploy server on multiple physical machines in tableau?
- Tableau Extracts or Direct Connection - When to Use
- The Practicality of Using Tableau Mobile to Create Visualization
- Web Data Connector in Tableau Server
- Data Visualization and its influence on Businesses
- Tableau Charts Types
- How to Use Date Functions in Tableau
- Tableau Architecture and Ecosystem Components
- Looker vs Power BI
- How to Create Sets in Tableau
- Tableau Projects and Use Cases
- Tableau Integration with Salesforce
- Excel vs Tableau
- Tableau Server Administration
Tableau and Qlikview are two important BI tools available in the market for analyzing data. This article is a window to a complete overview of each of the tools, along with the basic differences based on three main categories of Business, Technology, and Visualization. Every organization wants the best BI tools, to handle the humongous data that they deal with each day. Tableau and Qlikview are the two giant BI tools that operate in the market successfully on Big Data. In this blog, we are going to discuss 'Tableau vs QlikView'.
| Want to be part of Tableau Real-Time Environment? Then Learn Tableau from Midmajix's "Tableau Certification Training" |
Tableau vs QlikView: What Is The Difference?
So let us get started with this Tableau vs QlikView article,
What Is Tableau?
Tableau is one of the most popular Business Intelligence tools, which helps in analyzing the data visually. It allows us to create and distribute the interactive dashboard, which displays the trends, variations, and density of the data in the form of charts and graphs. It can easily acquire data from files, relational and big data sources, and processes it. It also provides for data blending and real-time collaboration.
It holds high importance for businesses, academic researchers, and many government organizations, whose main focus is data collection and its analysis through visual analytics.
Tableau is regarded as a leading Business Intelligence and Analytics Platform in Gartner Magic Quadrant.
| Related Article: Tableau for Beginners |
What Is QlikView?
QlikView is one of the leading Business Discover platforms available. It is built with a number of features that differentiate it from traditional BI tools in the market. It is programmed to analyze data through different colors, which are used to indicate the relationship between different types of data. It also indicates the data that are not related.
QlikView applications manage data automatically, without any manual intervention. Its best features include, the in-memory data processing and data compression to 10% of the original size. These advantages make it the best in the field.
| Related Article: QlikView For Beginners |
Let us understand the advantages and disadvantages of using Tableau in Business Intelligence for Data Analytics.
Advantages Of Tableau vs QlikView
What Are The Advantages Of Using Tableau?
1. Visual Capabilities
The remarkable visual capabilities of Tableau are what it is known for. Tableau is developed to read and handle complex data formats and computations to produce required data blending and dashboarding to present you with extremely insightful data visualizations in the form of understandable graphs and charts. The researchers say that visuals are more impactful on memory than numbers and words. Consequently, Tableau seems to have made analyzing data easier, which otherwise would very confusing through the traditional spreadsheets.
| Related Article: Data Visualization Tools Open Source |
2. Easy creation of interactive visuals
Tableau Software offers the easy, "drag and drop" way of creating data visuals. Even a beginner can get hands-on software in very little time. The interface is built to handle endless variations with an additional capability of warning you for visuals against the best practices.
3. High Performance
Tableau's performance is great with large chunks of data. While the software is processing the big data, the dashboard manages to handle the load and there will be no performance drop seen with any of the user tools. This high performance with data visualization makes it one of the popular tools with a considerably large market.
4. Multiple data source connections
As a BI tool, Tableau is built with support for many common data sources used in the industry. Tableau can establish and manage the connections with HADOOP, SAP, and DB Technologies, increasing the radius of capabilities of the software tool as a whole. This improves the application performance of the software, enabling it to handle all sorts of data storage.
5. Support to other scripting languages
As a developer or a data scientist, it is not the best practice to completely rely on a tool for every process associated with data analytics. Sometimes, we feel the need to write our own scripts to perform some specific tasks on the data. Tableau, thus, supports Python and R. You can write scripts and run them on Tableau. Sometimes, this will perform the initial data cleansing task, hence reducing the load on Tableau. However, Python is not the natively supported language in Tableau.
6. Responsive UI
Tableau is responsive to devices. The reports and other UI automatically get resized according to the device size, it is opened on. Hence it is mobile, tablet, and laptop-friendly in nature.
7. Community and Forum Support
There are many Tableau enthusiasts, who are constantly contributing to the Tableau community growth. There are immense forums that support any Tableau beginner with the blockers he or she is facing. Overall, their community support is commendable.
What Are The Advantages of Using QlikView?
1. Dynamic Environment
Qlikview provides a dynamic BI user interface, where, with a single click, one can consolidate, visualize, and analyze data sources to unprecedented precision.
2. Data Interpretation and Analysis
The visually advanced and dynamic dashboard allows for a good data interpretation and analysis
3. Data Sharing
Different teams can collaborate and work on the crucial data, as real-time data sharing is enabled in Qlikview.
4. Independent Handling of Qlikview
Qlikview does not demand high-tech application knowledge to operate it. Both, application scripting and dashboard can be handled without much training and any external IT help. Any non-technical employee with little exposure to the application will be skilled enough to work on it.
5. Low on maintenance
The implementation of the application is hassle-free and is simple. It doesn't require dedicated maintenance even in the long run.
6. In-memory storage
Whenever any aggregation, the calculation is made on data, the operations proceed in-memory, while the data will be transferred from back-end to front-end. This saves a lot of storage memory, as the pre-calculated data will not be stored anywhere.
7. Data compression
The Qlikview considers only the useful bits of data. It removes all the junk bits and ensures that the data is redundancy-free. Hence, in the process, the data will be compressed to 10% of the original size, which improves the efficiency of data handling by the software.
8. QIX Engine
The QIX engine of the software is sensitive to click. It recognizes every click and responds to it through the process of changing color hues by highlighting the data related to the selected field. This helps in a better understanding of the data for the user.
9. Direct and Indirect searches
Qlikview allows for both direct and indirect searches. If you want to fetch some information about data, you can simply input anything related and get results. The result will be prompt in both direct and indirect causes.
10. Affordable Cost
Qlikview software is very affordable. The hardware required for the software is also cost-effective. There is also a free trial available in the software.

Disadvantages Of Tableau vs QlikView
What Are The Disadvantages of Using Tableau?
1. Lack of automatic Scheduling
Tableau doesn't offer the automatic refresh of the reports with the process of scheduling. There is no option to directly schedule in Tableau. Hence, always, there is a need for manual intervention when users have to update data in the back end.
2. No custom visual imports
Unlike other BI tools available in the market like PowerBI, where the visuals can be imported, Tableau lacks this feature. Whatever the custom visuals are needed, they have to be recreated within Tableau UI manually, which sometimes becomes double work and time-consuming.
3. Restrictions in custom formatting
The custom formatting and limited 16 columns scaling are difficult points for Tableau users. Also, there is no way to implement the formatting directly to multiple fields. This forces the user to apply the formatting manually, which is very time-consuming.
4. Static and single value parameters
Tableau's parameters are static and single-valued. Hence for any change in the data encountered, the users have to manually update the parameters. There is no way the parameters can be updated automatically.
5. Pricing
The scaling for larger organizations becomes an important limitation as the pricing of Tableau is very high for an average company. The smaller enterprises find it difficult to buy and install the product because of its expensive investment, compared to other available BI tools in the market.
6. Intensive staff training
The tool though is quite easy, to begin with, it is really difficult to understand and utilize all the facilities offered by the tools embedded in. One needs to undergo intensive staff training to start to meddle with the tool, in both cases of a developer and a user. This is not only time-consuming but also increases the cost of ownership.
7. Integration into existing infrastructure
Though Tableau claims that it is easy to integrate Tableau into your company's environment, it is practically not so easy. It is difficult to make Tableau integrate with the existing infrastructure to get a seamless business landscape, both technically and financially.
What Are The Disadvantages of Using QlikView?
1. Technical expertise
To create the application for the end-user, technical expertise is needed as the process is quite complex. For things that are at a base level, there is not much training needed. However, with the increase in complex computation, scriptwriting demands pre-knowledge of the software.
2. Poor Customer support
The customer support is deemed as poor and unsatisfactory, according to the customer reviews.
3. Embedding
If you want to embed the Qlikview software with some other software, things become messy, as this software is quite distinct in appearance.
4. Work on old functions
Qlikview has remained with some obsolete tools and interface designs. It lacks the new methods of drag-and-drop function and other designs that offer cutting-edge technology over the normal Qlikview functions.
| Related Article: Qlikview Interview Questions and Answers |
Architecture Of Tableau vs QlikView
Architecture of Tableau
The following diagram reads the architecture of Tableau.
The architecture of Tableau follows the famous, highly scalable, n-tier, client-server model. Here, the server serves web clients, desktop-installed clients, and mobile clients. Tableau Desktop is the authorized edition, which is used to create multiple views on the server.
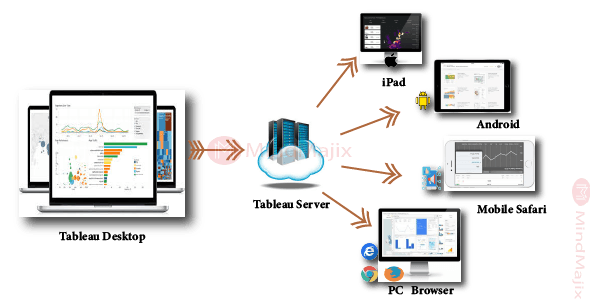
Tableau server is the analytics platform, which is used as an enterprise-level, business analytic tool, used to level up thousands of clients.
Architecture of QlikView
QlikView architecture is made of the front-end and the back-end. The front-end visualizes the processed data while the back-end provides the security and publishing tool for the user documents.
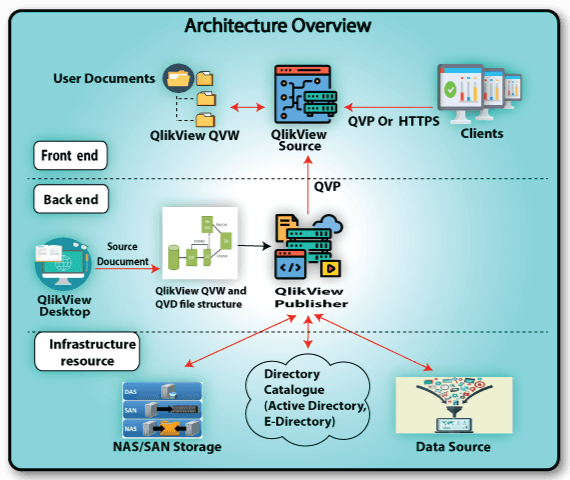
The frontend is made, mainly of the QlikView server, which is used by the users to view the already generated BI reports.
The back-end mainly consists of the QlikView Desktop and QlikView Publisher. The drag and drop mechanisms can be conducted on the Desktop, while the distribution service is performed by the Publisher.
Difference Between The Tableau And QlikView
There are four different categories, based on which the Tableau and QlikView are differentiated. They are
- General features
- Business Features
- Visualization features
- Technical features
QlikView vs Tableau: General Features
| Feature | Tableau | Qlikview |
| Deployment Process |
|
|
| Ease of Use |
|
|
| Ease of Learning | Simple drag-and-drop features enable you to learn things quickly. | You can learn to work with Qlikview easily, being guided by community support. |
| Cost |
|
|
| Connectivity with other tools |
|
|
| Mobility | It is available on all the devices | It is available on both web-based and mobile-based clients. |
| Maintainability | Easy to maintain | Easy to maintain |
| Security |
|
It provides security for the documents, scripts, and sections through user authentication. Document access through the Qlikview desktop is managed by Windows NTFS File Security. The user access to web-based Qlikview Enterprise Management Console is limited to only Windows users who are a part of the particular windows group.
|
| Related Article: Tableau Interview Questions And Answers |
QlikView vs Tableau: Business Criteria
| Feature | Tableau | Qlikview |
| Scalability | Scalability is good here. It can handle large amounts of data without any hassles | It can handle huge amounts of data. However, RAM has to be scaled in order to scale the system to the new requirement. |
| SaaS Platform |
|
|
| MindShare | Integrated into Mindshare using Tableau public | Not Integrated into Mindshare |
| Implementation Time | Fast | Slow |
| Server License |
|
|
| Big data Support |
|
|
| Viability |
|
|
| Overall cost | The billing is dependent on customer needs, hence pricing is not publicly available. |
|
| Partner Network | Below average network. | Large partner network, having 1000+ partners. |
QlikView vs Tableau: Visualization Criteria
| Feature | Tableau | Qlikview |
| Dashboard Support |
|
|
| Web Clients | Supported | Supported |
| Mobile Clients | Supported on phone, tablets, and iPad. | Supported on iPad |
| UI Interactivity | Interaction is good but has no MDI support. | Interaction is good and has MDI support. |
| Visual Controls | There are good visual controls like zoom. | Visual controls are good with options to update the visualization, you need. |
| Analyst Desktop | Tableau Pro is the best fit. | Qlikview Desktop fits well. |
| Data Interactivity | Good data interactivity | Better data interactivity |
| Visual drill down | Visual drill down is good | Visual drill down is better |
| Offline Viewer | Available for the free reader | Available for the personal edition |
QlikView Vs Tableau: Technical Criteria
| Feature | Tableau | Qlikview |
| Data mining | Is supported to a limited level | Not supported |
| Development | Development is better on Tableau Pro | Development is better on Qlikview Developer |
| Data integration | Data Integration is best with a wide variety of data sources being supported. | Data integration is good. |
| Integration with GIS | Best suited for integration with GIS | Performance for integration with GIS is average |
| Modeling | Below average in modeling | Below average in modeling |
| Analytics | Below average in analytics | Below average in analytics |
| Xvelocity support | Supported | Not supported |
| PowerPivot Support | Supported well | Not supported |
| API | Not good | Limited |
Conclusion
Tableau and QlikView are very powerful BI tools. To decide on the best one for your company, you need to do a detailed analysis of comparing your requirements against the features of each of these applications. Each one of them has their own set of strengths and perform better for some solution criteria while performing average in a few others. Weighing each requirement of your company by importance and opting for the one that performs best in the given conditions, will be the ideal solution.
If data visualizations are your focus, then Tableau stands out of all. It is by large, the best performance BI tool for visualization.
Qlikview finds prominence if you are looking for high adaptability and deep data analytics. It is also a natural choice if you are looking for a moderately priced tool.
So, ensure to have a detailed report, before banking on one!
 On-Job Support Service
Online Work Support for your on-job roles.

Our work-support plans provide precise options as per your project tasks. Whether you are a newbie or an experienced professional seeking assistance in completing project tasks, we are here with the following plans to meet your custom needs:
- Pay Per Hour
- Pay Per Week
- Monthly
| Name | Dates | |
|---|---|---|
| Tableau Training | Jul 25 to Aug 09 | View Details |
| Tableau Training | Jul 28 to Aug 12 | View Details |
| Tableau Training | Aug 01 to Aug 16 | View Details |
| Tableau Training | Aug 04 to Aug 19 | View Details |

As a Senior Writer for Mindmajix, Saikumar has a great understanding of today’s data-driven environment, which includes key aspects such as Business Intelligence and data management. He manages the task of creating great content in the areas of Programming, Microsoft Power BI, Tableau, Oracle BI, Cognos, and Alteryx. Connect with him on LinkedIn and Twitter.


