
- The Assistance of Tableau Rest API, You Can Now Automate Server Administration Tasks
- How to Blend Different Data sources in a Single Worksheet in Tableau
- Tableau Essentials
- Components Of Data Warehouse - Tableau
- How to Connect to Your Data and Generated Values of Tableau
- Create Visual Analytics Using Tableau Desktop
- Generate a new data with forecasts in an ad hoc analysis environment
- Future and Career Growth as a Tableau developer
- Import Custom Geocode Data / Map in Tableau
- Tableau Essentials: Chart Types
- How to Enhance Views with Filters, Sets, Groups and Hierarchies in Tableau?
- How to become a Tableau Developer -A Perfect Guide
- How to edit views in tableau server?
- Detailed Guide to Get Certified in Tableau
- Building Interactive Tableau Dashboards
- Introducing the Tableau Desktop Workspace - Tableau
- How to Join Database Tables with Tableau
- Introduction to Joins In Tableau
- Lumira Vs Tableau
- Top Reasons To Learn Tableau
- Authoring and editing reports via server in tableau
- Tableau 10.2.1 – New Capabilities and Corrected Issues in TABLEAU
- Tableau Advanced Interview Questions
- Introduction to Tableau API
- Why Tableau is Considered the Best BI Tool ?
- Growth of Tableau BI (Business Intelligence) Among Trending Technologies
- Tableau Calculated fields
- Table calculation in Tableau
- Tableau Careers and Salaries
- Tableau Case Statements
- Tableau Certification
- Create Pie charts, Scatter Plot, Area Fill charts & Circular View in Tableau
- Tableau Competitors
- Tableau Data Blending
- Tableau Desktop Tutorial
- Tableau Drivers
- Tableau Ecosystem Contains Of Different Components
- Tableau Interview Questions And Answers
- Tableau Latest Version
- What are the web mapping service pros and cons in tableau?
- Tableau Maps Tutorial
- Tableau Parameters
- Tableau Reporting
- Tableau Reporting Tool
- Tableau Reshaper Tool
- Tableau Server
- Tableau Server interview Questions
- Tableau Server Tutorial
- Tableau Show Me feature
- Tableau Tutorial
- Tableau Version History
- Tableau Visualization Course and its advantages in the current job market
- Tableau vs Cognos
- Tableau vs Domo
- Tableau vs Looker
- Tableau Vs Microstrategy
- Tableau vs Power BI
- Tableau vs QlikView
- Tableau Vs Spotfire
- Animating maps using the pages shelf or slider filters in Tableau
- Succession Planning analytics and Hr Dashboard in Tableau
- How to publish dashboards in tableau server?
- How Tableau geocodes your data?
- How to use Date Field in Tableau?
- How the Table Calculations Use Building Formulas in Tableau
- How to Add Flexibility to Calculations with Parameters in Tableau
- How to Build your first Advanced Dashboard in Tableau?
- How to Change the Scope of Trend Lines Tableau
- How to configure tableau server for the first time?
- How to consume information in tableau server?
- How to create a Standard Map View in Tableau?
- How to Create Calculated Values using Dialog Box in Tableau
- How to Customize Shapes, Colors, Fonts and Images in Tableau?
- How to deploy tableau server in high availability environments?
- How to deploy tableau server in multi-national entities?
- How to Determine your Hardware and Software needs in Tableau server?
- How to embed tableau reports securely on the web?
- How to improve appearance to convey meaning more precisely in tableau?
- Install Tableau Server and Reasons to Deploy it
- How to Install the Command Line Tools in Tableau?
- How to monitor activity on tableau server?
- How to organize reports for consumption in tableau server?
- How To Sort Data In Tableau
- Use Custom Background Images to Plot Spatial Data
- How to use maps to improve insight in Tableau?
- How to use performance recorder to improve performance in tableau server?
- Tableau Subscription and Report Scheduling
- How to use tabadmin for administrative task automation in tableau?
- How to Use Table Calculation Functions in Tableau
- Learning to leverage tabcmd in tableau
- Leverage existing security with trusted authentication in tableau server
- Managing tableau server in the cloud
- Planning for a successful tableau deployment at ACT
- How to Plot Your Own Locations on a Map in Tableau
- Tableau Self-Service Ad Hoc Analysis with Parameters
- Quality metrics in a hospital in tableau
- Trend Lines and Reference Lines In Tableau
- What Are Calculated Values and Table Calculations in Tableau?
- What are the advanced chart types in tableau?
- Tableau Dashboard Best Practices
- What are the common use cases for tabcmd in tableau?
- What are the licensing options for tableau server and tableau online?
- What are the Options for Securing Reports in Tableau?
- Sharing Connections, Data Models, Data Extracts in Tableau
- What are the tips, tricks and timesavers in tableau?
- What are the typical map errors and how to deal with them in tableau?
- What do tabcmd and tabadmin do in tableau’s command line tools?
- Tableau Aggregate Functions
- What is the right way to build a dashboard in tableau?
- What is the wrong way to build a dashboard in tableau?
- What kinds of tasks can be done with tabcmd commands
- When and how to deploy server on multiple physical machines in tableau?
- Tableau Extracts or Direct Connection - When to Use
- The Practicality of Using Tableau Mobile to Create Visualization
- Web Data Connector in Tableau Server
- Data Visualization and its influence on Businesses
- Tableau Charts Types
- How to Use Date Functions in Tableau
- Tableau Architecture and Ecosystem Components
- Looker vs Power BI
- How to Create Sets in Tableau
- Tableau Projects and Use Cases
- Tableau Integration with Salesforce
- Excel vs Tableau
- Tableau Server Administration
Data is the most important element for any organization to scale its performance and make influencing decisions for organizational growth. However, managing data becomes one of the most complex things in mid-level organizations. For this, they have to take help from different tools along with specialized people to manage and analyze data for improvements. Keeping this in mind, there are many companies around the globe that have developed ETL (Extract, Transform, Load) platforms to make this process more convenient. Here, we are elaborating on two of the leading ETL platforms that can simplify the management and analysis of company data. This article will help you choose the best that suits your organizational needs by comparing all the features between Alteryx vs Tableau.
| If you want to become a Certified Alteryx Specialist, then visit Mindmajix - A Global online training platform: “AlterYX Training”. This course will help you to achieve excellence in this domain. |
Alteryx vs Tableau: Choosing the right data analytics tool for your business
What is Alteryx?
Alteryx can be term as a data blending tool that helps in collecting data from different sections of a company and showcase them in the best way possible (i.e. charts, graphs, etc.). With the help of Alteryx, you will be able to analyze the data of the entire organization altogether to get the entire overview of progress.
Alteryx Features
Alteryx comes with the following features, which can help you in getting actionable business insights. Kindly take a look at the following points given below:
- Stanford University patented protection.
- Toggle View
- Drag and Drop actions
- Native data connector list
- Highlight and Filter data optionality
- Dashboard sharing
- Dashboards embedding
- Data notifications
- Mobile-ready dashboards
- Tableau Reader for viewing data
- Create “no-code” data queries
- Dashboard commenting
- Import data of all sizes and ranges
- Translate queries into visuals
- Interactive dashboards
- Metadata management
- Convert string insights into a guided story
- Every level of security permission
- Automatic updates
- Server API
- Integration with Tableau Public for data sharing
What is Tableau?
Another panacea to harness the power of your company data is Tableau, which can sweep out a load of managing bulk data of your business. Tableau can help you in collecting the entire data of your organization in a single place so that you can analyze it more deeply and can obtain actionable business insights.
| Related Article: Tableau Tutorial for Beginners |
Tableau Features
Tableau packs the following features, to make data management easier than ever. Take a look at the list given below:
- Predictive Analysis
- Data Blending
- Encrypted Storage
- Spatial Analysis
- Export-Package
- Import-Package
- Mapping
- Interactive Visualizations
- Sharing
- Encryption
- Governance and Security
- Drag and Drop Workflow

Why use Alteryx with Tableau?
Tableau is an undeniably powerful software to collect and analyze data from different sources. Its easy-to-understand visualizations answer your every complex question and help you in making the right moves. But, with the evolution of technology, new data types have also emerged (for eg: social media and big data). Gathering and analyzing the array of these newly emerged data to make critical business decisions is not a piece of cake. It will require specialists and extended-IT staff to get this task done.
This is where Alteryx came in, as you will not have to wait even a bit to access and analyze the datasheets you need with the help of it. Alteryx allows you to integrate every data source from any location virtually. It then combines the data sources with third-party location-based, spatial, demographic data and arranges them into a single workflow. It provides you with the best set of data available to analyze it with the help of Tableau. And you don't need data scientists or specialists for this.
Alteryx vs Tableau: Difference between Alteryx and Tableau
Looking at the above-given information, the working of this software looks similar to each other. However, they are quite different if the overall structure of them is concerned. Clearing out all the confusion, here we are showcasing how Alteryx and Tableau are different from each other. Kindly take a look at this below-given table to get all the main differences between Alteryx and Tableau:
|
Difference
|
Alteryx
|
Tableau
|
| Pricing Type | Starts from $1950 | Starts from $35 |
| Product Info | Alteryx is basically a smart data analytics software that blends modern data (i.e. social media) collected from different sources and showcases it in the best way possible. | Tableau is an online application that collects data from different sources and offers great data analytics to help businesses make better decisions. |
| OS Compatibility |
It is compatible with the following operating systems:
|
It is compatible with the following operating systems:
|
| Customer Support |
It offers the following customer support categories:
|
It offers the following customer support categories:
|
How to use Tableau?
To use Tableau, you will first have to make an account and subscribe it to move further. After getting all the formalities done, you will then be ready to move further. Open Tableau Desktop, you will see a starting page, then simply follow the below-given steps to dodge every hurdle in your way.
Connect your data
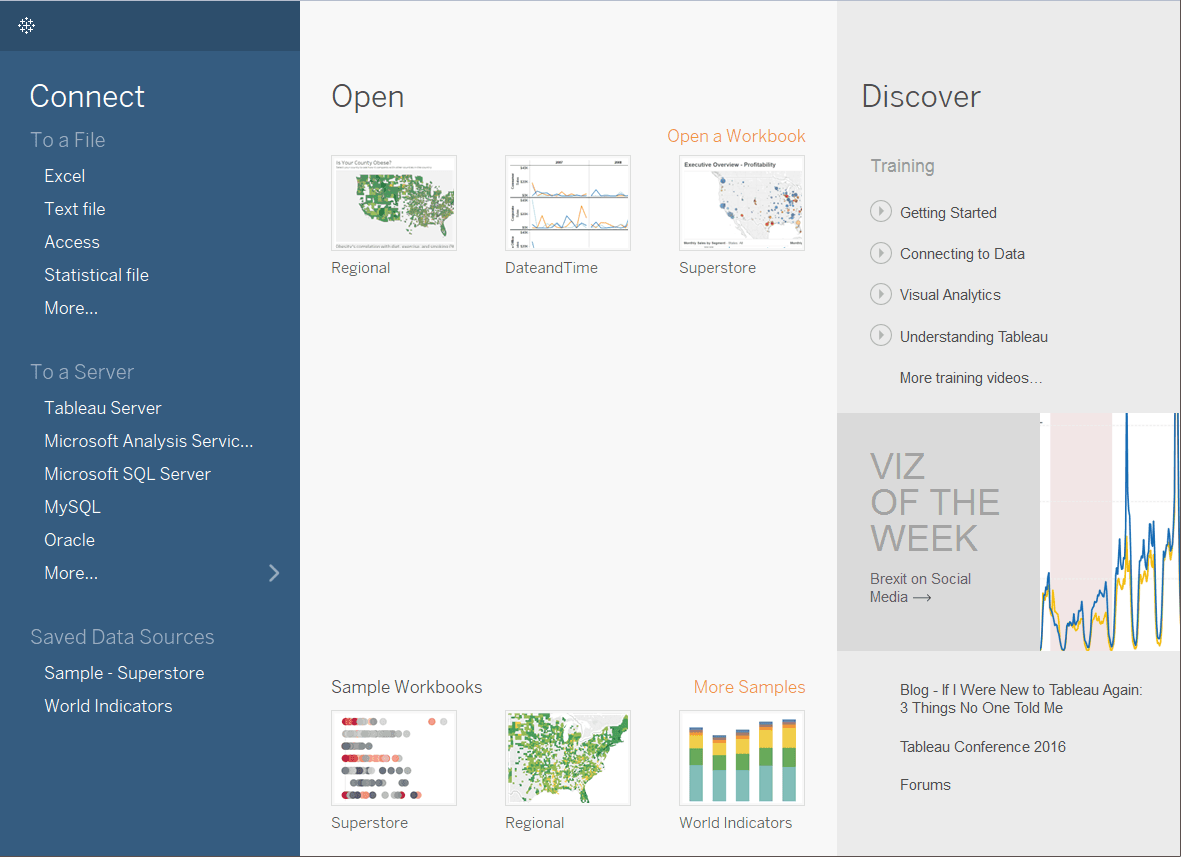
After getting on the start page, the first thing you will have to do is connect your data. For this, you will need to click on the Tableau icon present in the upper left-hand corner of the page. It will showcase you a sidebar where you will get different data types present at different places to connect.
Drag and Drop to get the first look
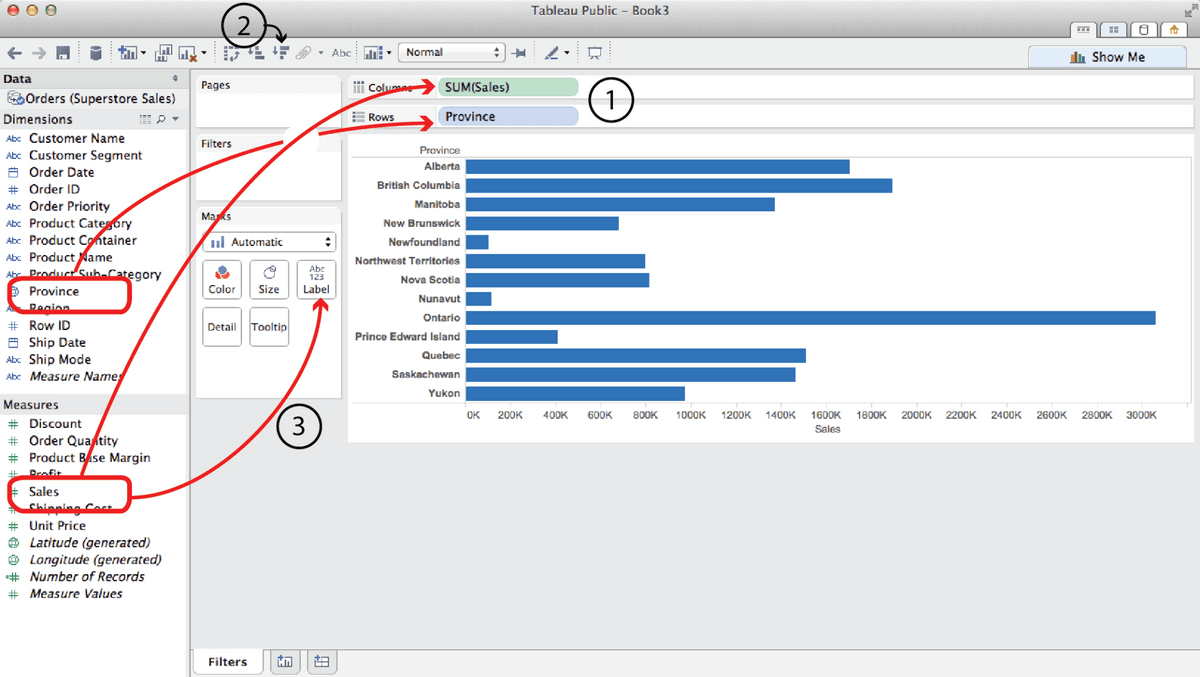
While creating an analytic chart of overall sales data, you can simply drag and drop different elements to make your work done with ease.
Focus the results

You can have more focus and get more precise results by using Tableau. It gives you the facility to add different filters and use different colors to showcase your findings of different data types in an analytic chart.
Explore the data geographically
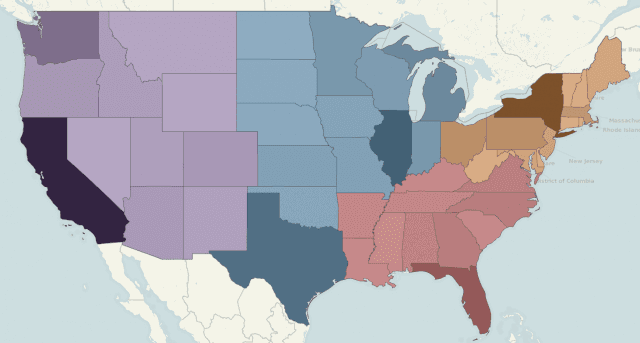
You can simply build a map view to trace your data geographically. By this, you can simply compare the sales and other things countryside, and can take many revolutionary decisions by analyzing it.
Drill down into the details of data
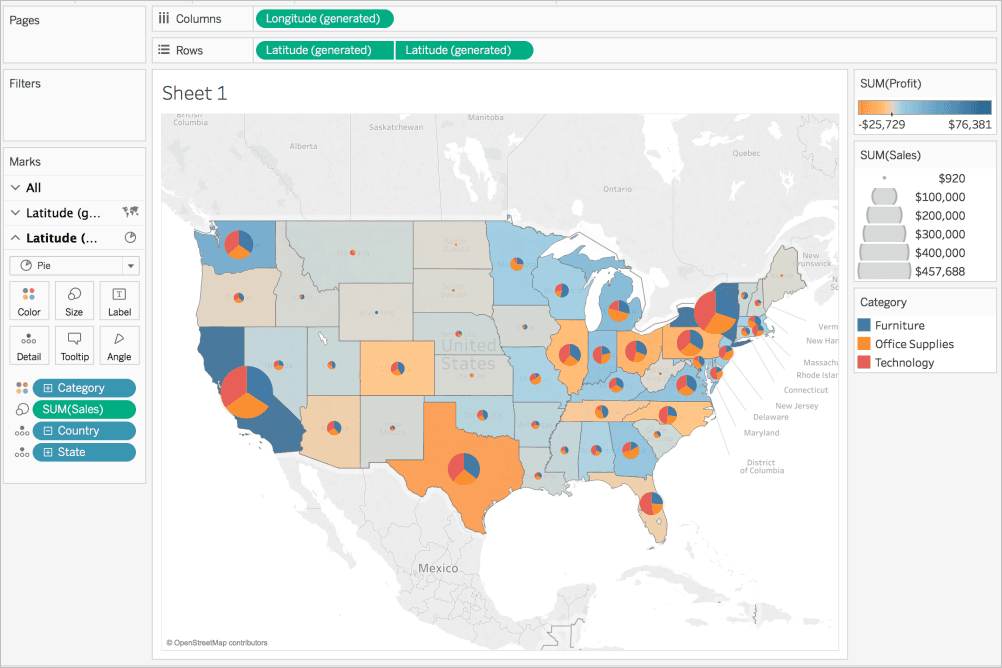
After getting a countrywide overview, you can also go deeper into the country data that found to be negative in the profit rate. Go deeper and see the analytic chart of that specific region itself to get some actionable insights.
Build a sparkling dashboard to present your insights
After creating different analytic sheets for different areas, you will now need to showcase all of them together to take out negative points. Tableau offers you the ability to create your desirable dashboards which can help you in representing all the analytic charts at once.
Make a representable story
Before consulting your plans with your team and indulging them in a PowerPoint representation, you can choose a better and wiser path to follow. Tableau enables you to make stories for better understanding. You can easily create your own story for your plan, product, or services, which your teams will understand better.
Share your conclusions
After getting all the work done, you can also share your results and findings with your teams sitting at different locations with the help of Tableau Server or Tableau Online.
Learn from Library
| Related Article: Frequently Asked Tableau Interview Questions & Answers |
Next in this Alteryx vs Tableau Article, we will see how to use Alteryx,
How to use Alteryx?
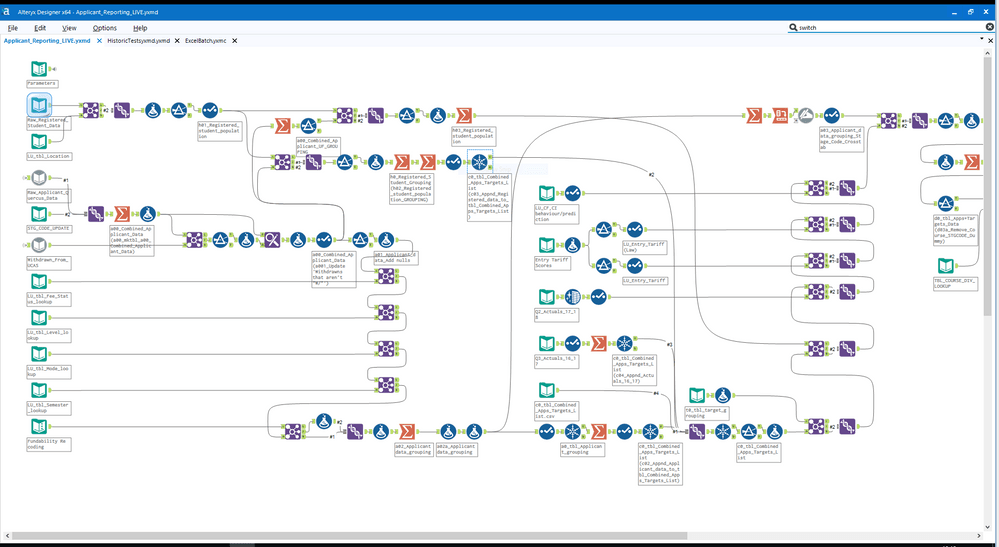
After getting registered with Alteryx, you will get to see the start screen of this analytic tool. Its user environment can also be termed as GUI (i.e. Graphical User Interface) and is blessed with 6 components that simply can be seen in the following points given below:
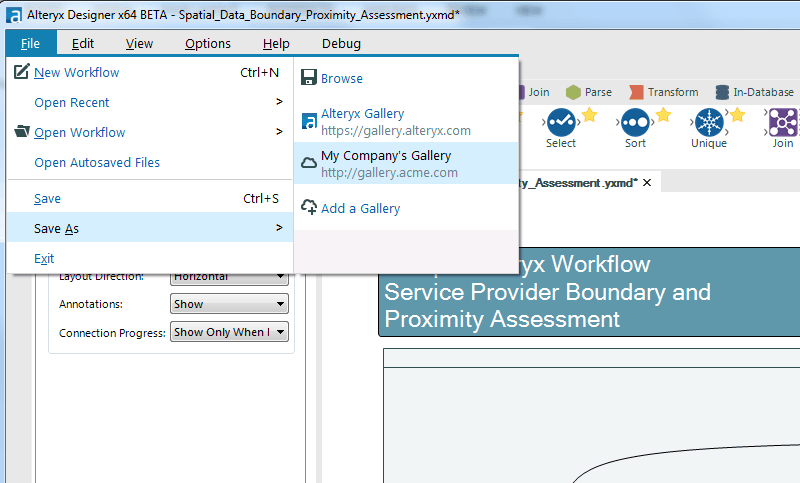
Inspired by most of the windows based applications, file navigation is executable from the windows button. Common tools are arranged in this section just like any other web application.
Tool Palette
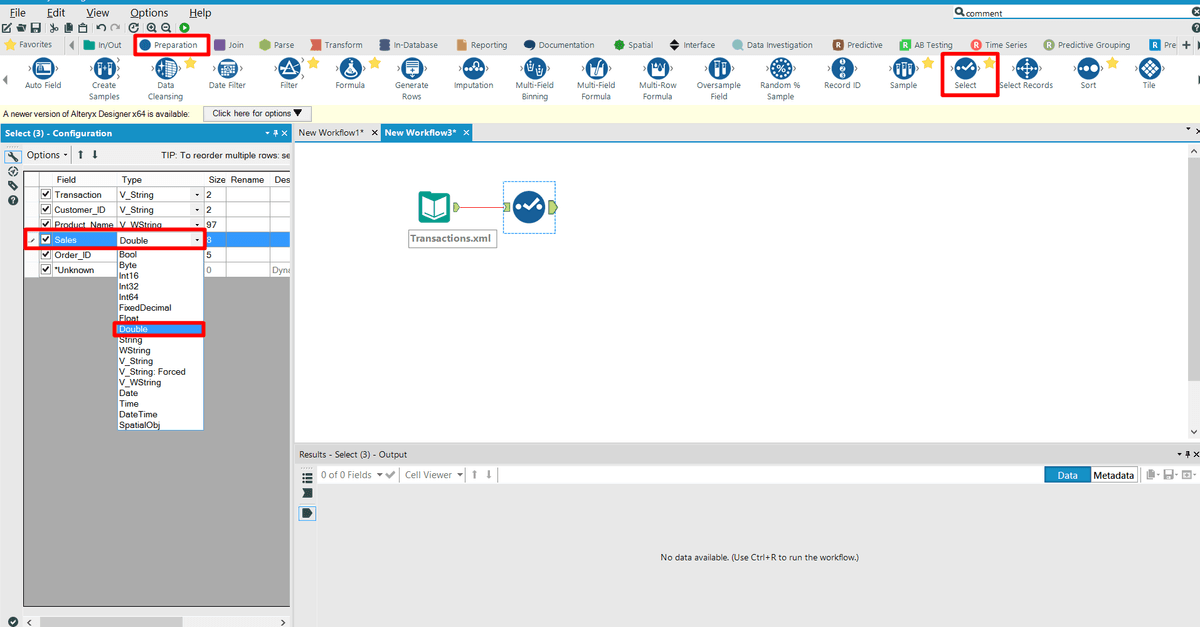
The Tool Palette in Alteryx consists of all the tool names along with their images, that can be used for any operation. To use any tools in Alteryx, the user will just need to pull it out in the canvas to make a workflow.
Workflow Window
The area where workflow is built or made up can be termed as a Workflow Window. This arena can also be termed as a Workflow canvas.
Properties Window
The Properties Window provides different options, that are relevant to configuring the specifications for each and every tool bought into the workflow. Moreover, it also works the same for the entire workflow itself when no tool is selected. It automatically adapts the sections within the workflow.
| Related Article: Alteryx Interview Questions |
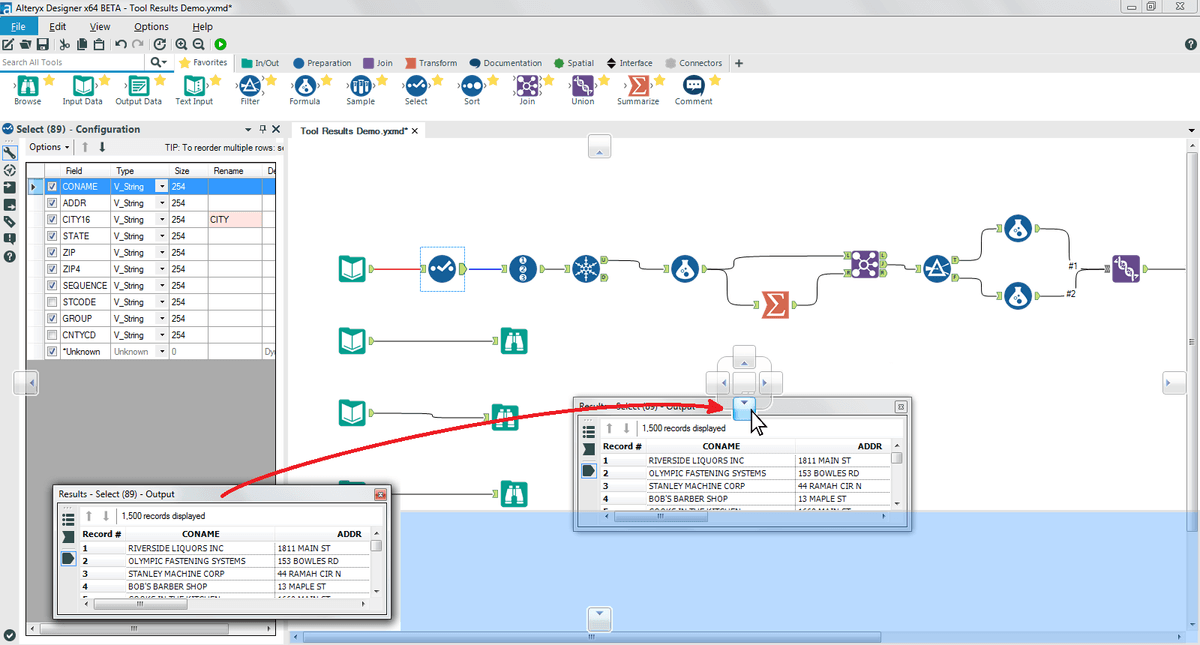
Overview Window
The Overview window in Alteryx offers a scaled-down image representation of the entire workflow, which can be used for getting more deeper into the workflow.
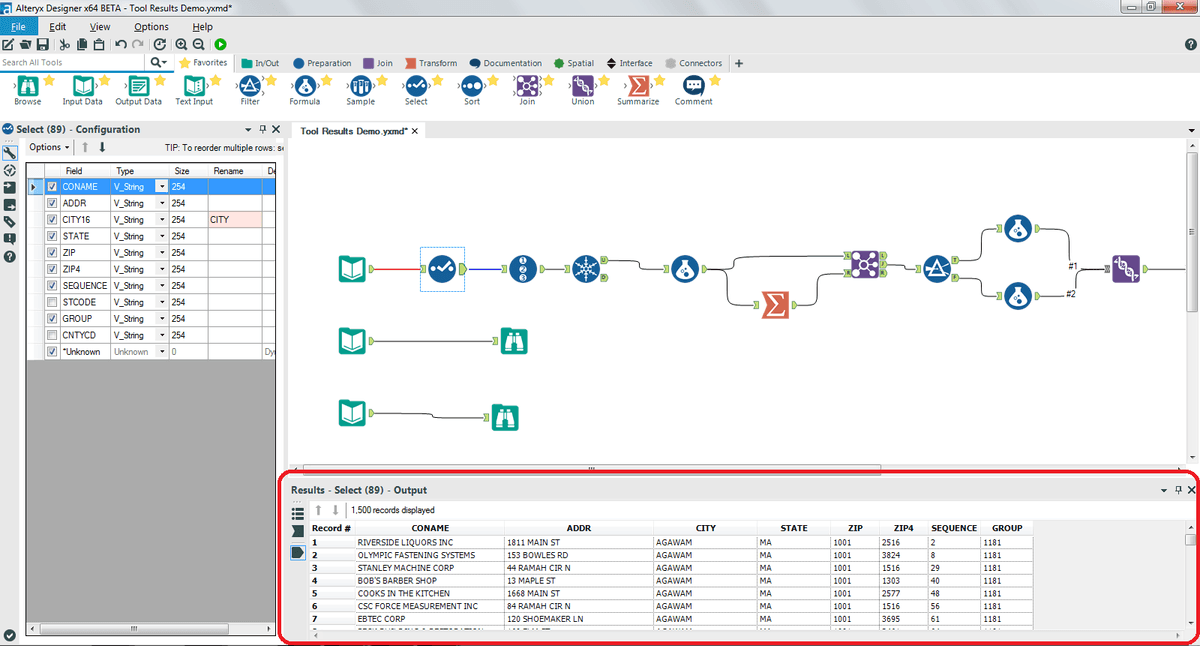
Output Window
As its name represents, it shows the status logs to the workflow with the help of reporting messages from each and every tool. It gets visible on special occasions such as at the starting of a workflow, at the end of the workflow, while having an error or warning, etc.
Apart from this, after getting registered with the Alteryx, the File menu (File > Open Sample > Open Tutorials) will showcase to you 8 step-by-step illustrated examples. These examples will teach you how to filter, how to build a workflow, how to author an app or a Marco, and how to blend and analyze data.
| Looking for Best Alteryx Online Course Platfrom in Bangalore? To Enroll a Free Demo Click Here. |
How to prepare address files in Alteryx for use in Tableau?
Tableau has fair geocoding and mapping functionalities that can help you in managing your data, still, these are not up to the mark. This is where Alteryx comes in, as it comes with a ravishing address tool to make your work easier than ever. We can understand this more deeply with the help of an example. If we process a set of data with addresses in Tableau, it will not recognize addresses as a geographical feature. You will need to use the longitude and latitude of a specific point to make Tableau recognize it, which is simply a very time-consuming and hectic process.
Now, Alteryx, as we have already mentioned above packs a specialized suite of address tools including Street Geocoder and CASS. This suit will help you in transforming a longitude and latitude format automatically without any hustle. By using these tools, you will be able to make address files in a .tde format which is easily accessible in Tableau. Saving files in .tde format (i.e. Tableau Data Extract) will simply enhance its performance in Tableau. By using this technique, you can easily create executable address files in Alteryx to use in Tableau.
Alteryx and Tableau Integration
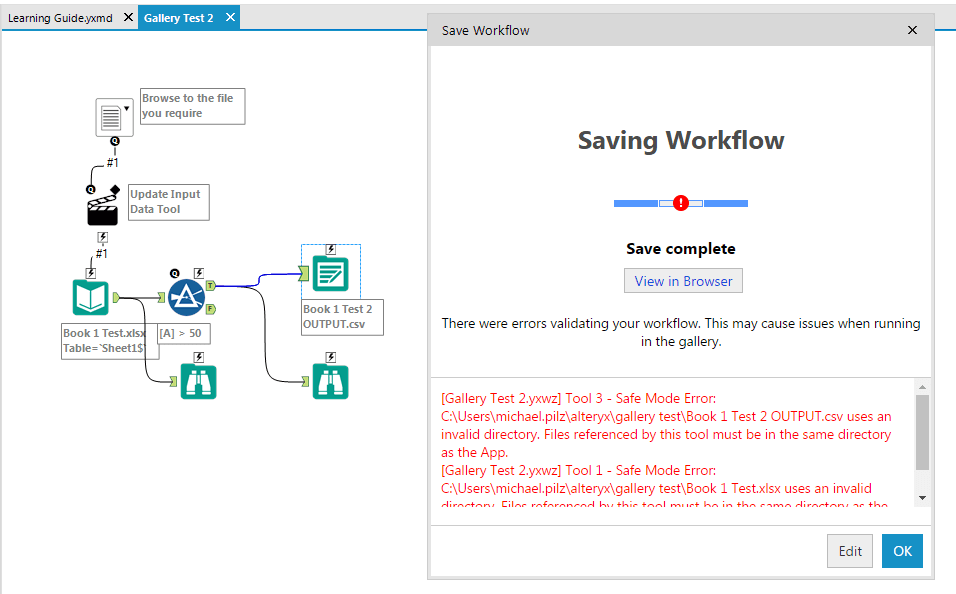
After making .tde (Tableau Data Extract) files in the Alteryx, the next question that arises is how do we integrate Alteryx and Tableau? The answer is, you will have to use Alteryx’s “Publish to Tableau Server” tool to publish the data directly to the Tableau Server. For this, you can simply follow the steps given below:
- Firstly, you’ll need to download the “Publish to Tableau Server” tool from the official website.
- After downloading it, you need to install it, so that it may appear in the tool palette of Alteryx.
- Open Alteryx, make a new workflow.
- Drag the Input data .tde file you want to share.
- Search for the “Publish to Tableau Server” tool into the search bar and drag it to the workflow canvas.
- Make a connection between the “Input Data” and “Publish to Tableau Server” tools.
- Select the “Publish to Tableau Server” tool and enter all the essential information (i.e. Server name, site name, the username of Tableau server, password of Tableau server, file name, project name).
Moreover, you will also need to change the Alteryx output properties to “Overwrite Existing Extract File”, as it is not a default option. By this, you will get updated data every time in Tableau without any hustle.
Conclusion
Tableau and Alteryx both are known as the leading platforms in the field of data analytics. Tableau is a great tool to collect and visualize data to make great business decisions by analyzing them. However, with the reference of time, different data types have emerged that are important but are complex to study and analyze. Alteryx plays a vital role in blending modern data types so that you can use it in Tableau. Alteryx vs Tableau platforms have their own importance, but using them together will undeniably create a masterpiece, or we can say an art of managing complex data.
 On-Job Support Service
Online Work Support for your on-job roles.

Our work-support plans provide precise options as per your project tasks. Whether you are a newbie or an experienced professional seeking assistance in completing project tasks, we are here with the following plans to meet your custom needs:
- Pay Per Hour
- Pay Per Week
- Monthly
| Name | Dates | |
|---|---|---|
| AlterYX Training | Aug 04 to Aug 19 | View Details |
| AlterYX Training | Aug 08 to Aug 23 | View Details |
| AlterYX Training | Aug 11 to Aug 26 | View Details |
| AlterYX Training | Aug 15 to Aug 30 | View Details |

As a Senior Writer for Mindmajix, Saikumar has a great understanding of today’s data-driven environment, which includes key aspects such as Business Intelligence and data management. He manages the task of creating great content in the areas of Programming, Microsoft Power BI, Tableau, Oracle BI, Cognos, and Alteryx. Connect with him on LinkedIn and Twitter.


