
- Alteryx vs Tableau
- The Assistance of Tableau Rest API, You Can Now Automate Server Administration Tasks
- How to Blend Different Data sources in a Single Worksheet in Tableau
- Tableau Essentials
- Components Of Data Warehouse - Tableau
- How to Connect to Your Data and Generated Values of Tableau
- Create Visual Analytics Using Tableau Desktop
- Generate a new data with forecasts in an ad hoc analysis environment
- Future and Career Growth as a Tableau developer
- Import Custom Geocode Data / Map in Tableau
- Tableau Essentials: Chart Types
- How to Enhance Views with Filters, Sets, Groups and Hierarchies in Tableau?
- How to become a Tableau Developer -A Perfect Guide
- How to edit views in tableau server?
- Detailed Guide to Get Certified in Tableau
- Building Interactive Tableau Dashboards
- Introducing the Tableau Desktop Workspace - Tableau
- How to Join Database Tables with Tableau
- Introduction to Joins In Tableau
- Lumira Vs Tableau
- Top Reasons To Learn Tableau
- Authoring and editing reports via server in tableau
- Tableau 10.2.1 – New Capabilities and Corrected Issues in TABLEAU
- Tableau Advanced Interview Questions
- Introduction to Tableau API
- Why Tableau is Considered the Best BI Tool ?
- Growth of Tableau BI (Business Intelligence) Among Trending Technologies
- Tableau Calculated fields
- Table calculation in Tableau
- Tableau Careers and Salaries
- Tableau Case Statements
- Tableau Certification
- Create Pie charts, Scatter Plot, Area Fill charts & Circular View in Tableau
- Tableau Competitors
- Tableau Data Blending
- Tableau Desktop Tutorial
- Tableau Drivers
- Tableau Ecosystem Contains Of Different Components
- Tableau Interview Questions And Answers
- Tableau Latest Version
- What are the web mapping service pros and cons in tableau?
- Tableau Maps Tutorial
- Tableau Parameters
- Tableau Reporting
- Tableau Reporting Tool
- Tableau Reshaper Tool
- Tableau Server
- Tableau Server interview Questions
- Tableau Server Tutorial
- Tableau Show Me feature
- Tableau Tutorial
- Tableau Version History
- Tableau Visualization Course and its advantages in the current job market
- Tableau vs Cognos
- Tableau vs Domo
- Tableau vs Looker
- Tableau Vs Microstrategy
- Tableau vs Power BI
- Tableau vs QlikView
- Tableau Vs Spotfire
- Animating maps using the pages shelf or slider filters in Tableau
- Succession Planning analytics and Hr Dashboard in Tableau
- How to publish dashboards in tableau server?
- How Tableau geocodes your data?
- How to use Date Field in Tableau?
- How the Table Calculations Use Building Formulas in Tableau
- How to Add Flexibility to Calculations with Parameters in Tableau
- How to Change the Scope of Trend Lines Tableau
- How to configure tableau server for the first time?
- How to consume information in tableau server?
- How to create a Standard Map View in Tableau?
- How to Create Calculated Values using Dialog Box in Tableau
- How to Customize Shapes, Colors, Fonts and Images in Tableau?
- How to deploy tableau server in high availability environments?
- How to deploy tableau server in multi-national entities?
- How to Determine your Hardware and Software needs in Tableau server?
- How to embed tableau reports securely on the web?
- How to improve appearance to convey meaning more precisely in tableau?
- Install Tableau Server and Reasons to Deploy it
- How to Install the Command Line Tools in Tableau?
- How to monitor activity on tableau server?
- How to organize reports for consumption in tableau server?
- How To Sort Data In Tableau
- Use Custom Background Images to Plot Spatial Data
- How to use maps to improve insight in Tableau?
- How to use performance recorder to improve performance in tableau server?
- Tableau Subscription and Report Scheduling
- How to use tabadmin for administrative task automation in tableau?
- How to Use Table Calculation Functions in Tableau
- Learning to leverage tabcmd in tableau
- Leverage existing security with trusted authentication in tableau server
- Managing tableau server in the cloud
- Planning for a successful tableau deployment at ACT
- How to Plot Your Own Locations on a Map in Tableau
- Tableau Self-Service Ad Hoc Analysis with Parameters
- Quality metrics in a hospital in tableau
- Trend Lines and Reference Lines In Tableau
- What Are Calculated Values and Table Calculations in Tableau?
- What are the advanced chart types in tableau?
- Tableau Dashboard Best Practices
- What are the common use cases for tabcmd in tableau?
- What are the licensing options for tableau server and tableau online?
- What are the Options for Securing Reports in Tableau?
- Sharing Connections, Data Models, Data Extracts in Tableau
- What are the tips, tricks and timesavers in tableau?
- What are the typical map errors and how to deal with them in tableau?
- What do tabcmd and tabadmin do in tableau’s command line tools?
- Tableau Aggregate Functions
- What is the right way to build a dashboard in tableau?
- What is the wrong way to build a dashboard in tableau?
- What kinds of tasks can be done with tabcmd commands
- When and how to deploy server on multiple physical machines in tableau?
- Tableau Extracts or Direct Connection - When to Use
- The Practicality of Using Tableau Mobile to Create Visualization
- Web Data Connector in Tableau Server
- Data Visualization and its influence on Businesses
- Tableau Charts Types
- How to Use Date Functions in Tableau
- Tableau Architecture and Ecosystem Components
- Looker vs Power BI
- How to Create Sets in Tableau
- Tableau Projects and Use Cases
- Tableau Integration with Salesforce
- Excel vs Tableau
- Tableau Server Administration
Many technologies, apps, and websites rely mainly on data that has been produced by various mediums. Data is a collection of facts or figures, that can be processed using various technologies. The confluence of technological advancements and surging demand for smart devices in recent years have made data more popular. We have various tools that help us in processing and visualizing the data to get hidden insights out of it.
Advance Tableau Dashboard - Table of Contents
| Want to Learn Advanced Chart Techniques to Create Innovative Analysis & Dashboards? then enroll in "Tableau Training". This course will help you to achieve excellence in this domain. |
What is Data Visualization?
Data visualization is an approach to represent a vast amount of data in a graphical format. This graphical representation of data makes users understand it very easily and effectively. It visualizes data by using visual elements such as maps, charts, and graphs to provide an accessible way to spot and understand trends, patterns, and outliers in data.
What is Tableau Dashboard?
Tableau dashboard is a group of various views which allows you to compare different types of data simultaneously. Datasheets and dashboards are connected ones if any modification happens to the data that is directly reflected in dashboards. It could be the best way to visualize and analyze the data.
Procedure for Building your First Dashboard in Tableau
Tableau is often regarded as the grandmaster tool of data visualization software and is used to build dashboards that communicate clearly. Dashboarding with tableau allows even non-technical users to create real-time and interactive visualizations within a fraction of time. Using tableau you can create dashboards that do not require any programming support for sharing them on either the tableau server or tableau desktop.

Introducing the Dashboard Worksheet
Dashboard worksheet replaces the creation of multiple, complementary worksheets. Tableau dashboards combine all the worksheets into an integrated view and make it one worksheet for access.
The tableau tool window appears as shown in the figure below. On the top, we have an option named a new dashboard menu. After clicking on that menu we will find a new worksheet or new dashboard option, that enables us to create a new dashboard in tableau. After that, we have some sources on this window, which include the dashboard shelf on the top-left half, and access to another object is provided by the bottom half in order to control several operations in the dashboard workspace.
.png&w=1920&q=75)
Figure 1: Tableau’s Dashboard Worksheet
Now we are going to create the dashboard using the sample superstore plan, which shows the sales and profits for different segments and subcategories of products across all the states. Following are the steps to create the dashboard according to the objective.
[Related Article: How to customize shapes, colors, fonts, and images in Tableau?]
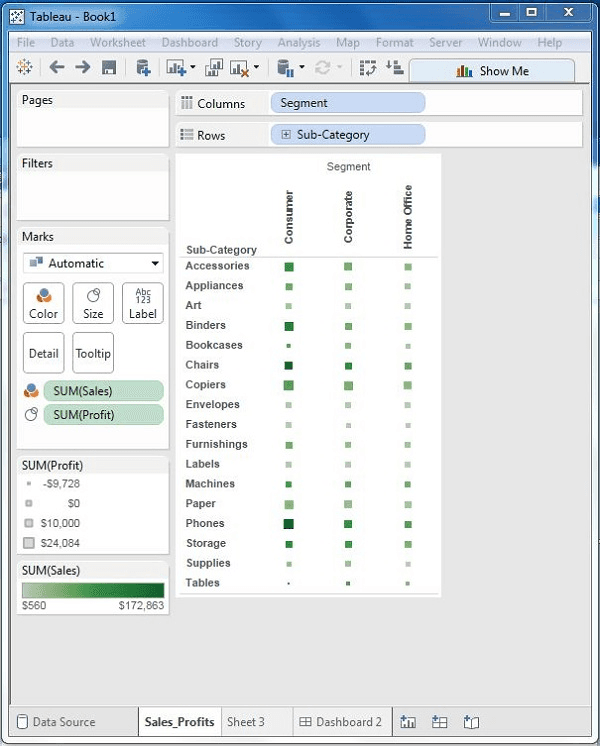
Step1: Using add worksheet icon which is at the bottom of the workbook you can create a blank worksheet. Drag the dimensions sub-category to the row shelf and segments to the column shelf. Drag and drop the measures profit to the size shelf and the measures sales to the color shelf, this worksheet is referred to as a master worksheet. Now rename the worksheet with the sales profit, then chat appears as follows.
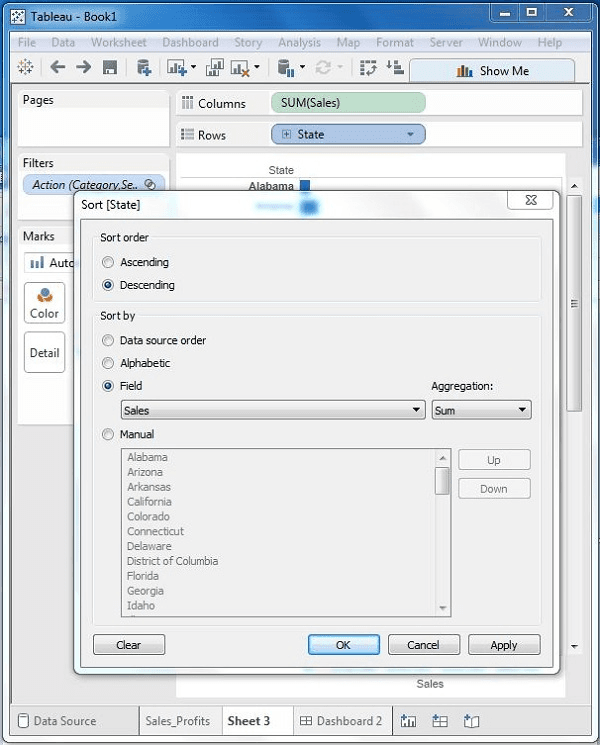
Step 2: To know the order details of the sales across the states create another and drag the measure sales to the columns shelf and state dimensions to the row shelf as shown in the image. To arrange the sales in descending order apply the filter to the state field and rename the worksheet as Sales_State.
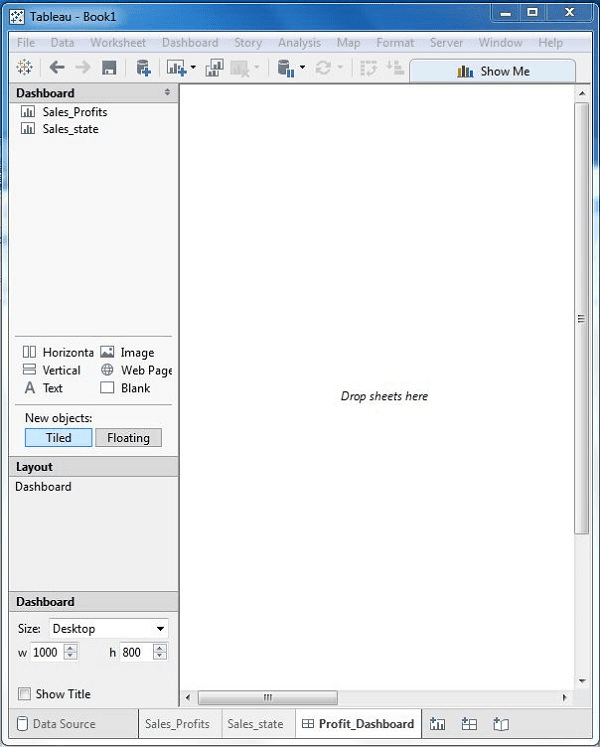
3: To create a new dashboard link click on create a blank dashboard which is at the bottom of the workbook and rename the dashboard as Profit_Dashboard.
[Related Article: What is the wrong way to build a dashboard in tableau?]
Step 4: When you drag the two worksheets to the dashboard you will have three small icons, then click the middle icon, which gives you a quick view of how to use a filter by hovering the mouse over it.
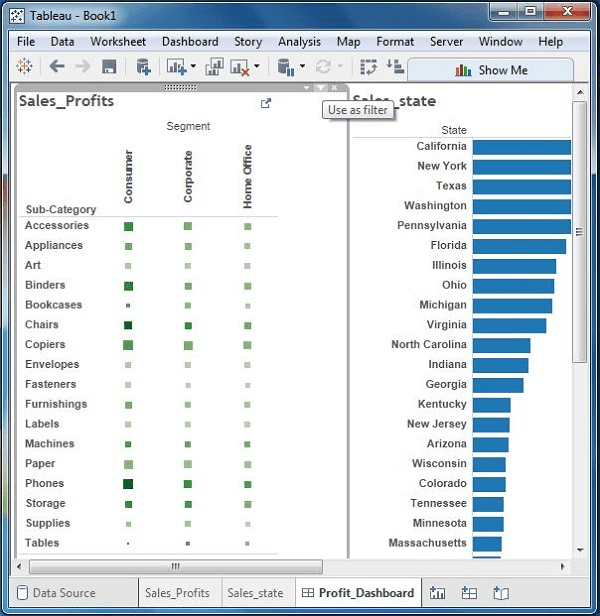
Step 5: Check the subcategories in the dashboard which represent the segment named consumers and named machines.
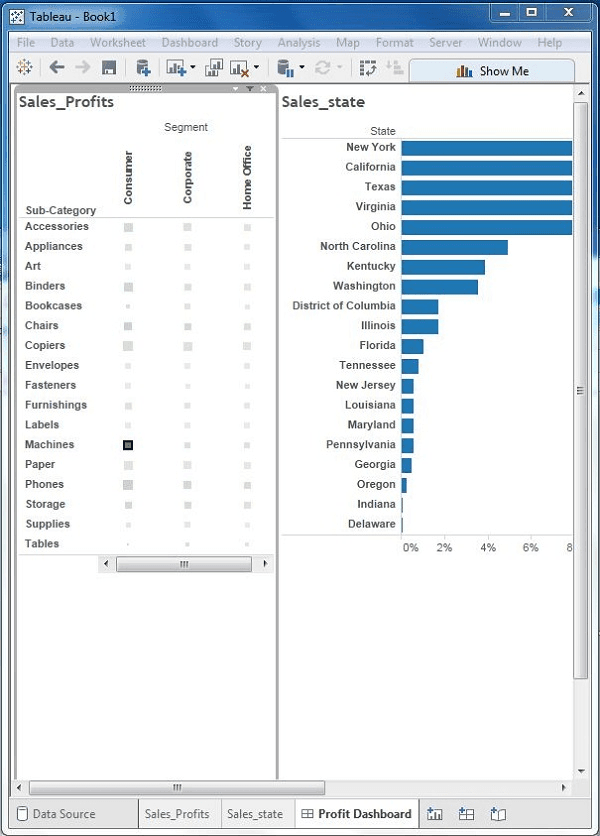
By following the above-mentioned five steps one can create effective dashboards in tableau.
| Explore Tableau Sample Resumes! Download & Edit, Get Noticed by Employers! Download Now |
List of Tableau Courses
| Tableau Advanced |
| Tableau Server |
| Data Visualization and Dashboarding Fundamentals |
 On-Job Support Service
Online Work Support for your on-job roles.

Our work-support plans provide precise options as per your project tasks. Whether you are a newbie or an experienced professional seeking assistance in completing project tasks, we are here with the following plans to meet your custom needs:
- Pay Per Hour
- Pay Per Week
- Monthly
| Name | Dates | |
|---|---|---|
| Tableau Training | Jul 28 to Aug 12 | View Details |
| Tableau Training | Aug 01 to Aug 16 | View Details |
| Tableau Training | Aug 04 to Aug 19 | View Details |
| Tableau Training | Aug 08 to Aug 23 | View Details |

Pranaya is working as a Content Writer at Mindmajix. She is a technology enthusiast and loves to write about various technologies which include, Java, MongoDB, Automation Anywhere, SQL, Artificial Intelligence, and Big Data. You can connect with her via LinkedIn and Twitter.


