
- Alteryx vs Tableau
- The Assistance of Tableau Rest API, You Can Now Automate Server Administration Tasks
- How to Blend Different Data sources in a Single Worksheet in Tableau
- Tableau Essentials
- Components Of Data Warehouse - Tableau
- How to Connect to Your Data and Generated Values of Tableau
- Create Visual Analytics Using Tableau Desktop
- Generate a new data with forecasts in an ad hoc analysis environment
- Future and Career Growth as a Tableau developer
- Import Custom Geocode Data / Map in Tableau
- Tableau Essentials: Chart Types
- How to Enhance Views with Filters, Sets, Groups and Hierarchies in Tableau?
- How to become a Tableau Developer -A Perfect Guide
- How to edit views in tableau server?
- Detailed Guide to Get Certified in Tableau
- Building Interactive Tableau Dashboards
- Introducing the Tableau Desktop Workspace - Tableau
- How to Join Database Tables with Tableau
- Introduction to Joins In Tableau
- Lumira Vs Tableau
- Top Reasons To Learn Tableau
- Authoring and editing reports via server in tableau
- Tableau 10.2.1 – New Capabilities and Corrected Issues in TABLEAU
- Tableau Advanced Interview Questions
- Introduction to Tableau API
- Why Tableau is Considered the Best BI Tool ?
- Growth of Tableau BI (Business Intelligence) Among Trending Technologies
- Tableau Calculated fields
- Table calculation in Tableau
- Tableau Careers and Salaries
- Tableau Case Statements
- Tableau Certification
- Create Pie charts, Scatter Plot, Area Fill charts & Circular View in Tableau
- Tableau Competitors
- Tableau Desktop Tutorial
- Tableau Drivers
- Tableau Ecosystem Contains Of Different Components
- Tableau Interview Questions And Answers
- Tableau Latest Version
- What are the web mapping service pros and cons in tableau?
- Tableau Maps Tutorial
- Tableau Parameters
- Tableau Reporting
- Tableau Reporting Tool
- Tableau Reshaper Tool
- Tableau Server
- Tableau Server interview Questions
- Tableau Server Tutorial
- Tableau Show Me feature
- Tableau Tutorial
- Tableau Version History
- Tableau Visualization Course and its advantages in the current job market
- Tableau vs Cognos
- Tableau vs Domo
- Tableau vs Looker
- Tableau Vs Microstrategy
- Tableau vs Power BI
- Tableau vs QlikView
- Tableau Vs Spotfire
- Animating maps using the pages shelf or slider filters in Tableau
- Succession Planning analytics and Hr Dashboard in Tableau
- How to publish dashboards in tableau server?
- How Tableau geocodes your data?
- How to use Date Field in Tableau?
- How the Table Calculations Use Building Formulas in Tableau
- How to Add Flexibility to Calculations with Parameters in Tableau
- How to Build your first Advanced Dashboard in Tableau?
- How to Change the Scope of Trend Lines Tableau
- How to configure tableau server for the first time?
- How to consume information in tableau server?
- How to create a Standard Map View in Tableau?
- How to Create Calculated Values using Dialog Box in Tableau
- How to Customize Shapes, Colors, Fonts and Images in Tableau?
- How to deploy tableau server in high availability environments?
- How to deploy tableau server in multi-national entities?
- How to Determine your Hardware and Software needs in Tableau server?
- How to embed tableau reports securely on the web?
- How to improve appearance to convey meaning more precisely in tableau?
- Install Tableau Server and Reasons to Deploy it
- How to Install the Command Line Tools in Tableau?
- How to monitor activity on tableau server?
- How to organize reports for consumption in tableau server?
- How To Sort Data In Tableau
- Use Custom Background Images to Plot Spatial Data
- How to use maps to improve insight in Tableau?
- How to use performance recorder to improve performance in tableau server?
- Tableau Subscription and Report Scheduling
- How to use tabadmin for administrative task automation in tableau?
- How to Use Table Calculation Functions in Tableau
- Learning to leverage tabcmd in tableau
- Leverage existing security with trusted authentication in tableau server
- Managing tableau server in the cloud
- Planning for a successful tableau deployment at ACT
- How to Plot Your Own Locations on a Map in Tableau
- Tableau Self-Service Ad Hoc Analysis with Parameters
- Quality metrics in a hospital in tableau
- Trend Lines and Reference Lines In Tableau
- What Are Calculated Values and Table Calculations in Tableau?
- What are the advanced chart types in tableau?
- Tableau Dashboard Best Practices
- What are the common use cases for tabcmd in tableau?
- What are the licensing options for tableau server and tableau online?
- What are the Options for Securing Reports in Tableau?
- Sharing Connections, Data Models, Data Extracts in Tableau
- What are the tips, tricks and timesavers in tableau?
- What are the typical map errors and how to deal with them in tableau?
- What do tabcmd and tabadmin do in tableau’s command line tools?
- Tableau Aggregate Functions
- What is the right way to build a dashboard in tableau?
- What is the wrong way to build a dashboard in tableau?
- What kinds of tasks can be done with tabcmd commands
- When and how to deploy server on multiple physical machines in tableau?
- Tableau Extracts or Direct Connection - When to Use
- The Practicality of Using Tableau Mobile to Create Visualization
- Web Data Connector in Tableau Server
- Data Visualization and its influence on Businesses
- Tableau Charts Types
- How to Use Date Functions in Tableau
- Tableau Architecture and Ecosystem Components
- Looker vs Power BI
- How to Create Sets in Tableau
- Tableau Projects and Use Cases
- Tableau Integration with Salesforce
- Excel vs Tableau
- Tableau Server Administration
Over 2.5 quintillion bytes of data is generated every single day, and the estimation is that, by 2020, over 1.7 MB of data is expected to attain optimum efficiency. Businesses are bound to look for new transformation methods to combine data to achieve optimum efficiency. One such process of combining data is Tableau Data Blending.
Tableau Data Blending is in high demand among enterprises today, and to capitalize further on this demand, Tableau is expanding its product offerings such as Tableau Creator, Viewer, and Explorer.
| To gain in-depth knowledge and be on par with practical experience, then explore the "Tableau Training Course Certification". |
Q1) What is Tableau Data Blending?
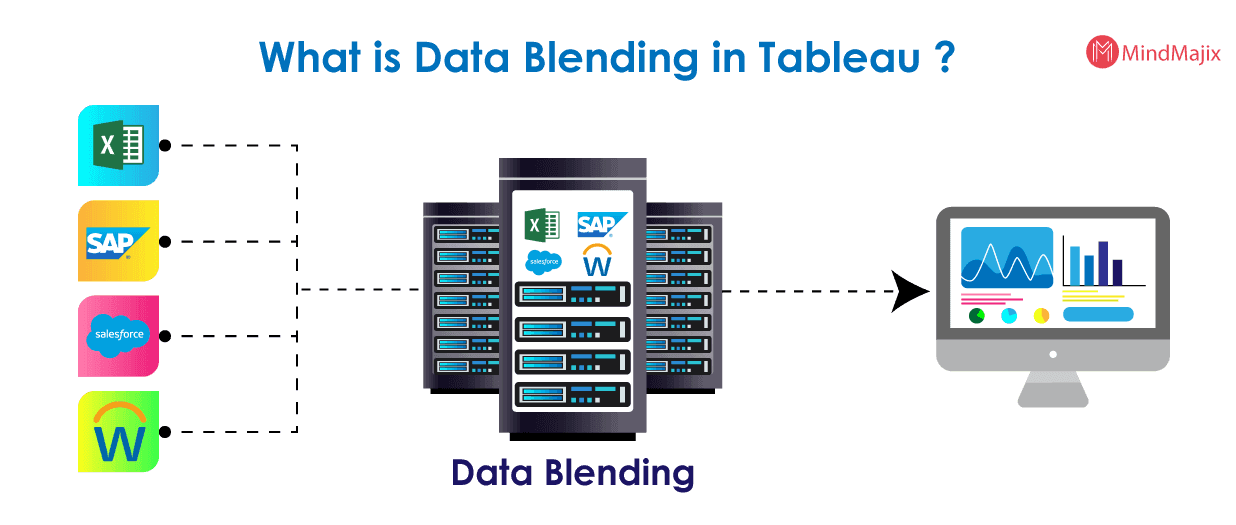
Tableau Data Blending is a powerful Tableau feature that is used to analyze the related data into a single view among multiple data sources.
Data Blending is aimed at making Tableau’s offerings easy to customize and scale, thus receiving positive feedback from the company’s clients. Now, because data blending plays such a crucial role in any organization’s data cycle, it makes for an essential module in the Tableau training curriculum. Data Blending performs the following activities.
- It combines data from distinct sources and brings additional data from a secondary source, and then displays it with the data in the primary source directly in a single view.
- It combines data that supplements a data table from one data source with the data columns from another data source. Usually, joins are used to combine data, but they are sometimes based on factors like the data type and granularity when data blending is used.
Q2) When to Choose Tableau Data Blending?
Data blending can be chosen under the following conditions:
You want to combine data from multiple databases but not supported by cross-database joins: When cross-database joins are not supporting connections to cubes (like Oracle Essbase) or some exact-only connections (such as Google Analytics), in such cases, you have to set up individual data sources to analyze and use data blending to combine the data sources on a single sheet.
Data is at different levels of detail:
Data set captures data sometimes using various levels of detail, i.e., greater and lesser granularity than the other data set.

Q3) Why do you need Tableau Data Blending?
Data blending in Tableau provides the user with options to combine and join various data sources. However, mixing and joining are different in Tableau. Unlike other joining cases, Data Blending enables combining data sources after aggregation on the specific sources.
- Tableau data blending allows blending data on a single worksheet from multiple data sources and is attached to standard dimensions.
- No need to create new level joins and is no way to add rows to your data or new dimensions.
- It is utilized when there exists related data from various sources that you want to be combined in a single view.
- To combine the data, you should first add one of the standard dimensions from the primary data source to the view.
| Read these latest Tableau Interview Questions and Answers that help you grab high-paying jobs! |
Q4) How is Data Blending different from Data Joining?
Data blending stimulates the traditional left join. The main difference between these two is when the join is performed concerning aggregation. It requires at least two data sources termed primary and secondary sources. When designated a primary data source, it performs the functions as the primary data source or main table. Any subsequent data sources used on the sheet are treated as secondary data sources. The columns of secondary data sources have corresponding matches in the primary data source appear in the view.
- After characterizing primary and secondary data sources, defining the standard dimension or dimension between two data sources is a must. This defining process is termed the linking field.
- If the date field in the primary and secondary data sources have fields with the same name, then Tableau creates the association between them. This relationship is a link icon ( ) next to the date field when the field is in the view in the secondary data source.
- If two dimensions do not have the same name, it defines a relationship that creates an exact mapping between date fields among primary and secondary data sources.
Q5) How does Data Blending Work in Tableau?
Data Blending in Tableau won’t create any row-level joins or even not a way to add new rows or dimensions to your data. Data blending best fits when you have related data in distinct sources to analyze together in a single view. If you're going to integrate data, first add one of the standard dimensions from the primary data source to the view.
For instance, let’s consider a classic example of Sales and Target of business. The operation is to perform Tableau data blend on the two data sources. When blending primary and target sales data, the two data sources may have a common data field. The date field is used on the sheet. When you switch the secondary source in the data window, Tableau links the fields having the same name automatically. If both are under the same name, a custom relationship can be defined to create an accurate mapping between fields.
For data sources used on the sheet, queries are sent to the database and process the results, left joined the common dimensions. The join is performed on the member’s alias names of the standard sizes. Therefore, the values aren’t an exact match and can fix in Tableau.
A regular test should be performed to observe whether the data is integrated smoothly to drag dimensions from the primary source into the text table on the sheet. On the other sheet, drag the same fields from secondary sources into the text table. If these two tables are matched, the data is almost going to blend accurately in Tableau.
| Related Article: Tableau Join Tables |
Implementing Tableau Data Blending with an Example:
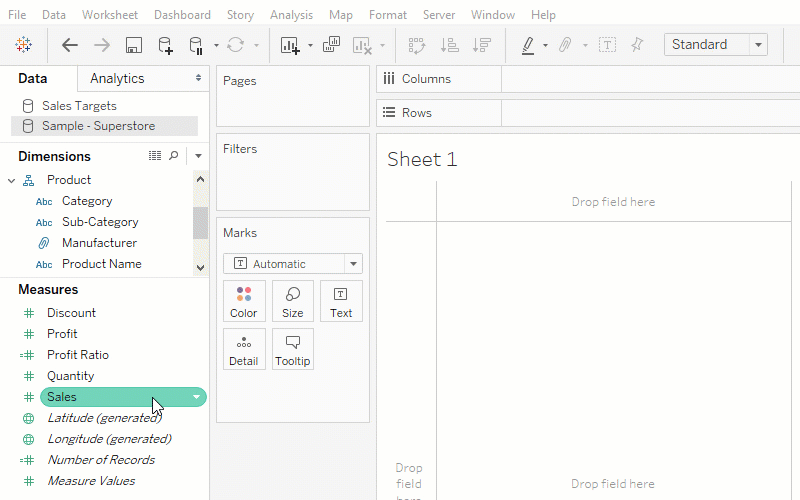
Step1: Connect to your data and set up the data sources and designate a primary data source
Step2: Select Data > Connect to Data and connect to the Sales Plan spreadsheet. Drag the Sales Plan measure to the Level of Detail shelf.
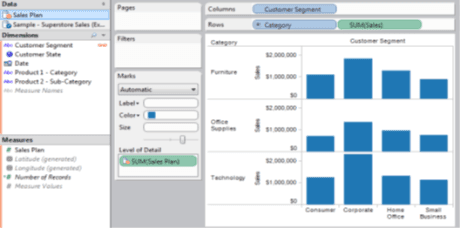
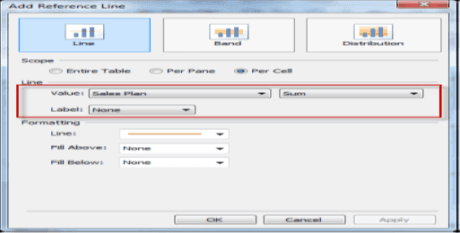
Step3: Designate a secondary data source. Right-click the Sales axis and select Add Reference Line. In the Reference Line dialogue box, add reference lines, which shows Sales Plan per cell. Click OK when finished.
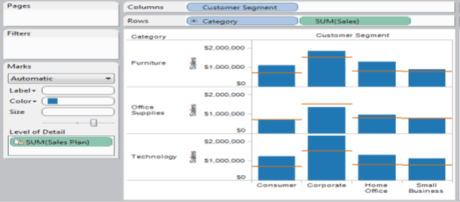
Step4: Now the worksheet pulls data from the Sales plan ( secondary source) to show how sales are compared to the sales forecast.
| Check Out Tableau Tutorial |
Q6) When to Substitute Joining for Blending in Tableau?
As we already discussed earlier, Tableau Data Blending is the operation performed to combine multiple data sources into the same view through common fields between them to join. Unlike the ordinary join that combines data sources at the lowest granularity before aggregation is done, a Tableau data blend can combine data sources after aggregation on the individual sources, and ultimately limit the quantity (number) of records joined thus maximizing computational efficiency. The post-aggregate join performs better than joining at row-level before developing the view and then conducts aggregate calculations.
Types of Tableau Data Blending
There are two types of Tableau Data Blending as discussed below:
1) Automatically Defined Relationship:
Automatic Data Blending is defined as a relationship in Tableau that works best only if the field in which we are working on consists of the field name same for both sources of data. If not, we have alias names so that they can match.
2) Manual Tableau Data Blending:
The data blending process is used when there exists a scenario that requires a more complex blend that would be the budget comparison data from spreadsheets with data from a database.
Limitations of Data Blending in Tableau
There are few limitations of Tableau data blending around non-additive aggregates like RAWSQLAGG and MEDIAN. They are:
- It compromises the query speed in high granularity.
- When you are sorting a calculated data field that uses blended data, that field is not listed in the sorted field drop-down dialog box.
- Cube data sources can be used only as a primary data source to blend data in Tableau, and cannot be used as secondary data sources.
Final Words
The success of BI projects depends on an organization's choice of BI solutions and the vendor’s ability to deliver relatively rapid and successful implementations, along with supportive maintenance and follow-up.
However, choosing the right BI tool for your business is the primary condition to ensure better business insights. With a quick list of BI tools, you may shortlist the best suitable one for your business, be it big or small.
Most data analysts are switching to business analytics tools today for more flexible solutions. Try Mindmajix Data Analytics training for a better understanding of Data Analytics in the business process.
 On-Job Support Service
Online Work Support for your on-job roles.

Our work-support plans provide precise options as per your project tasks. Whether you are a newbie or an experienced professional seeking assistance in completing project tasks, we are here with the following plans to meet your custom needs:
- Pay Per Hour
- Pay Per Week
- Monthly
| Name | Dates | |
|---|---|---|
| Tableau Training | Aug 01 to Aug 16 | View Details |
| Tableau Training | Aug 04 to Aug 19 | View Details |
| Tableau Training | Aug 08 to Aug 23 | View Details |
| Tableau Training | Aug 11 to Aug 26 | View Details |

Prasanthi is an expert writer in MongoDB, and has written for various reputable online and print publications. At present, she is working for MindMajix, and writes content not only on MongoDB, but also on Sharepoint, Uipath, and AWS.


