
- Alteryx vs Tableau
- The Assistance of Tableau Rest API, You Can Now Automate Server Administration Tasks
- How to Blend Different Data sources in a Single Worksheet in Tableau
- Tableau Essentials
- Components Of Data Warehouse - Tableau
- How to Connect to Your Data and Generated Values of Tableau
- Create Visual Analytics Using Tableau Desktop
- Generate a new data with forecasts in an ad hoc analysis environment
- Future and Career Growth as a Tableau developer
- Import Custom Geocode Data / Map in Tableau
- Tableau Essentials: Chart Types
- How to Enhance Views with Filters, Sets, Groups and Hierarchies in Tableau?
- How to become a Tableau Developer -A Perfect Guide
- How to edit views in tableau server?
- Detailed Guide to Get Certified in Tableau
- Building Interactive Tableau Dashboards
- Introducing the Tableau Desktop Workspace - Tableau
- How to Join Database Tables with Tableau
- Introduction to Joins In Tableau
- Lumira Vs Tableau
- Top Reasons To Learn Tableau
- Authoring and editing reports via server in tableau
- Tableau 10.2.1 – New Capabilities and Corrected Issues in TABLEAU
- Tableau Advanced Interview Questions
- Introduction to Tableau API
- Growth of Tableau BI (Business Intelligence) Among Trending Technologies
- Tableau Calculated fields
- Table calculation in Tableau
- Tableau Careers and Salaries
- Tableau Case Statements
- Tableau Certification
- Create Pie charts, Scatter Plot, Area Fill charts & Circular View in Tableau
- Tableau Competitors
- Tableau Data Blending
- Tableau Desktop Tutorial
- Tableau Drivers
- Tableau Ecosystem Contains Of Different Components
- Tableau Interview Questions And Answers
- Tableau Latest Version
- What are the web mapping service pros and cons in tableau?
- Tableau Maps Tutorial
- Tableau Parameters
- Tableau Reporting
- Tableau Reporting Tool
- Tableau Reshaper Tool
- Tableau Server
- Tableau Server interview Questions
- Tableau Server Tutorial
- Tableau Show Me feature
- Tableau Tutorial
- Tableau Version History
- Tableau Visualization Course and its advantages in the current job market
- Tableau vs Cognos
- Tableau vs Domo
- Tableau vs Looker
- Tableau Vs Microstrategy
- Tableau vs Power BI
- Tableau vs QlikView
- Tableau Vs Spotfire
- Animating maps using the pages shelf or slider filters in Tableau
- Succession Planning analytics and Hr Dashboard in Tableau
- How to publish dashboards in tableau server?
- How Tableau geocodes your data?
- How to use Date Field in Tableau?
- How the Table Calculations Use Building Formulas in Tableau
- How to Add Flexibility to Calculations with Parameters in Tableau
- How to Build your first Advanced Dashboard in Tableau?
- How to Change the Scope of Trend Lines Tableau
- How to configure tableau server for the first time?
- How to consume information in tableau server?
- How to create a Standard Map View in Tableau?
- How to Create Calculated Values using Dialog Box in Tableau
- How to Customize Shapes, Colors, Fonts and Images in Tableau?
- How to deploy tableau server in high availability environments?
- How to deploy tableau server in multi-national entities?
- How to Determine your Hardware and Software needs in Tableau server?
- How to embed tableau reports securely on the web?
- How to improve appearance to convey meaning more precisely in tableau?
- Install Tableau Server and Reasons to Deploy it
- How to Install the Command Line Tools in Tableau?
- How to monitor activity on tableau server?
- How to organize reports for consumption in tableau server?
- How To Sort Data In Tableau
- Use Custom Background Images to Plot Spatial Data
- How to use maps to improve insight in Tableau?
- How to use performance recorder to improve performance in tableau server?
- Tableau Subscription and Report Scheduling
- How to use tabadmin for administrative task automation in tableau?
- How to Use Table Calculation Functions in Tableau
- Learning to leverage tabcmd in tableau
- Leverage existing security with trusted authentication in tableau server
- Managing tableau server in the cloud
- Planning for a successful tableau deployment at ACT
- How to Plot Your Own Locations on a Map in Tableau
- Tableau Self-Service Ad Hoc Analysis with Parameters
- Quality metrics in a hospital in tableau
- Trend Lines and Reference Lines In Tableau
- What Are Calculated Values and Table Calculations in Tableau?
- What are the advanced chart types in tableau?
- Tableau Dashboard Best Practices
- What are the common use cases for tabcmd in tableau?
- What are the licensing options for tableau server and tableau online?
- What are the Options for Securing Reports in Tableau?
- Sharing Connections, Data Models, Data Extracts in Tableau
- What are the tips, tricks and timesavers in tableau?
- What are the typical map errors and how to deal with them in tableau?
- What do tabcmd and tabadmin do in tableau’s command line tools?
- Tableau Aggregate Functions
- What is the right way to build a dashboard in tableau?
- What is the wrong way to build a dashboard in tableau?
- What kinds of tasks can be done with tabcmd commands
- When and how to deploy server on multiple physical machines in tableau?
- Tableau Extracts or Direct Connection - When to Use
- The Practicality of Using Tableau Mobile to Create Visualization
- Web Data Connector in Tableau Server
- Data Visualization and its influence on Businesses
- Tableau Charts Types
- How to Use Date Functions in Tableau
- Tableau Architecture and Ecosystem Components
- Looker vs Power BI
- How to Create Sets in Tableau
- Tableau Projects and Use Cases
- Tableau Integration with Salesforce
- Excel vs Tableau
- Tableau Server Administration
The analytics field is dynamically growing each and every day and increasing difficulties for vendors to provide the best and customized business intelligence tools. Till now, this industry was led by IBM, Oracle, and SAP, etc. But, nowadays, along with a rich set of features, Business Intelligence analytics wants efficiency and ease of use as well. In recent times, business needs more attractive, interactive, and agile tools to work with their real-time requirements.
Tableau is one such leading business intelligence tool to grow the business rapidly and make it easy-to-comprehend by consumers and clients. It is an easily deployable, highly scalable, and efficient performing framework. Due to all these features, it has become the leader for the analytics field in this year’s Gartner Magic Quadrant. For many years, this software tool is receiving appreciations from various large enterprises across the globe.
Here, we will explore why Tableau is considered as the best BI tool. We will be covering the below topics further.
- Tableau Features
- What makes Tableau best amongst all other BI tools?
Are you interested in learning Tableau Online course from Industry Experts?
Get the best Tableau Online Course here.
Tableau Features
Tableau has various features which are why it has become popular. Below are some of the key features of Tableau:
- Embed dashboards within - We can use Tableau dashboards and include them on our webpage and also show it in different layouts based on its IFrame’s size.
- Share dashboards - We can share these dashboards with any user even if they don’t have Tableau Desktop at their end.
- Dashboards Commenting - Tableau supports dynamic commenting on dashboards which increases its usability and understanding.
- Patented technology from Stanford University - Tableau was brought by Stanford University with VizQL. It has changed working with data completely.
- Data notifications - Tableau supports data-driven alerts in which if data crosses some important visualization mark, it will send an alert email to the respective users to address them.
- Security permission at any level - Tableau allows setting permissions at 6 levels: Site, Project, Group, User, Workbook and Data Source
- Mobile-supported dashboards - Tableau Mobile keeps your data at your fingertips.
- Toggle view and drag and drop - Tableau allows us to switch between different views in worksheets. In Tableau, everything we can just do with a drag and drop functionality.
- Filter and highlight data - Tableau allows us to drill down our visualization and colour-specific marks using a variety of tools.
- Automatic updates - Tableau allows us to pause or reset the automatic updates while building a large view until we are finished with organizing data.
- Server REST API - With Tableau server REST API, we can get programmatic access to all the functionalities behind any projects, data sources, workbooks, sites or site users on Tableau Server.
- “No-code” data queries - Yes, it is possible to query data source without performing a single line of code query in Tableau.
- Interactive dashboards - Tableau’s most highlighting feature is Interactive dashboards. It enables us to visualize our data, filter them on demand.
- Metadata management - Whatever we are adding manually on top of original things is called metadata. Tableau keeps track of all these metadata and makes everything in sync and consistent.
(Related Article - Building Interactive Dashboards In Tableau)
Along with these key features, Tableau has some major important features embedded in Tableau 10.

Revision History
We can roll back to the older version of the workbook just by one click in Tableau. We can also limit the number of revisions by changing the setting on Tableau server
Mobile Device Management
Tableau supports VMware Airwatch and MobileIron for mobile device management. So that we can deploy Tableau on mobile across organizations securely.
Site SAML
Tableau Server supports different SAML based identity providers on a per-site basis.
- PingOne
- Okta
- OneLogin
- PingFederate

JavaScript API Enhancements
In Tableau 10, there are two new JavaScript APIs added - getSummaryDataAsync and getUnderlyingDataAsync. With these two APIs, we can get programmatic access to the data of the visualization. We can export the data in other programs easily.
Visit here to learn Tableau Online Certification Course in Hyderabad
REST API Enhancements
In Tableau 10, REST API is extended with more metadata information and user results filtering.
Documents API
In Tableau 10, a new document API was introduced which can give support to working with Tableau files such as .twb and .tds. This implies that we can create any template workbook and deploy that across the whole organization.
Licensing Views
Tableau has introduced a new feature where it has administration views which has details of licensing and usage of Tableau desktop. Once it is configured on Tableau Desktop, it will automatically send usage information to Tableau server every 8 hours. For this server, login is not required.
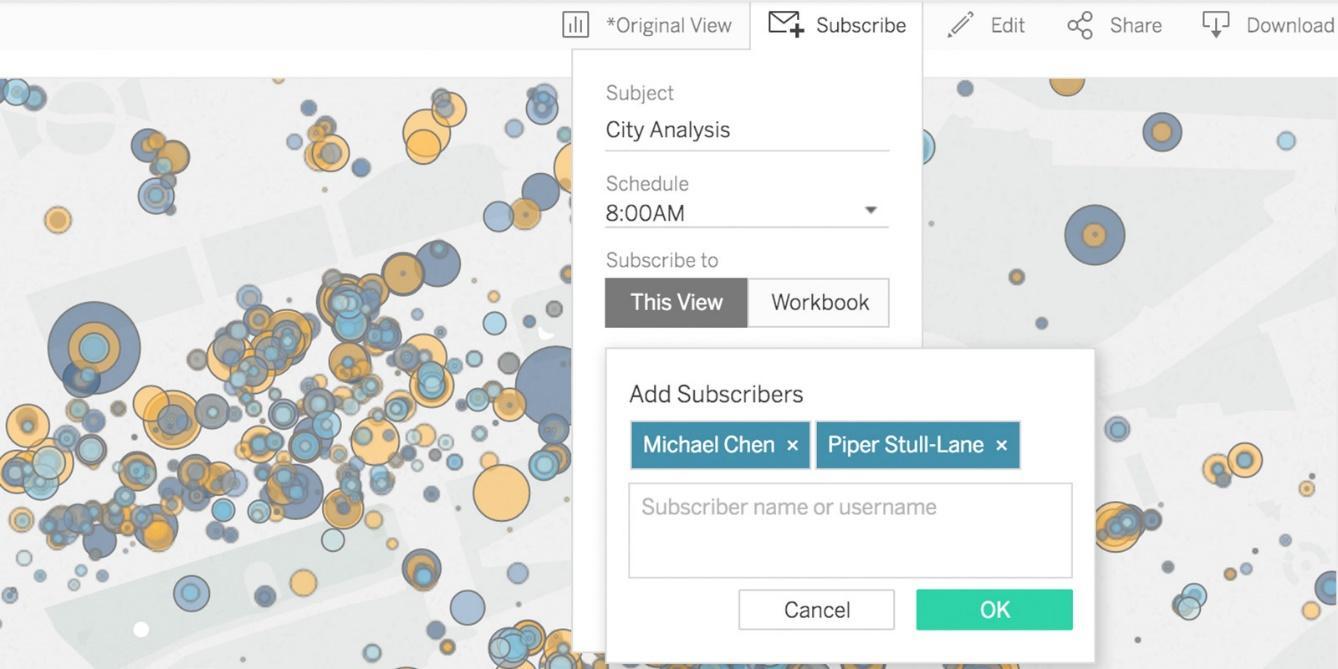
Subscribe others
We can send subscription emails to users and allow others to subscribe to our dashboards just through a click.
Web Data Connector
In Tableau 10, a web data connector can be built powerful and flexible as this version is easier to use and supports multiple tables joins.
ETL Refresh
Web connector has enabled Tableau to refresh an external ETL job without touching the analysis of data flow.
Why Tableau BI Tool is Better?
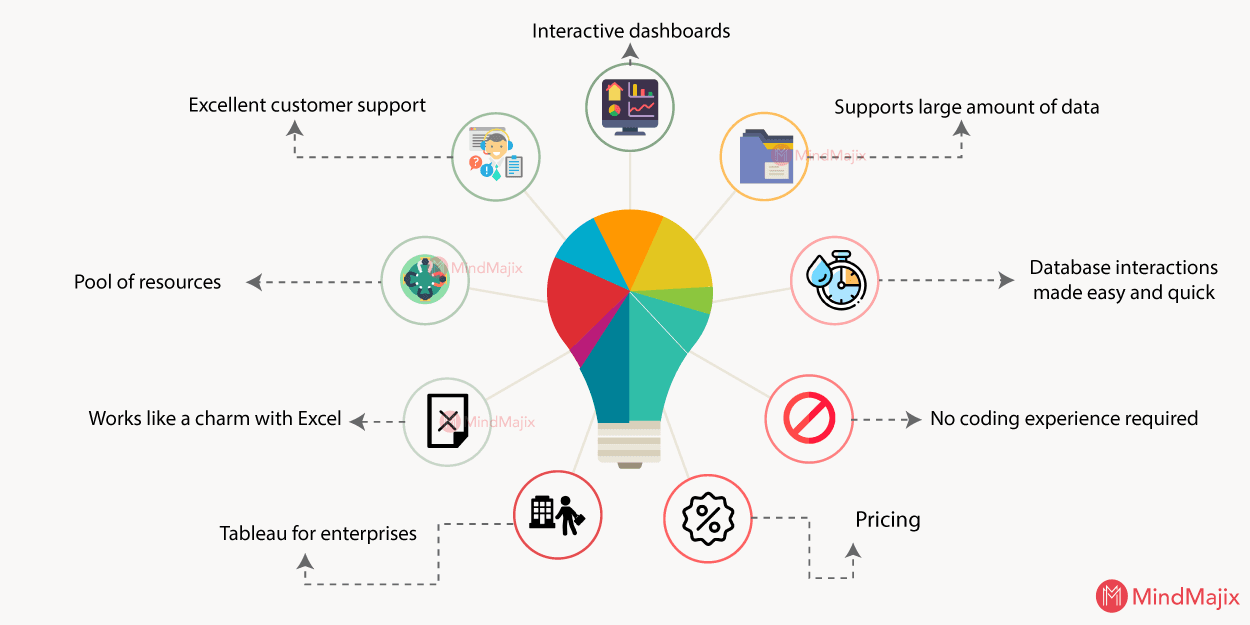
Interactive dashboards
Using Tableau, creating interactive dashboards is a simple and easy task anyone can do within minutes. There are so many variations available which we can use while creating dashboards which also restricts us from creating charts that are against data visualization practices.
Tableau is basically a data visualization tool that can create stories through simple visualization. Through visualization, any complex thing can be easy to understand my clients. The same thing cannot be easily derived from clients by sharing a spreadsheet. Tableau has made data analyzing easy, fast and beautiful. Users can select any visualization template from the library or they can create their own custom one. Is anyone unaware of Tableau’s visualizations capabilities? Check this out here.
Managing executives of your company can be a cakewalk for you if you’re using Tableau. You can make any changes quickly and easily suggested by clients. These dashboards can be deployed at Tableau server and can be viewed on a laptop, tablet or mobile. This is self-service analytics at its best.
Supports a large amount of data
Tableau deals with both cloud-based and on-premise services. It solves customers’ business analytics problems by managing their data centrally. It can handle millions of sets of data with so much ease. Without affecting the performance of dashboards, various types of visualization can be created with a large quantity of data.
Tableau also supports live connections to different data sources like SQL. Through live connections, Tableau provides real-time data feeds to enterprise users. Tableau also provides support to 40 different data sources. Some are mentioned below.
- File-based data sources - Excel and CSV
- Web Data Connector - web services as a source
- Cloud-based data sources – SuccessFactors, Google Analytics
- Relational database data sources – DB2, Teradata, SQL Server
- OLAP data sources – BW, Microsoft Analysis Services
Database interactions made easy and quick
Through Tableau, we can easily connect with database views. It also helps us to optimize our queries’ performance. Moreover, Tableau has some very important inbuilt features like extract, transform, and loading. Due to these features, we can modify data types, split or join data, concatenate data and also blend data, etc. Furthermore, we can also create groups, sets or data bins. This implies that there is no need for any separate ETL tool to do so.
Leave an Inquiry to learn Tableau Certification Course in Bangalore
No coding experience required
Any person having some basic expertise can work with Tableau without any coding experience. No coding skill is required to work with Tableau. Almost all the functionalities are available through drag and drop. By using Tableau’s in-built calculations, we can easily add any complex analysis with just one click. Tableau also provides integrations with popular programming languages like R and Python which is a great help for the data science field.
Pricing
Although Tableau is costlier than other BI tools in the market, it has scored brownie points due to its great features and BI support. There is no hidden cost. Its basic pricing range starts with 35$ per user per month.
Checkout Tableau Interview Questions
Tableau for enterprises
Requirements also vary from company to company. Tableau has many solutions that can fulfil requirements from an individual user to a large enterprise.
For an individual user, Tableau Desktop is the solution for their needs. This tool helps an individual user to create data visualizations, publish data sources or workbooks to Tableau server.
For small to large enterprises, Tableau server is used for fulfilling their BI requirements. This is an on-premise solution. This tool can take data from anywhere and share across the organization through desktop or mobile browsers. There are also android and iPhone apps available to do so.
As we have mentioned earlier, along with on-premise Tableau also provides cloud-based services. Tableau Online is the platform hosted on the cloud. It removed the need for IT infrastructure or support. There is no setup required as it is already set up on the cloud. So, there is no need to set up and configure servers.
Works like a charm with Excel
Excel is a go-to tool for any business user for data analyzing. That is a comfort zone for everyone analyzing the data. Tableau performs exceptionally well while working with excel. Tableau explores excel data faster and easier through the drag and drop approach to visual analysis. Tableau visualizations are interactive and shareable which enables the business to get required answers. We can combine Excel’s data collection and management capabilities with the intuitive nature of Tableau and together they generate actionable insights from raw data.
(Related Article: Data Visualization For Business)
Pool of resources
There is a large collection of resources like online guides, forums and training available everywhere on the internet if you want to use Tableau. Along with this, there are various communities for Tableau available which can answer all of your questions. Tableau has its own community as well which is engaging and enthusiastic and can resolve any of the queries.
Large Customer Base
Tableau has more than 50,000 happy customer accounts. It has covered almost all the possible industries like aerospace, automotive, banking, business and services, media and entertainment, communication, consumer services, education, retail and wholesale, financial services, Government. Travel and Hospitality etc. Below are the few companies using Tableau for their data visualization and analysis.
- Adobe
- HP
- Citibank
- JP Morgan
- Bank of America
- Barclays
- Intuit
- Audi AG
- Skype
- Deloitte
- Nike
- American Airlines
Excellent customer support
The happy and satisfied customer base of Tableau keep tableau growing. There is one factor that plays an important role to keep their customers happy and stick to Tableau, which is their customer support. Tableau customer support is considered as one of the best and trustworthy customer services provided by any BI tool.
These are enough reasons for anyone to switch to Tableau for their business intelligence practices.
List Of Tableau Courses:
| Tableau Advanced |
| Tableau Server |
| Data Visualization and Dashboarding Fundamentals |
 On-Job Support Service
Online Work Support for your on-job roles.

Our work-support plans provide precise options as per your project tasks. Whether you are a newbie or an experienced professional seeking assistance in completing project tasks, we are here with the following plans to meet your custom needs:
- Pay Per Hour
- Pay Per Week
- Monthly
| Name | Dates | |
|---|---|---|
| Tableau Training | Jul 28 to Aug 12 | View Details |
| Tableau Training | Aug 01 to Aug 16 | View Details |
| Tableau Training | Aug 04 to Aug 19 | View Details |
| Tableau Training | Aug 08 to Aug 23 | View Details |

As a Senior Writer for Mindmajix, Saikumar has a great understanding of today’s data-driven environment, which includes key aspects such as Business Intelligence and data management. He manages the task of creating great content in the areas of Programming, Microsoft Power BI, Tableau, Oracle BI, Cognos, and Alteryx. Connect with him on LinkedIn and Twitter.


