
- Alteryx vs Tableau
- The Assistance of Tableau Rest API, You Can Now Automate Server Administration Tasks
- How to Blend Different Data sources in a Single Worksheet in Tableau
- Tableau Essentials
- Components Of Data Warehouse - Tableau
- How to Connect to Your Data and Generated Values of Tableau
- Create Visual Analytics Using Tableau Desktop
- Generate a new data with forecasts in an ad hoc analysis environment
- Future and Career Growth as a Tableau developer
- Import Custom Geocode Data / Map in Tableau
- Tableau Essentials: Chart Types
- How to Enhance Views with Filters, Sets, Groups and Hierarchies in Tableau?
- How to become a Tableau Developer -A Perfect Guide
- How to edit views in tableau server?
- Detailed Guide to Get Certified in Tableau
- Building Interactive Tableau Dashboards
- Introducing the Tableau Desktop Workspace - Tableau
- How to Join Database Tables with Tableau
- Introduction to Joins In Tableau
- Lumira Vs Tableau
- Top Reasons To Learn Tableau
- Authoring and editing reports via server in tableau
- Tableau 10.2.1 – New Capabilities and Corrected Issues in TABLEAU
- Tableau Advanced Interview Questions
- Introduction to Tableau API
- Why Tableau is Considered the Best BI Tool ?
- Growth of Tableau BI (Business Intelligence) Among Trending Technologies
- Tableau Calculated fields
- Table calculation in Tableau
- Tableau Careers and Salaries
- Tableau Case Statements
- Tableau Certification
- Create Pie charts, Scatter Plot, Area Fill charts & Circular View in Tableau
- Tableau Competitors
- Tableau Data Blending
- Tableau Desktop Tutorial
- Tableau Drivers
- Tableau Ecosystem Contains Of Different Components
- Tableau Interview Questions And Answers
- Tableau Latest Version
- What are the web mapping service pros and cons in tableau?
- Tableau Maps Tutorial
- Tableau Parameters
- Tableau Reporting
- Tableau Reporting Tool
- Tableau Reshaper Tool
- Tableau Server
- Tableau Server interview Questions
- Tableau Server Tutorial
- Tableau Show Me feature
- Tableau Tutorial
- Tableau Version History
- Tableau Visualization Course and its advantages in the current job market
- Tableau vs Cognos
- Tableau vs Domo
- Tableau vs Looker
- Tableau Vs Microstrategy
- Tableau vs Power BI
- Tableau vs QlikView
- Tableau Vs Spotfire
- Animating maps using the pages shelf or slider filters in Tableau
- Succession Planning analytics and Hr Dashboard in Tableau
- How to publish dashboards in tableau server?
- How Tableau geocodes your data?
- How to use Date Field in Tableau?
- How the Table Calculations Use Building Formulas in Tableau
- How to Add Flexibility to Calculations with Parameters in Tableau
- How to Build your first Advanced Dashboard in Tableau?
- How to Change the Scope of Trend Lines Tableau
- How to configure tableau server for the first time?
- How to consume information in tableau server?
- How to create a Standard Map View in Tableau?
- How to Create Calculated Values using Dialog Box in Tableau
- How to Customize Shapes, Colors, Fonts and Images in Tableau?
- How to deploy tableau server in high availability environments?
- How to deploy tableau server in multi-national entities?
- How to Determine your Hardware and Software needs in Tableau server?
- How to embed tableau reports securely on the web?
- How to improve appearance to convey meaning more precisely in tableau?
- Install Tableau Server and Reasons to Deploy it
- How to Install the Command Line Tools in Tableau?
- How to monitor activity on tableau server?
- How to organize reports for consumption in tableau server?
- How To Sort Data In Tableau
- Use Custom Background Images to Plot Spatial Data
- How to use maps to improve insight in Tableau?
- How to use performance recorder to improve performance in tableau server?
- Tableau Subscription and Report Scheduling
- How to use tabadmin for administrative task automation in tableau?
- How to Use Table Calculation Functions in Tableau
- Learning to leverage tabcmd in tableau
- Leverage existing security with trusted authentication in tableau server
- Managing tableau server in the cloud
- Planning for a successful tableau deployment at ACT
- How to Plot Your Own Locations on a Map in Tableau
- Tableau Self-Service Ad Hoc Analysis with Parameters
- Quality metrics in a hospital in tableau
- What Are Calculated Values and Table Calculations in Tableau?
- What are the advanced chart types in tableau?
- Tableau Dashboard Best Practices
- What are the common use cases for tabcmd in tableau?
- What are the licensing options for tableau server and tableau online?
- What are the Options for Securing Reports in Tableau?
- Sharing Connections, Data Models, Data Extracts in Tableau
- What are the tips, tricks and timesavers in tableau?
- What are the typical map errors and how to deal with them in tableau?
- What do tabcmd and tabadmin do in tableau’s command line tools?
- Tableau Aggregate Functions
- What is the right way to build a dashboard in tableau?
- What is the wrong way to build a dashboard in tableau?
- What kinds of tasks can be done with tabcmd commands
- When and how to deploy server on multiple physical machines in tableau?
- Tableau Extracts or Direct Connection - When to Use
- The Practicality of Using Tableau Mobile to Create Visualization
- Web Data Connector in Tableau Server
- Data Visualization and its influence on Businesses
- Tableau Charts Types
- How to Use Date Functions in Tableau
- Tableau Architecture and Ecosystem Components
- Looker vs Power BI
- How to Create Sets in Tableau
- Tableau Projects and Use Cases
- Tableau Integration with Salesforce
- Excel vs Tableau
- Tableau Server Administration
We often used to compare things with each other to find out the best insights to choose one of the things. It is the best way to get valuable information and a great understanding of the products. For example, a Comparison between Tableau and IBM Cognos, Understanding the difference between TCP and UDP, so on. Likewise, the trend lines in Tableau is used to estimate the relationship between the variables. So What is the Trend line in Tableau?
What is the Trend Line in Tableau
The Trend lines in Tableau are used to estimate the trend of the variables. It helps to identify the relation between the two variables by observing the trend of the variables simultaneously. For example, a trend line for sales data to determine insights, whether sales are increasing or decreasing at a particular time frame.
This way, the trend lines in Tableau helps to interpret the data trends, estimate the future scenarios, and define the relationship between the variables in the analysis.
| Want to become an expert in tableau? then enroll in "Tableau Certification Training" now! |
Trend Line Models
In Tableau, there are various types of trend lines classified depending on the model. They are as follows:
#1. Linear Trend Line
Linear trend lines are the best way to estimate a linear relationship in the data. The formula for the linear trend lines is as follows:
Y= b0+b1*XWhere X is an explanatory variable, Y is the response variable, b0 is the intercept of the line, and b1 is the slope.
The Linear trend line represents the simplest trend model estimating the relationship between the variables of whether b1 is increasing or decreasing at a steady rate and thus resembles a linear pattern.
#2. Logarithmic Trend Line
Logarithmic trend lines are used, when the rate of change between the variables increases or decreases rapidly. The formula for Logarithmic trend lines is as follows:
Y= b0+b1*ln(X)Here, ln(X) is the natural logarithm of X.
Since this quantity does not define negative values of X, any negative values of X have to be filtered before the trend line is analyzed. Logarithmic trend lines should be avoided in a case where a considerable set of marks includes negative values for a field in the column itself. Trend lines will create a report regarding the number of marks that are filtered before the estimation of the model.
#3. Exponential
In the exponential Trend line model, a response variable is converted by a natural logarithm before model estimation. The formula for the exponential trend line is as follows:
Y= exp(b0)* exp(b1*X)So, the values were plotted in the view are established by connecting several explanatory values is used to discover the value of ln(Y).
ln(Y)= b0 + b1 * XThen, the values were plotted. The exponential trend line model displays the following formula:
Y= b2 * exp(b1*X)Here, b2 represents the value of exp(b0). And no negative values are defined in this exponential trend line.
#4. Power Trend Line
Power trend lines are the curved lines that are used when the dependent variables increase at a predefined rate b1. The formula for power trend lines are as follows:
Y= b0*X^b1By the power model, the two variables are converted by a natural logarithm, before model estimation developing in the formula below:
ln(Y)= ln(b0) + b1 + ln(X)Then, the values are plotted in the trend lines. And no negative values are defined in this trend line. Those values that are less than 0 have to be filtered before the estimation of the model.
#5. Polynomial Trend Line
Polynomial trend lines are the curved lines that are used when dealing with variables that have fluctuating relations between variables. The formula for the Polynomial trend line is as follows:
Y= b0+b1*X+b2*X^2+b3*X^3+...Select the degree that lies between 2-8. When the polynomial degrees are high, it inflates the comparison between the data values. If the data increases quickly, the lower-order terms might have no variation when compared to higher-order terms, and it is also difficult to estimate the results accurately.
| Read these latest Tableau Interview Questions and Answers that help you grab high-paying jobs |

Trend Line Model Terminology
There are several values that appear when we see the relationship for the Trend line model. The below table describes all the terms as follows:
| Terminology | Description |
| Model formula | The model formula reflects on excluding factors from the model. |
| Number of modeled observations | It defines the no. of rows that are present in the view. |
| Number of filtered observations | It defines the no. of observations that are eliminated from the Trend line model. |
| Model degrees of freedom | It defines the no. of parameters is required to complete the model. The trend line model, such as Linear, exponential, and logarithmic trends, have a model degree of freedom II. The Polynomial trends include the model degree of freedom1 plus a degree of a polynomial. |
| Residual degree of freedom | It defines the no. of observations subtracts from the no. of parameters predicted in the model for a fixed model. |
| MSE (mean squared error) | It is the quantity of SSE that is divided by its degree of freedom. |
| SSE (sum squared error) | It is the difference between the predicted value and the observed value of the model. In ANOVA, the difference between the model and SSE of the model in that row. |
| Standard error | It defines the square root of the MSE of the full model. An estimate of the standard variability of the random error in the model formula. |
| R-Squared | It is the value of how the data fit the linear model. R-squared is the ratio of the variance of the unexplained variance, model’s error to the total variance of data. 1-i=1n(yi-yi)2 / i=1n(yi-y)2 When y-intercept is enforced to 0, R-squared is obtained using the below equation.1-i=1n(yi-yi)2 / i=1nyi2 |
| p-value | It defines the probability of F random variable with the degrees of freedom exceeds the F in a row of the analysis. |
| Analysis of Variance | It is the list of information for each factor in the trend model line. It is also known as ANOVA. |
| Value | The estimated value of the coefficient for the term. |
| p-value | The probability of observing the t-value that is larger in the magnitude of the true value of the coefficient is zero. So, a p-value of 0.05 gives 95% confidence that the true value is not zero. |
| StdErr | This error shrinks due to the quantity and quality of the information is used within the estimate growth. |
| t-value | The statistic used to test the null hypothesis that the true value of the coefficient is zero. |
| Do you know-- Top OpenSource Data visualization Tools |
How to Add the Trend Lines in Tableau?
When we add trend lines to a view, you can specify how we want to display them to present attractively. To add a trend line to a visualization, do the following steps:
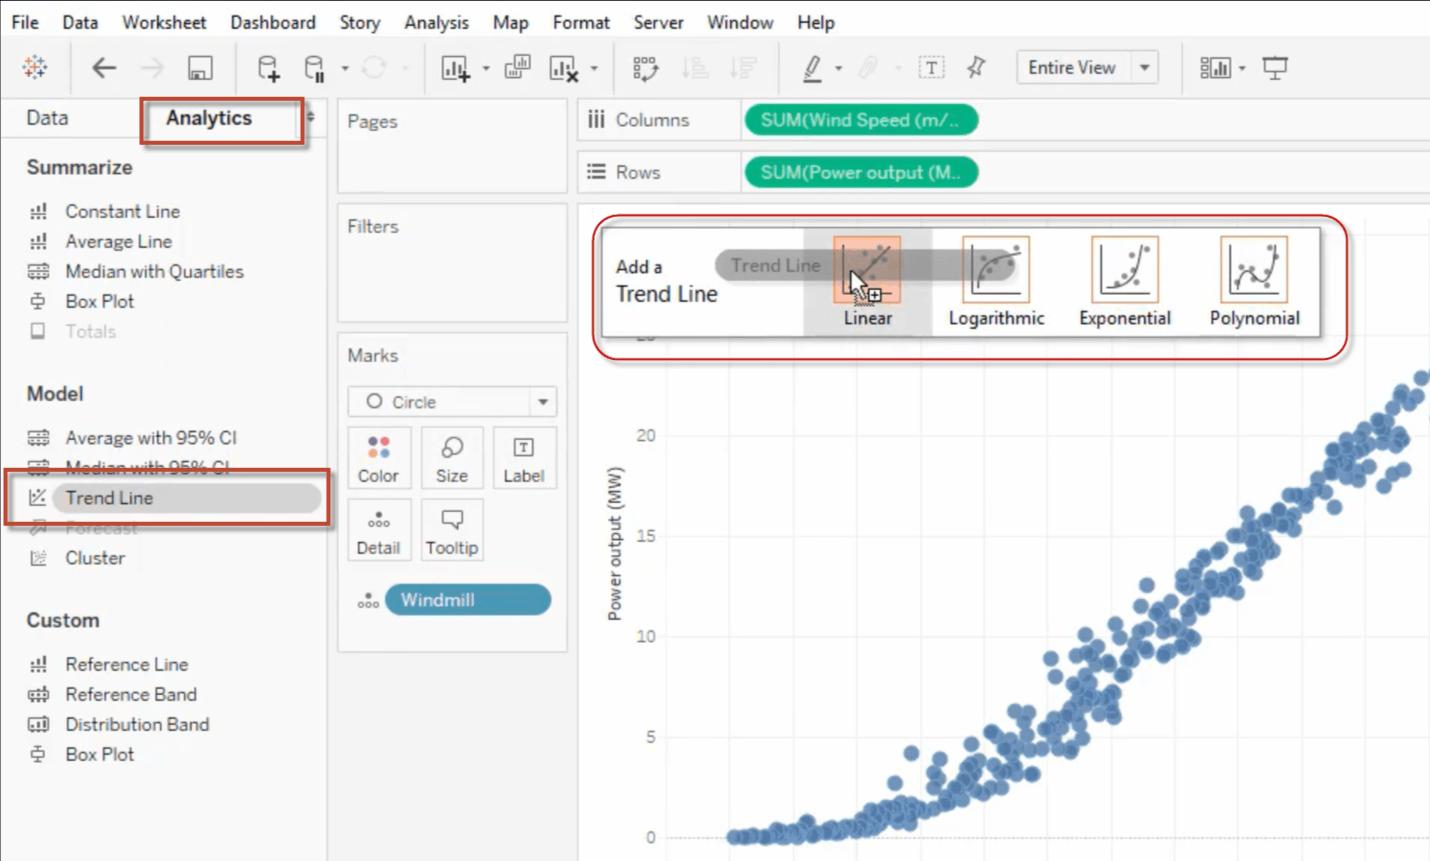
1. Click the Analytics pane. Drag the Trend Line in the list and drop it into one of the Trend line models.
2. After selecting the linear trend line, the trend lines appear as per the data. Drag and drop the required Dimension into the Worksheet to have a clear data analysis.
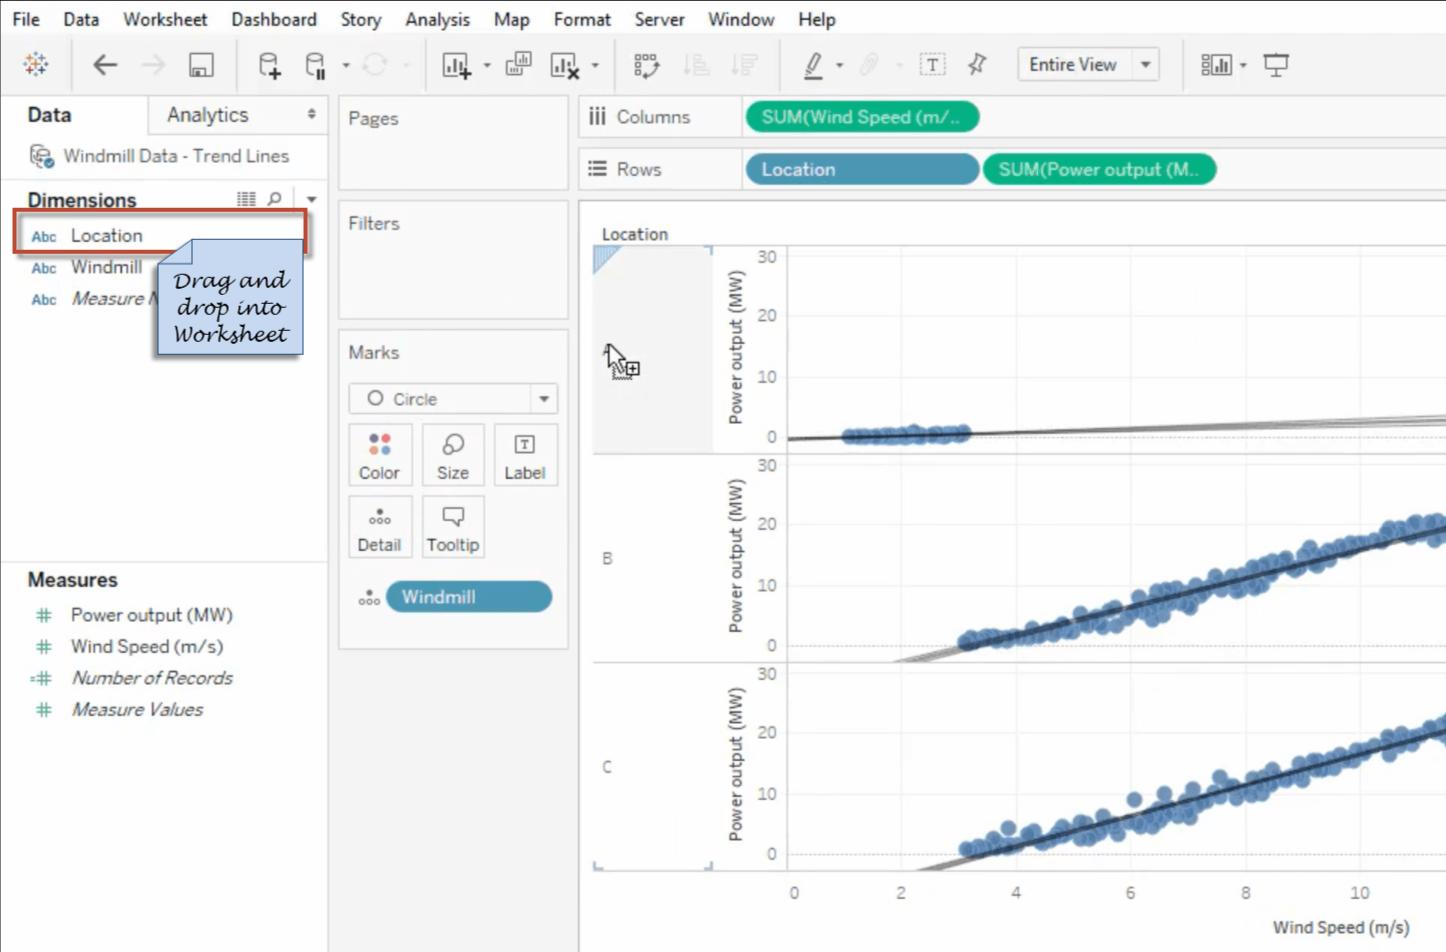
3. Each trend line can be color-coded to the data it represents perfect visualization.
We can not add the Trend line to a view that the Product Category dimension, which contains strings, is on the columns shelf and the profit measure on the row shelf. However, you can add a trend line to view the data over time
How to Edit the Trend Lines in Tableau?
Now, let’s see how to edit the trend line in Tableau. Tableau allows us to edit the added trend line to fit with the analysis.
To edit the trend, do the following:
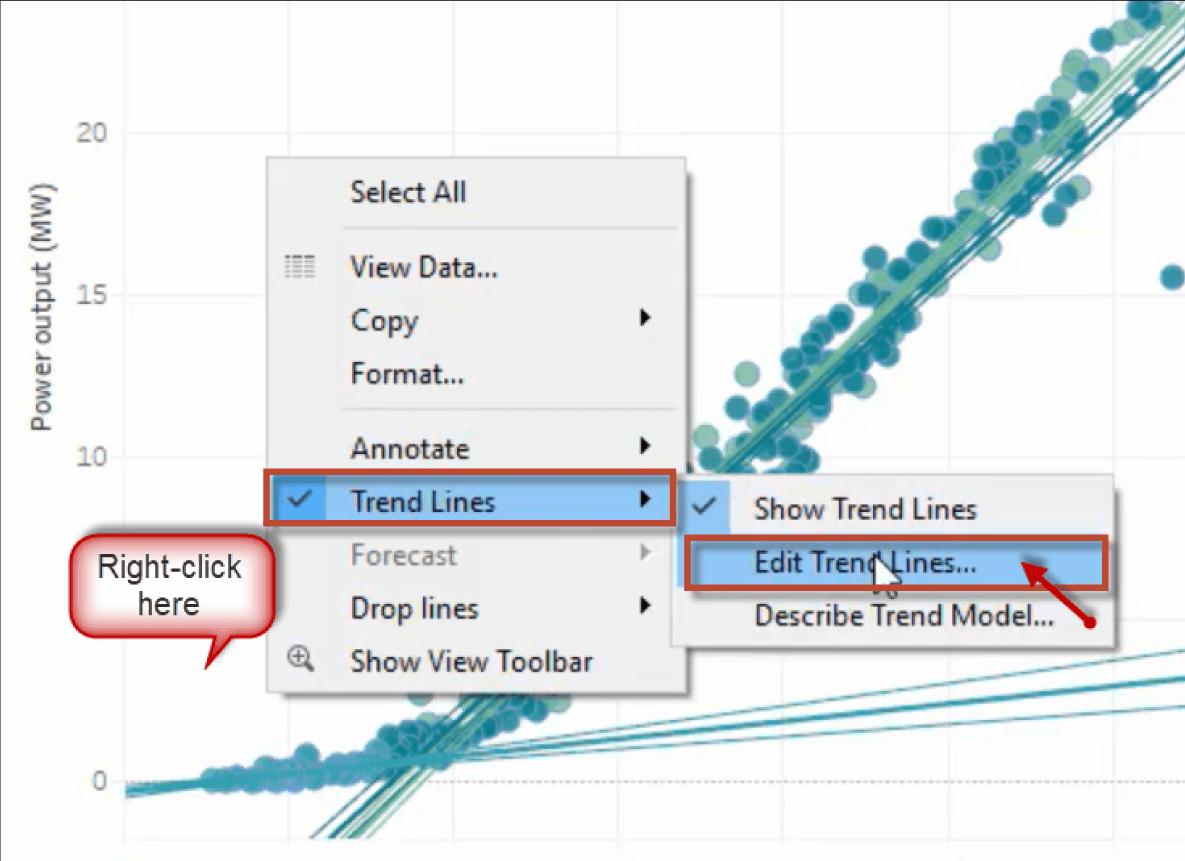
1. Right-click a trend line in the workspace, and Click Trend Lines, and then select ‘Edit Trend Lines’ in the list as shown in the figure.
2. A ‘Trend Lines Options’ window appears, In that, we can configure the following options to edit the Trend Lines.
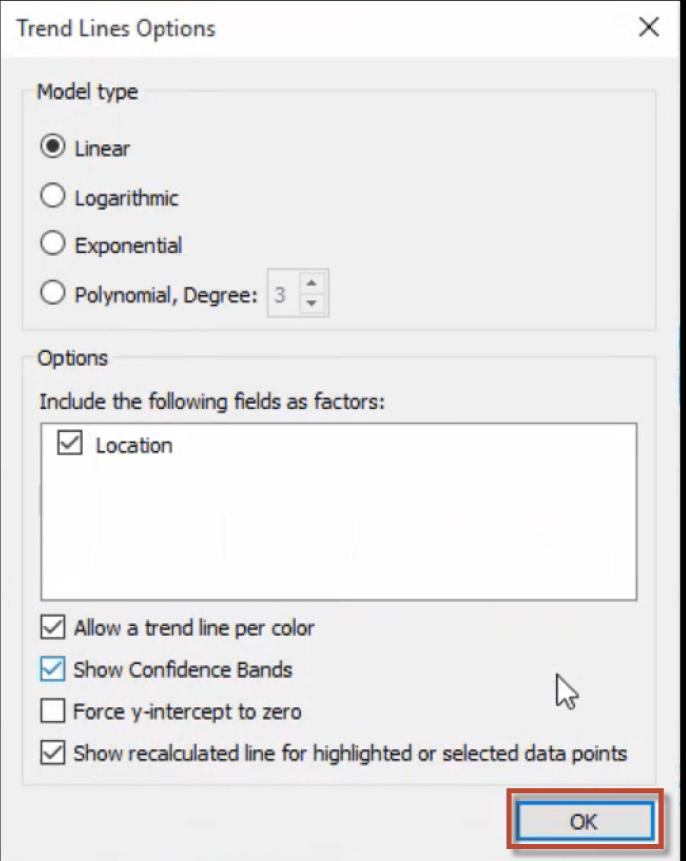
- Model type: It allows for editing the model type of the selected trend line.
- Include the following fields as factors: It enables us to choose the fields to use factors in the trend line model for perfect data visualization.
- Allow a trend line per color: It allows encoding color for the selected trend line in the view.
- Show Confidence Bands: The Confidence bands show upper and lower 95% confidence lines by default when you add trend lines. This option is not supported for the Exponential Trend line model.
- Force y-intercept to zero: It is used when we want the trend line to begin at zero. It enables only when both the Rows and Columns shelves contain continuous fields, as with a scatterplot.
- Show recalculated line for highlighted or selected data points: It is used when we choose or highlight the data in the visualization.
3. Using all the options, we can edit the trend lines as per the requirement to make the data for clear representation.
How to Remove the Trend Line in Tableau?
To remove a trend line from a visualization, drag it off the visualization area. To remove a particular trend, right-click at the Trend line and select the Remove option.
To remove the entire model of trend lines, Click Analytics, Select Trend lines and then disable the Show Trend Lines option.
Access Trend Line Significance
To view the significant information of any specific trend line in the worksheet, float the cursor to the trend line. It shows the details of the trend line, as shown in the figure.
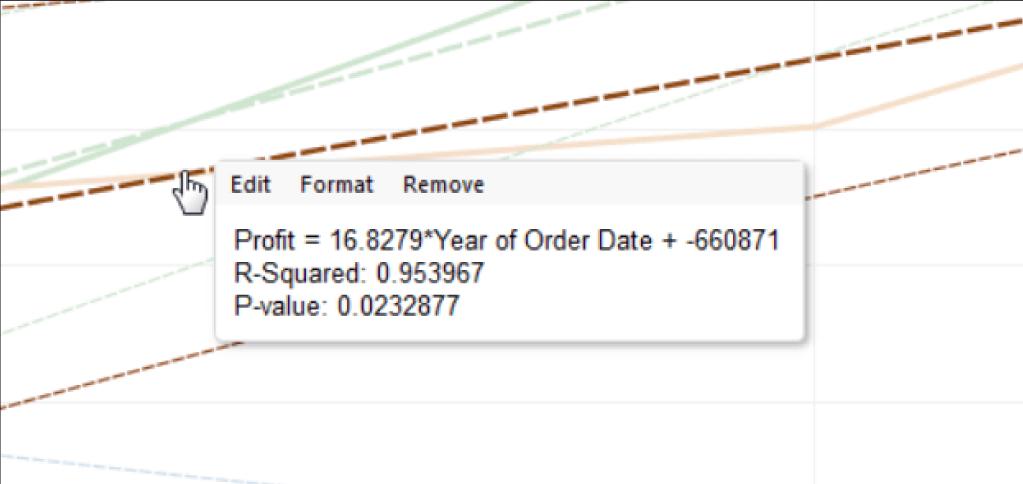
The first line represents the ‘Profit’ value and the ‘Year of Order Date’ as per the data given in the trend line.
The next line gives an R-Squared value; it is the ratio of variance as defined by the model, to variance within the data.
The Last line represents a P-value that is the probability of that equation present in the first line provides the random chance. If the p-value is small, then the model is more significant—the p-value with 0.05 or less than is usually considered as adequate.
Significance of Entire Model
The trend line is required to have a good model, that is the value of the quality of the model’s expectations. Also, we focus on the importance of every factor of the model. The following step provides a way to view these values.
-
Right-click in the worksheet, click ‘Trend Lines’, and select ‘Describe Trend Model’ in the list.
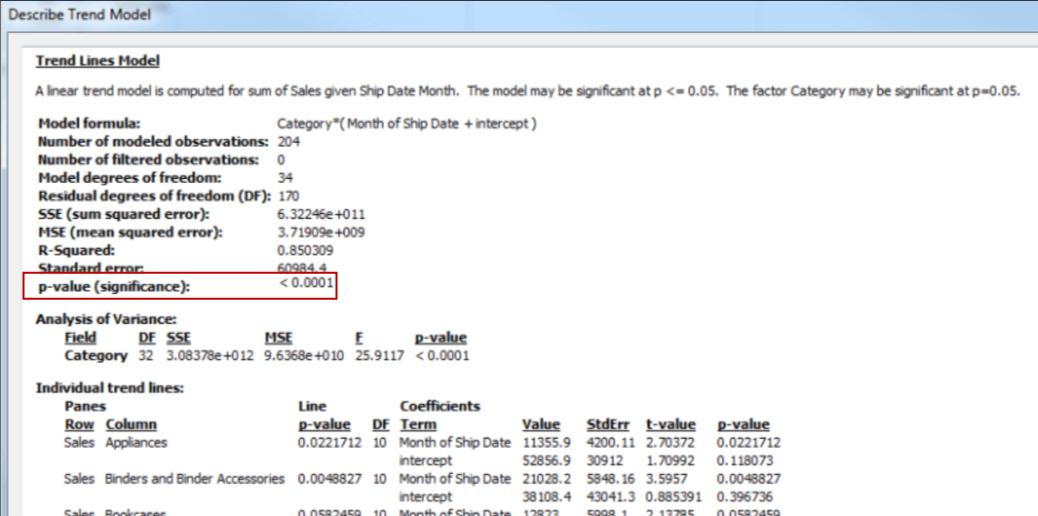
When executing the significance, the smaller p-value gives the more significance of the model. It can find the model which has a statistical significance yet that includes a single trend line but does not provide a complete significance.
When a p-value is less, it represents the variation in an unexplained variance of models with or without relevant measure is the result of a random possibility. This p-value compares the entire model fit to the model fit determines the average of the data. It accesses the explanatory trend line model of a quantitative term in the formula, which can be Linear, Logarithmic, Polynomial, or Exponential with the fixed factor. We can access significance by using a ‘95% confidence’ method.
Significance of Category Factors
With the use of an ANOVA table, every field is termed as a factor in the trend line model that is listed. In the given figure, a p-value represents how the field is added to the significance of an entire model. The values displayed in each field are defined and is compared with a model that is not included in the question.
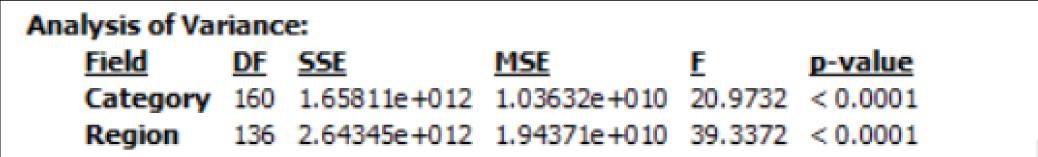
For the ANOVA model, the trend lines were described using the mathematical form:
Y= factor 1 * factor 2 * ....factor N * f(X) + eHere, Y is the response variable that corresponds to a predicted value. X is an explanatory variable, and e is a random error. And the * is a specific matrix that corresponds to the category fields works as a multiplication operator to make the two matrices with the same no. of rows and returns the new matrix. For example, if factor1 and factor2 have three variables, then nine variables are produced in the trend line model formula.
Trend Line Assumptions
When a trend line is created in Tableau, the calculations are based on certain assumptions. Every trend line is created by having some computations that depend upon the following Trend line assumptions:
-
The model is a valid functional calculation of data that generates the process.
-
The error in the model is average-zero and unassociated with the independent variable.
-
The errors should have constant variance and are uncorrelated with one another.
-
The explanatory variables are not the exact linear variables of one another.
Conclusion
On wrapping up, the trend lines will be the best fit in advance with a few clicks and make the decisions more simple with no scripts and no coding required. In this article, we have learned all the insights of the Trend Lines in Tableau such as How to add, edit, and remove the trend line along with the terminologies used in the Trend Lines, different types of Trend Lines model, Significance of the model, and few assumptions to create a trend line. I hope you find relevant information.
 On-Job Support Service
Online Work Support for your on-job roles.

Our work-support plans provide precise options as per your project tasks. Whether you are a newbie or an experienced professional seeking assistance in completing project tasks, we are here with the following plans to meet your custom needs:
- Pay Per Hour
- Pay Per Week
- Monthly
| Name | Dates | |
|---|---|---|
| Tableau Training | Aug 04 to Aug 19 | View Details |
| Tableau Training | Aug 08 to Aug 23 | View Details |
| Tableau Training | Aug 11 to Aug 26 | View Details |
| Tableau Training | Aug 15 to Aug 30 | View Details |

Keerthana Jonnalagadda working as a Content Writer at Mindmajix Technologies Inc. She writes on emerging IT technology-related topics and likes to share good quality content through her writings. You can reach her through LinkedIn.


