- Power BI Slicers - A Definitive Guide
- How to Download and Install Power BI Desktop
- How to Share Reports in Power BI for Mobile
- Power BI Architecture: A Complete Tutorial with Diagram
- Power BI Career Opportunities
- What are the Components of Power BI?
- DAX In Power BI - Learn Power BI DAX Basics
- Power BI Tutorial - Power BI Desktop Tutorial
- Power BI Services and Benefits
- Power BI Visuals List and Chart Types
- Power Apps Interview Questions and Answers
- Power Apps Tutorial
- What is Power BI? The Definitive Guide
- What is Power Apps?
- Top 15 Data Visualization Tools
- Power BI Projects and Use Cases
- Power Pivot vs Power Query
- Power BI Vs QlikView
- Power BI Heatmap
- Power BI Gateway - Power BI Gateway Architecture
- Power BI vs SSRS - What are the Differences
- Power BI Dashboards vs Reports - Which is better?
Many top organizations today rely on Microsoft Power BI to get better business insights. Also, Microsoft Power BI has earned its place in Gartner’s 2015 Magic Quadrant as a leader in analytics and business intelligence platforms.
Moreover, according to Polaris Market Research, the Business Intelligence market is projected to reach 78.89 billion USD globally in 2034. These insights prove that learning Power BI is worthwhile.
These insights prove that learning Power BI is worthwhile. Learning these Power BI interview questions will help you crack Power BI interviews and help you build a promising career in the data analytics and visualization domain.
Let’s get started!
Table of Contents
- For Freshers
- Intermediate Level
- For Experienced
- Power BI DAX
- Scenario-Based
- TCS Interview Questions
- Cognizant Interview Questions
- Interview Tips
- Job Responsibilities
- FAQs
- Conclusion
Power BI Interview Questions and Answers For Freshers
Let's start with some commonly asked Power BI interview questions and answers for beginners.
1. What is Power BI? And why is it used for?
Power BI is a Business Analytics solution from Microsoft that helps you visualize business data from hundreds of data sources and share insights across your organization. It is a cloud-based Self-Service BI tool that includes applications, connectors, and software services for organizing raw data into informative content.
The most prominent uses of Power BI are:
- Allows real-time dashboard updates.
- Prebuilt dashboards and reports for Saas solutions
- Provides a secure and reliable connection to your data in the cloud or on-premises
- Offers a hybrid configuration, quick deployment, and a secure environment.
- Explore data using natural language queries.
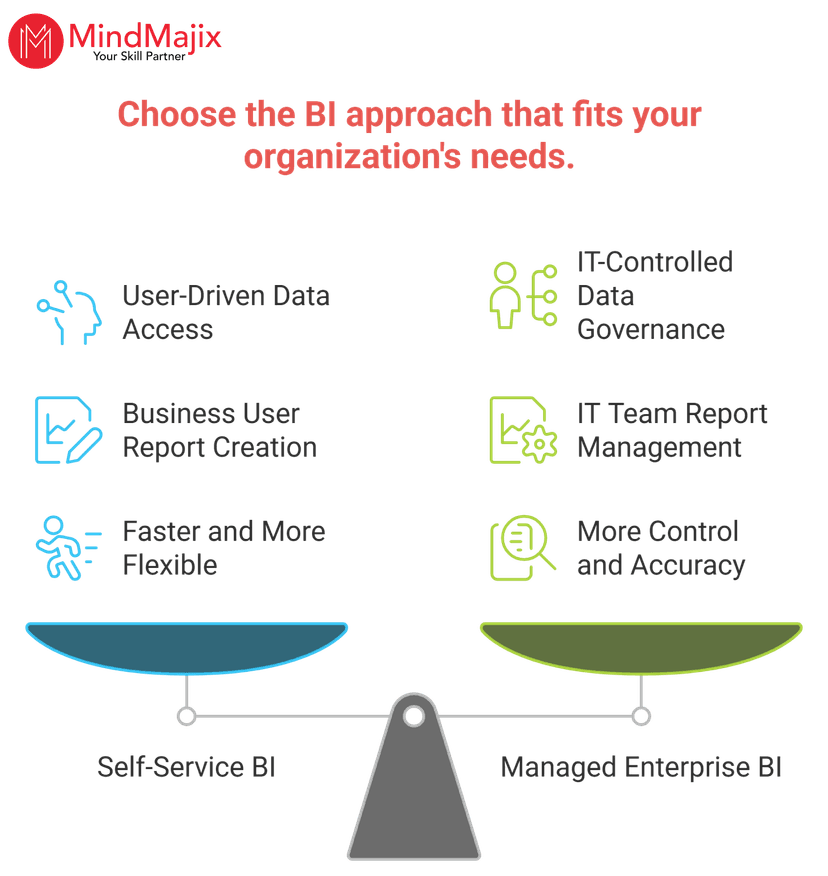
2. What are the main differences between self-service BI and Managed Enterprise BI?
| Managed Enterprise BI | Self-Service BI |
| Here, data flows from many sources, and there is no order to how companies ingest and manage it. | Enables companies to ingest data seamlessly from any data source. |
| There are time constraints and insufficient information when analyzing data. | Analyzing data is easy. |
| Complex programming skills are required to generate reports. | Users could generate actionable, intuitive dashboards almost instantaneously without writing complex code. |
| Companies are unable to run their operations effectively because they cannot report on, analyze, and derive valuable insights from data. | With data ingestion falling into order, companies can process data and conduct business operations with ease. |
3. How does Power BI work?
The primary purpose of Power BI is to scale business growth by putting information together more efficiently. It brings your company data to the forefront in a seamless, comprehensive interface. Employees and team members come forward in a streamlined fashion with access to identical information translated into simplified reports, charts, diagrams, and more. Power BI improves your operational efficiency.
4. In what formats is Power BI available?
- Power BI Desktop: for desktop computers.
- Power BI service: an online SaaS (Software as a Service)
- Mobile Power BI apps: for iOS and Android devices.

5. Describe the building blocks of Power BI.
The building blocks of Power BI are:
- Visualizations - A visual representation of data, like a chart or map.

- Data Sets - A collection of data that Power BI uses to create visualizations.
- Reports - A collection of visualizations that appear together on one or more pages.

- Dashboard - A Power BI dashboard collects visuals from a single page that you can share with others. Often, it’s a selected group of visuals that provide quick insight into the data or story that you’re trying to present.

- Tiles - It’s a single visualization on a report or a dashboard. It’s a rectangular box that contains a single visual.

6. What are the major components of Power BI? And what do they do?
These are various Power BI components.
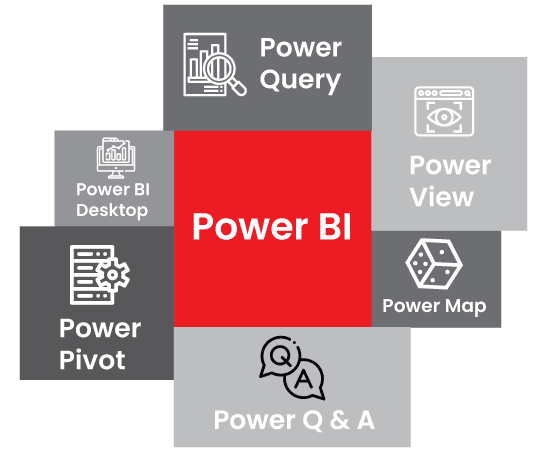
- Power Query - Data mash-up and transformation tool.
- Power Pivot - In-memory tabular data-modeling tool.
- Power View - Data visualization tool.
- Power Map - 3D Geo-Spatial data visualization tool.
- Power BI Q&A - Natural Language Question and Answering Engine
- Power BI Desktop - A powerful companion development tool for Power BI.
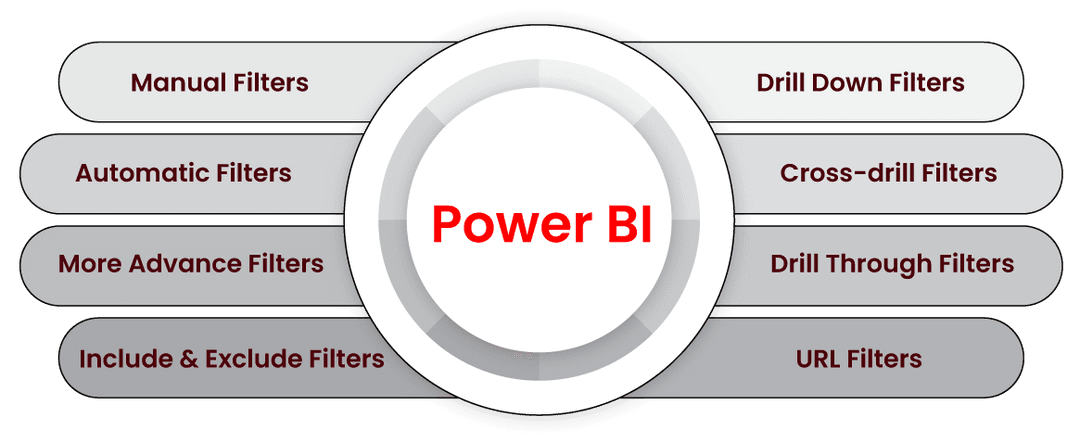
7. Name some of the popular types of filters available in Power BI?

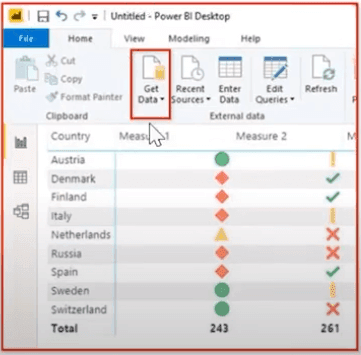
8. What is the use of the “Get Data” icon in Power BI?
When users in Power BI click the “Get Data” icon, a drop-down menu displays all available data sources. Data can be directly ingested from sources such as Excel, XML, PDF, JSON, CSV, and SharePoint folder databases and formats such as SQL, SQL Server Analysis Services, IBM, Access, Oracle, MySQL, and much more.
9. How to create and manage relationships in Power BI Desktop?
As the name suggests, relationships in Power BI define connections between two or more tables. To analyze multiple tables, relationships are used.
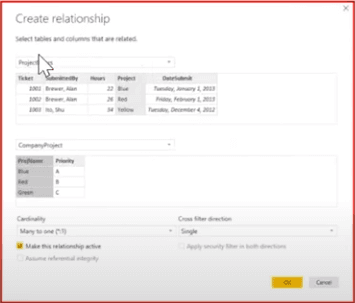
To create and manage relationships in Power BI Desktop:
- On the Home tab, select Manage Relationships > New.
- In the Create relationship dialogue box, select a table from the first table drop-down list. Select the column you want to use in the relationship.
- In the second table drop-down list, select the other table you want in the relationship. Select the other column you want to use, and then choose OK.
10. Differentiate Power BI vs Excel
| Parameter | Power BI | Excel |
| Tabular reports | Power BI is not so handy for tabular-style reports | Excel is better at handling tabular-style reports. |
| Duplicate Table | Cannot display duplicated tables | Allows the display of duplicated tables |
| Reports | Offers beautiful, personalized, and interactive reports | Doesn’t offer advanced cross-filtering between charts. |
| Cross filtering | Offers advanced features in cross-filtering between charts. | Doesn’t offer advanced cross-filtering between charts. |
| Analytics | Offers simple analytics | Offers high-level analytics |
| Applications | Ideal for dashboards, KPIs, alerts, and visualizations, including analysing your data visually. | Excel does have some new charts now, and they can’t connect to the data model. |
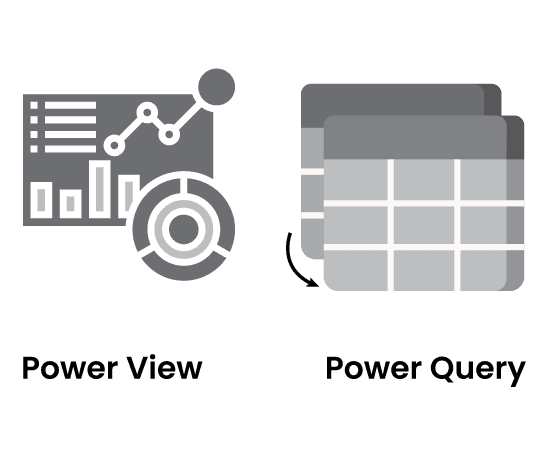
11. Are Power View and Power Query the same?
Power View can be used to download data to Excel and perform useful transformations.
Example: Filter, merge multiple sources, calculate, etc.
Power View enables you to present the data in reports.
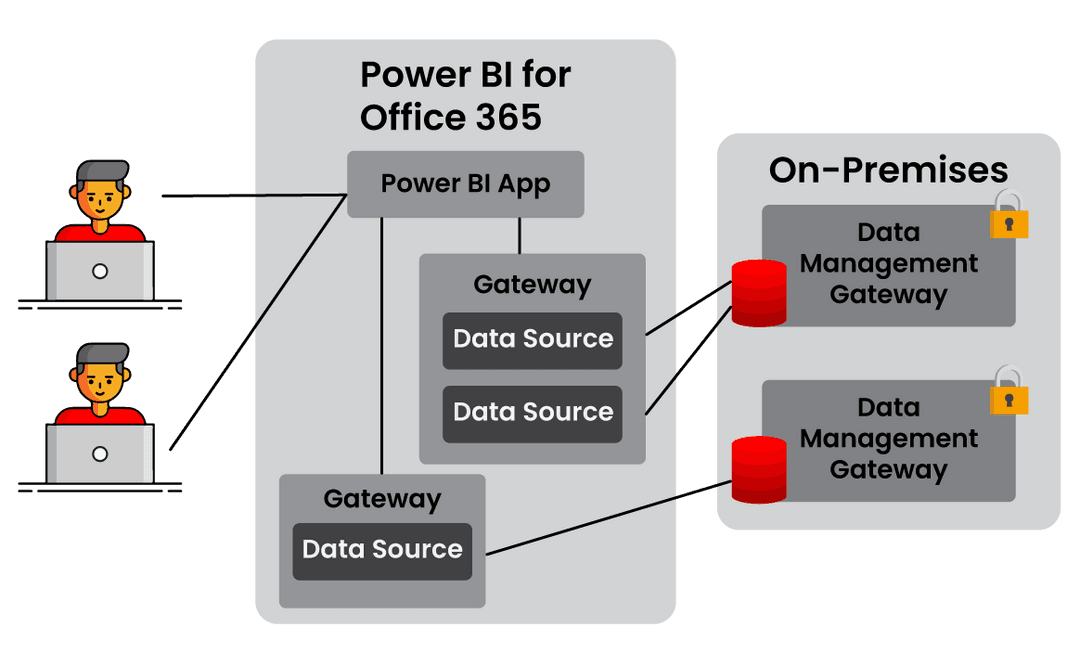
12. Can you tell me what the difference is between Power BI Personal Gateway and Data Management Gateway?
The Power BI Personal Gateway is used for reports deployed in Power BI. On the other hand, Data Management is an app that installs a gateway on source data machines to deploy reports to SharePoint and schedule automatic refreshes.
13. Explain DAX.
DAX stands for Data Analysis Expressions. It is a collection of operators, functions, and constants used to calculate formulas and return values. In other words, it helps you create new info from data you already have.
14. SUM() vs SUMX(): What is the difference between the two DAX functions?
The SUM function (Sum()) aggregates the data columns, but the SUMX function (SumX()) lets you filter the data you are adding.
SUMX(Table, Expression), where the table contains the rows for calculation. Expression is a calculation evaluated on each row of the table.
15. List the benefits of using variables in DAX.
- Improve performance
- Improve readability
- Reduce complexity
- Simplify debugging
16. What is the Power Map?
Power BI is a business intelligence and Analytics tool for non-technical and technical users to manage, analyze, visualize and share data with others. One of its key features is visualization - that is, presenting data and insights using appealing visuals. Among the visuals available in Power BI are maps.
17. How to create and use Maps in Power BI?
There are 4 types of core or built-in map visuals:
- Map (Basic)
- Filled Map
- Shape Map
- ArcGIS Maps.
18. Explain the filled map in Power BI?
Power BI utilizes two built-in map charts: a map and a filled map. A filled map shows data points with geospatial areas rather than points on a map. Areas can be continents, countries, states, or cities. Working with a filled map, however, is not as easy or as convenient as working with a map chart.
19. What data sources can you connect to Power BI?
The Power BI data sources are extensive and are divided as follows:
Files: Data can be imported from Power BI Desktop files (.pbix), Excel (.xlsx, xlsx), and Comma-Separated Values (.csv).
Content Packs: A collection of related files or documents stored together. There are two types of content packs in Power BI: those from service providers, such as Google Analytics, Salesforce, or Marketo, and those created and shared by other users within the organization.
Connectors: To connect to databases and other datasets, including Azure SQL Database, Azure SQL Data Warehouse, and SQL Server Analysis Services tabular data.
| Check out Top Power BI Projects Ideas For Practice |
20. Explain Power BI Desktop.
Power BI Desktop is a free desktop application that you can install on your computer. It works seamlessly with the Power BI service, providing advanced data modeling, data shaping, exploration, and report creation with highly interactive visualizations. It enables users to save their work to a file or publish their reports and data directly to your Power BI site for sharing with others.
Below are the distinct Excel BI add-ons.
- Power Query to find, edit, and load external data
- Power View for designing interactive and visual reports
- PowerPivot to analyze data modeling
- Power Map for displaying insights in a 3D Map.
21. Is Power BI free to use?
Power BI is available in two versions: Power BI Free and Power BI Pro.
Users can use Power BI for free. However, the Power BI Pro subscription provides more from the Microsoft Store. The subscription offers enhanced versions of various features available in the free Power BI account. Most business users use the subscribed account because it offers more daily data refreshes and additional features compared to the free version.
22. How to perform query tasks in Power BI Desktop?
Power Query is available in Power BI Desktop through the Power Query Editor. To open the Power Query Editor, select Edit Queries from the Power BI Desktop Home tab.
The ribbon in the Power Query Editor consists of five tabs - Home, Transform, Add Column, View, and Help.
23. Can you store data in Power BI? If so, where does it get stored?
Power BI stores data in several locations. All the data stays secure through measures such as encryption and password protection. It mainly depends on the channel that you used to import the data. Data is stored in a few places, but it all boils down to two main locations: the cloud and your desktop.
24. How do you create a group in Power BI?
To group in Power BI, select the fields you want to group, then right-click them to open the context menu. Please select the Group option from the menu.
Once you click on the Group option, Power BI will automatically group those items, as shown below. That's it; we did the grouping. If you look closely, Group has replaced the legend section, and the color is now in the details section.
25. What is the current version of Power BI?
Power BI Desktop 2.153.1206.0, released in May 2026, is the latest major release.
26. Explain what M language is in Power BI?
M is a query formula language used in Power BI Query Editor to prepare data before loading it into the Power BI model.
Power Query works with Excel, Analysis Services, and Power BI workbooks. Its core functionality is to filter and combine, i.e., to mash up data from one or more rich collections of supported data sources. Any such data mashup is expressed using Power Query M Formula Language.
27. Can you explain a few ways in which a Power Query can transform the data?
Power Query is available through Get & Transform in Excel 2016 or Power Pivot.
28. Which data sets can be used to create dashboards with streaming data tiles?
- Streaming datasets
- Hybrid Datasets
29. What are the different views of Power BI?
In Power BI, we have the following views:
- Data View: This tool lets you view, explore, and curate data tables in a dataset. Unlike the Power Query Editor, the data view lets you see the data after it has been loaded into the model.
- Report View: The report view displays all tables and their corresponding relationships. This allows us to divide these difficult models into simplified diagrams or to set their properties at once.
- Relationship View: This view displays tables in an interactive format to simplify data analysis. We can create an “n” number of reports, build visualizations, merge them, and apply such functionality.
30. What do you know about Row Level Security? And how do you implement it?
Row-level security restricts the data that users view and access based on filters. To configure row-level security, users can define rules and roles within Power BI Desktop and publish them to the Power BI Service. Also, the username() function can restrict data in the table to the current user.
However, to enable row-level security, a Power BI Pro subscription is required, and Excel sheets can be used when converted to the .pbix format.
The following are the ways to implement Row Level Security in Power BI:
- Define roles and rules in Power BI Desktop
- Validate the roles within Power BI Desktop
- Manage security on your model
- Validating the role within the Power BI service.
31. Explain Bidirectional Cross-Filtering in Power BI?
One of the most important features of Power BI is Bidirectional cross-filtering. This feature allows you to apply filters on both sides of a table relationship, using right-to-left and left-to-right options for their calculations. Through this, modelers can understand exactly how specific relationships can work across multiple contexts.
32. Name some top features of Power BI
- Quick Insights
- Acquiring data
- Real-time information
- Natural language questions
- Content the way you want
- Quick decisions
- View reports on the Go
- Freedom for Integration
- Sharing
33. Explain Power BI Query Editor.
Power BI Query Editor transforms or edits data files before they are loaded. The Query Editor is an intermediate data container where you can transform data by selecting rows and columns, splitting rows and columns, pivoting and unpivoting columns, etc. Power BI Query Editor includes four tabs:
- Home: It imports the data from the query editor into a "New Query" Group. The Home tab uses the "Parameter" group to create and manage parameters. It handles columns, sorts groups, and reduces rows.
- Transform: The structured column group provides options for working with the nested group. The "Transform" tab changes column data types, replaces values, renames columns, and fixes errors in "Any Column Group."
- View: It displays and hides the query editor settings. From the "View" tab, the Advanced editor window can be opened to view and edit the query code.
- Add Columns: We use the "Add Custom Column" option to create a new column using a DAX formula. The "Conditional Column" adds a column based on the values of another column.
34. Describe Power BI Designer.
Power BI is a stand-alone application for creating and uploading Power BI reports; it does not require Excel. It is the combination of Power Pivot, Power View, and Power Query.
35. What are the different types of gateways available in Power BI? Why would you use them?
The Gateway acts as an extension between Azure cloud administration and on-premises data sources. There are three major types of Gateways listed as follows:
- On-premises data gateway: Allows multiple users to connect to various on-premises data sources. You can use an on-premises data gateway with all supported services with a single gateway installation. For complex scenarios, this gateway is best suited.
- On-premises data gateway (personal mode): This data gateway allows one user to connect to sources that can’t be shared with others. This gateway is best suited to scenarios in which you only create reports and don’t need to share any data sources with others.
- The virtual network data gateway: This gateway allows multiple users to connect to various data sources secured by virtual networks. For complex scenarios in which multiple people access multiple data sources, this data gateway is highly preferred.
36. Can we create geographic maps using Power BI?
Yes, Power BI can display geographical visualizations. That’s why some kind of location data is needed.
For example, state, country, or latitude and longitude.
37. Explain z-order in Power BI.
Z-order is a design strategy for arranging visuals above or below shapes. It can also be defined as a method applied when reports consist of multiple elements. Moreover, this can be used to refresh the display when items in a report change.
38. What is the primary requirement for a table to be used in Power BI?
In Power BI, the primary requirement for the table is that it contains unique rows. It must also contain location data, which can be in a Latitude/Longitude pair.
You can use address fields instead, such as street, city, etc., which Bing can geolocate.
39. What is the difference between Power BI, Power Query, and Power Pivot?
| Power BI | Power Query | Power Pivot |
| Business Intelligence tool | Import and shape data | Data modeling and calculations |
| M and DAX languages are supported | M language supported | DAX language supported |
| Incredible visualization options | Easy-to-use interface | Handles millions of rows of data. |
| Simple built-in interactive options | Powerful tools to import and clean data | Modeling tools for efficient data storage and analysis |
| Powerful DAX calculations | All Excel users can benefit from this tool | Powerful DAX calculations going beyond standard Excel |
40. Name some important tools of Power BI.
- Power BI Desktop
- Power BI Service
- Power BI Data Gateway
- Power BI Report Server
- Power BI Mobile Apps
41. Is there any process for refreshing Power BI reports uploaded to the cloud?
Of course, Power BI reports can be refreshed with Data Management Gateway and Power BI Personal Gateway.
42. What are content packs in Power BI? And why would you use one?
In Power BI, content packs are used to share objects, such as reports, dashboards, or datasets, with individuals within your organization. Sharing takes place on the Power BI website and can be shared with multiple users. No one can change the original content in the content pack. Also, users have “read-only” access to the Power BI content shared with them.
43. How is data security implemented in Power BI?
- Power BI applies models with Row-Level Security.
- Dynamic security involves using USERNAME functions in definitions.
- A DAX expression can be applied to tables, filtering their rows at query time.
- A table is typically created in the model that relates to specific dimensions and roles.
44. What do you know about many-to-many relationships in Power BI?
Many-to-many relationships involve a bridge or junction table that reflects the combinations of two dimensions. Either all possible combinations or those combinations that have occurred.
A relationship with many-to-many cardinality in Power BI is composed of three features:
- Composite models: Allows a report to have two or more data connections, including DirectQuery connections or Import. With composite models, you can establish relationships with a many-many cardinality between tables.
- Relationships with a many-many cardinality: This approach removes unique values in tables.
- Storage mode: You can specify which visuals require a query to back-end data sources. This feature improves performance and reduces back-end load.
45. What are the key differences between a Power BI dataset, a report, and a dashboard?
| Dataset | Report | Dashboard |
| A series of Power Query queries that have been shaped in a DAX model. | A series of visualizations, filters, and static elements on a canvas. | A way of pulling visualizations together from several reports. |
| A Power BI dataset can have many data sources. | Each report can have multiple sheets. | A Power BI dashboard is a single page, often called a canvas, that uses visualizations to tell a story. |
| A data set can have one report, and a report can have one data set. | The data set and your report are going to have a one-to-one relationship. | A dashboard is a tool for pinning visuals from different reports and other sources of data. |
- Filter: It thoroughly filters the visual/tile based on the filter selection of another variable.
- Highlight: Highlights only the related elements on the visual
- None: Ignores the filter selection from another tile/visual.
47. How can you convert SSRS to Power BI?
The following are ways to integrate SSRS with Power BI:
- SSRS report items, such as charts, can be pinned to Power BI dashboards.
- By clicking the tile option in Power BI dashboards, users are taken to the SSRS reports.
- To keep the dashboard tile refreshed, a subscription is created.
- Power BI reports will be published to the SSRS portal.
48. What is the Time Intelligence function?
It is a function that allows data to be manipulated using periods.
Now that you have understood the basics of the Power BI platform. Next, we will move on to learning the advanced Power BI concepts.
Top Power BI Interview Questions For Intermediate Candidates
These interview questions cover the advanced Power BI concepts, which will help you enhance your Power BI expertise.
49. What are the Parts of Microsoft's Self-Service Business Intelligence Solutions?
Microsoft Self-Service BI has two parts:
- Excel BI Toolkit: It allows users to create reports interactively by importing data from various sources and modeling it according to requirements.
- Power BI: It is an online solution that empowers users to share interactive reports and queries that you have created with the Excel BI Toolkit.
50. What is the difference between Power BI and Power BI Pro?
Power BI offers distinct kinds of features to help you get started in searching for data in a completely new way. Power BI Pro, on the other hand, offers additional features such as data scheduling, live data sources, storage capacity, full interactivity, and more.
51. Define Excel BI Toolkit.
Excel BI Toolkit allows users to create an interactive report by importing data from a wide range of sources and modeling data according to requirements.
52. What is the Cost of Power BI?
Both Power BI Desktop and Power BI are free. For Power BI Pro, users have to pay $9.99 per month after a 60-day free trial.
53. What are the basics needed for using Power BI?
To use Power BI, you need to have a web browser and a work email address.
Work email addresses ending in .mil and .gov are not supported currently.
54. What is the need for signing up with a work email?
Power BI does not support email addresses from telecommunications providers or consumer email services; thus, you need to sign up with a work email.
55. Name the work email addresses that are currently supported?
Work email addresses ending in .org and .edu are currently supported.
56. Is there any Power BI support available for mobile devices?
Yes, Power BI supports mobile devices. It consists of apps for iOS devices, Windows 10 devices, and Android smartphones. You can install Power BI apps from the following app stores:
- Google Play
- Apple Store
- Windows Store
57. What is Visualization?
Visualization is the process of representing data in pictorial form, such as tables, graphs, or charts, based on specific requirements.
58. What is a Report?
A report is a Power BI feature that presents visualized data from a single dataset. A report can have multiple pages of visualization.
59. What is Power Pivot, and what is the filter written in Power BI?
Power Pivot is an in-memory component that enables the storage of compressed data. It is used to build data models and relationships, create formulas, and calculate columns from different resources.
Filters are applicable in:
- Visualization level
- Report Level
- Page-Level
60. What data sources can Power BI connect to?
The following data sources support DirectQuery in Power BI are as follows:
- Amazon Redshift
- Azure Data Explorer
- AtScale (Beta)
- Azure SQL Database
- Azure HDInsight Spark
- Google BigQuery
- Azure SQL Data Warehouse
- HDInsight Interactive Query.
61. Why do we need BI?
You can take data and create reports at the click of a button. You can take data and create reports with a button click. It helps attract new customers to the service and monitor existing customers. You can keep track of information and set your goals accordingly. In general, building an ETL solution (Extraction, Transformation, and Loading) ultimately helps to make better decisions. The ROI is very high. It helps turn unwanted data into valuable information.
62. Does Power BI store data?
Datasets are the data sources that are uploaded or connected to databases. These sources include Excel workbooks and Power BI Desktop files. The following are also included in your data capacity. On-premises Reporting Services visualizations are pinned to a Power BI dashboard.
63. What must be installed to use Power BI?
To use the Power BI service for free, you need a work email and a web browser. With this, you can explore data as well as create reports in Power BI Desktop. The mobile app can be downloaded from the following stores:
Google Play, App Store, and Windows Store.
64. How can one get started with Power BI?
There are some resources to get assistance and get started with Power BI. They are as follows:
- Webinars
- Power BI Blog
- You can get started with an article on Power BI
- You can get started with a video on YouTube
- Last but not least, joining a related community and getting answers.
65. What is SSBI?
SSBI stands for Self-Service Business Intelligence. It can also be termed as accessing data analytics to empower business users to divide, clean, and interpret data. SSBI has made it easy for end-users to access their data and create a variety of visuals to gain useful business insights. Anyone with basic data knowledge can build reports to create spontaneous, shareable dashboards.
66. What is a Dashboard?
The dashboard visualizes strategic data from one or more reports at a glance.
67. What is the CORR function, and when is it used?
CORR is a correlation function that measures the relationship between two variables, ranging from -1 to 1.
68. What are the advantages of Power BI?
Here are the main advantages of Power BI
- Power BI integrates well with the existing application
- It contains rich and personalized Dashboards.
- publishing reports in a secure way
- Quick access to data means there are no speed or memory issues.
69. What are the data destinations for Power Queries?
There are two destinations for the output we get from Power Query:
- Load to a table in a worksheet
- Load to the Excel Data Model.
70. What are the different connectivity modes in Power BI?
- SQL Server Import: SQL Server Import is the default and most general connectivity type utilized in Power BI. It enables you to use all of its capabilities.
- Direct Query: The DirectQuery connection is available for specific data sources. In this type of Connectivity, Power BI will only save the metadata of inherent and actual data.
- Live Connection: This type of Connectivity does not store the data in the Power BI model. All interactions with the report through the live connection query the available analysis service model.
71. What is the data source filter?
A data source filter is a parameter used to filter data before it is loaded into machines.
72. What are the different products in the Power BI family?
Below are different Power BI services/products:
- Power BI Desktop
- Power BI Services
- Power BI Mobile
- Power BI Gateway
- Power BI Premium
- Power BI Report Server
- Power BI Embedded.
73. What is Power View?
Power View is a data visualization technology that lets you create interactive graphs, charts, maps, and other visuals to bring your data to life. It is available in Excel, SQL Server, SharePoint, and Power BI.
74. Which language is used in Power Query?
A new programming language for Power Query is called M-Code. It is easy to use and similar to other languages. M-code is a case-sensitive language.
75. How to import the data into the Power BI desktop?
Go to Get Data Sources, select the required sources (Excel, SQL, CSV), and then load them. Click on the Data view to view that data.
To choose the table, click the fields, then pick a visualization to generate a report.
76. Which datasets are used to create a dashboard with streaming data tiles?
- Streaming datasets (we need to have data that is cached in memory before we use streaming data sets)
- Hybrid Datasets
77. How is dynamic filtering in Power BI performed?
Dynamic Filtering in Power BI is done by the following steps:
- Once all the data is set up, publish the detailed report to Power BI
- Publish it to the Group Work Space
- Create Filter Link
- Create a DAX calculated Column
- Public Overview Report.
78. What is the procedure to buy Power BI Pro?
Power BI license can be purchased at powerbi.com. However, you can also get assistance from Microsoft partners to help with Power BI implementation.
79. Is the Power BI service accessible on-premises?
The user cannot avail of the service as an internal or private cloud service. However, with Power BI and Power BI Desktop, users can securely connect to their on-premises data sources.
80. Which is the language used to calculate column/calculated field in Power Pivot?
Data Analysis Expression (DAX) is used to calculate column fields in Power Pivot.
81. What are the column values that DAX supports?
- It is not capable of inserting or modifying data
- It cannot be used to calculate rows, though you can calculate measures and calculated columns
82. Explain the Power Pivot Data Model.
It is a model composed of data types, tables, columns, and table relations. The data tables are generally constructed to hold data for a business entity.
83. Define Power Query.
Power Query is an ETL tool for cleaning, shaping, and transforming data without code, using intuitive interfaces. With this:
- You can import data from various sources, such as databases or files
- Append and join data from a wide range of sources
- You can shape data as needed by adding and removing it
84. Name the language that is used in the Power Query.
M-code, which is a new programming language, is used in Power Query. This language is easy to use and is quite similar to other languages. Also, it is case-sensitive.
85. Name the data destinations for Power Query.
Two destinations are available for the output we receive from the Power Query. They are:
- Load to Excel Data Model
- Load to a table in a worksheet
86. Explain the Power BI Designer.
Power BI Designer is a standalone app for creating Power BI reports and uploading them to Power BI.com. It is a combination of Power View, Power Pivot, and Power Query.
87. What is the use of the split function?
The split function splits a string database using the given delimiter.
88. Name all the platforms for which the Power BI app is available?
Power BI app is available for:
- Android
- iPhone and iPad
- Windows tablets and Windows Desktops.
89. What is the difference between older and newer Power BI?
There is a new design tool for Power BI called Power BI Desktop. It is a standalone designer that includes Power Pivot, Power View, and Power Query on the back end. At the same time, Older Power BI consists of Excel add-ins. In the newer Power BI version, several graphs are available, including treemap, line area chart, waterfall, and combo chart.
90. Is it possible in the Power Pivot data model to have more than one active relationship between two tables?
No, it is not possible. There can be at most one active relationship between two tables in the Power Pivot data model. It is possible to have only one active and many inactive relationships.
91. What are the general data shaping techniques?
The common data shaping techniques are:
- Removing Columns and Rows
- Adding Indexes
- Applying for a Sort Order.
92. What are the KPIs in Power BI?
KPIs are Key Performance Indicators that assess the organization’s performance in distinct areas by tracking measurable goals and values. A KPI has a measure or base value that is evaluated against target values. It includes a comparison of the performance with the target. The KPI also helps you evaluate the analysis performance with its graphical representation. Thus, KPIs will show whether your goals have been met.
93. What could be the difference between Distinct() and Values() in DAX?
We can use both the Distinct() and Values() functions to return values to a column or cell on the worksheet. The difference is that the Values() function returns blank values along with unique values, whereas the Distinct() function returns unique values.
94. State the advantages of the Direct query method.
The advantages of the DirectQuery method are listed as follows:
Users can build large datasets of data visualizations using the DirectQuery method, but Power BI Desktop supports data visualizations only on smaller datasets. There is no dataset limit for the DirectQuery method, so the 1GB limit does not apply.
95. What is the parameter in Power BI?
If you want to create a scenario and, based on that, see the visuals, the best option is the What-if parameter. It helps you to forecast data and perform advanced analytics. For example, if you have set the product discount in the what-if parameter to 1 to 10. Users can change values and see the impact on profit, sales, revenue, margin, and other metrics, enabling detailed analysis.
Power BI Interview Questions for Experienced Professionals
Next, we will learn the advanced, scenario-based Power BI questions that will help excel in real-time work environments.
96. What is the incremental refresh?
Incremental refresh is used to refresh the newly added data to avoid truncation and loading delays.
97. What are the three main tabs in the Reports development Window?
The major tabs in the Reports development Window are as follows:
- Relationship tab
- Data Modeling Tab
- Report Tab
98. How many types of default Graphs (Visualizations) are available in Power BI?
Around 26 Views.
99. What are Slicers in Power BI?
- Slicers are visual filters on the Power BI report page. It helps us to sort and filter information on a packed report
- Slicers, unlike filters, appear as report visuals, and you can select values on them while analyzing the report data.
100. What is the major difference between a Filter and a Slicer?
Using Normal filters, users were not allowed to interact with dashboards or reports, but using slicers, we can interact with them.
101. What is a parameter in Power BI?
A Parameter in Power BI is a dynamic filter used in calculated fields. It is based on the parameter value, which can vary.
102. What is the difference between New Measure and New column?
A new column is an area in Power BI where the physical data is stored when logic is applied, whereas a measure is where the calculations are performed on the fly based on dimensions. Measure, unlike Column, won't store any physical data.
103. What are the different joins in Power BI?
- Horizontal Joins to append data from multiple tables
- Vertical Joins to merge the data from multiple tables.
104. What is the Embed Code?
There is an option in the Power BI service that publishes to the web, generating a link to the Power BI report that can be shared with clients.
105. How do you Hide and Unhide a Specific Report in Power BI?
In the menu bar, choose the Selection pane and hide/unhide the report and the action to pass to the bookmark.
106. How do you compare Target and Actual Values from a Power BI report?
A gauge chart is used to compare two measures, with Target and Actuals inferred.
107. What are Power Query's major Data Destinations?
There are two destinations for the output we get from Power Query:
- Load to a table in a worksheet
- Load to the Excel Data Model.
108. Can we Refresh Data Reports that are uploaded to the Cloud?
Yes, you can refresh the data reports that are uploaded to the cloud. The Power BI Personal Gateway and Data Management Gateway help you achieve this.
109. How are a Power BI Dashboard and a Report different from each other?
To understand the difference between a Power BI Dashboard and a Report, let’s run through some quick points.
| Capability | Report | Dashboard |
| Pages | Can be of one or more pages. | Consists of one page only |
| Data sources | It has a single dataset per report. | Can have data tiles from one or more datasets or reports. |
| Filtering | Can perform slicing, filtering, and highlighting. | Cannot filter or slice reports. |
| Set alerts | No option for setting alerts. | Enable setting email alerts |
| Featured reports | No option for creating a featured dashboard. | Enables setting only one dashboard as featured. |
| Accessing tables and fields in datasets | Provides options to view dataset tables, values, and fields. | Cannot view or access underlying dataset tables and fields. |
110. How to toggle between two Options and make it interact with the rest of the Visualizations in a Report?
Toggling is an action in Power BI reports that occurs when there are two or more dimensions. With “Enlighten Slicer”, you can show this in Power BI, and it can be imported from the Marketplace.
111. What does rank() do?
Rank() calculates the regular competition rank, so it returns identical values. You can ask for ascending or descending values in the second argument, as needed.
112. What are the essential applications of Power BI?
- Power BI is mainly used by:
- PMO - Project Management Office
- Developer & Database Administrator
- Business & Data Analyst
- IT Team, IT Professional
- Data Scientist
- Consumer for End User Report.
113. How will you export from Power BI to Excel?
In Power BI, a user can export any dashboard or visual. To export your data, click the ellipses (3 dots) in the top-right corner of any visualization, then select the Export data icon. Your data is exported as a CSV file. You can even save the file and open it in Excel.
114. How do you manage a role in Power BI?
Follow these steps to manage a role in Power BI.
- Step 1:Import data into the Power BI Desktop report
- Step 2:Connection
- Step 3:Select the Modeling tab
- Step 4:Select Manage Roles
- Step 5:Select Create
- Step 6:Provide a name for the role.
- Step 7:Select the table that you want to apply a DAX rule to
- Step 8:Enter the DAX expressions
- Step 9:After creating a DAX expression, select the checkbox placed above the expression and validate the expression.
- Step 10:Select Save.
115. How do you answer behavioral interview questions?
These can be answered in four simple steps as follows:
- Step 1:Situation. Describe the situation or set the scene.
- Step 2:Task. Describe the issue or problem you were confronted with
- Step 3:Action
- Step 4: Results.
116. What is the difference between Power BI and Tableau?
Here are the key differences between Power BI and Tableau
| Feature | Power BI | Tableau |
| Data visualization | Focuses only on modeling and reporting | Best tool |
| Cost | Less expensive | Very expensive since it uses data warehousing |
| Machine Learning | It is associated with Microsoft Azure. | It has Python machine learning. |
| User Interface | Simple and easy to use | Use a customized dashboard |
| Data handling | It drags down slowly when handling huge data | Handles bulk data |
TCS Power BI Interview Questions
1. What is the Power BI Service?
Power BI Service is a cloud-based analytics solution that helps you to create dashboards and publish, design reports, collaborate, and share the reports with internal and external stakeholders.
2. What is a summarize function in DAX?
Summarize is a DAX function that gives an aggregated result from a table.
This is how you can use the summarize function:
- Summarize(<table>,<grouping column>,[<name>,<expression>])
- Table - a DAX expression that returns a table
- grouping column - the column name you want to use for grouping
- name - the name of the new aggregated column
- expression - generates the aggregated column.
3. Can you export Power BI report data into any other format, like SSRS?
Yes, you can export Power BI report data to another file format, such as PowerPoint, PDF, Image, Microsoft Word, or Microsoft Excel, or export the report by generating an Atom service document that lists the Atom-compliant data feeds available from the report.
4. What is the difference between the measure and the calculated column?
The difference is the context of evaluation. A measure is evaluated in the context of the cell evaluated in a report or in a DAX query. While the calculated column is computed at the row level within the table it belongs to.
5. Have you faced any performance issues in your project?
This is one of the important Power BI questions. As a developer, you may encounter one or two performance issues depending on the type of data you use. Explain how you overcome those issues.
Cognizant Power BI Interview Questions
1. Describe a time when Power BI limited or enhanced your success on a project?
There is a limitation to exporting data for large data sets in Power BI.
2. What is your go-to DAX function for time intelligence?
DATEDADD is the most versatile time intelligence function. However, pretty much all the time, intelligence can be recreated with DATEDADD.
3. How do you improve the performance of your data models?
Following the tidy data philosophy, column usage should be limited. Also, utilizing the star schema to limit joins will improve the model.
Disabling unused tables from loading also helps. Also, using lookups can improve overall functionality.
4. How can you change the value measure to show multiple measures dynamically?
You can dynamically change and switch functions to show multiple measures using harvesting measures.
5. What are the differences between MSBI and Power BI?
| MSBI | Power BI |
| In MSBI, SSRS is used to access and integrate process components and to program interfaces for testing and sharing reports across multiple devices. | Power BI is a collection of BI tools and techniques for creating reports and dashboards by transforming raw data into customized charts, maps, and graphs. |
| We cannot access the data from the cloud storage. | We can access the data from both the cloud and on-site. |
| MSBI can manage massive datasets without stressing computer systems. | Power BI will manage datasets with a maximum of 33,000 rows or 10 MB. If the data exceeds this limit, the user must execute the queries. |
| In MSBI, SSRS can only be used to create reports and visualizations. | Power BI is used to create models, dashboards, and reports that can be accessed and shared through web browsers and Power BI Apps. |
6. What are the different kinds of Visualizations in Power BI?
The following are the different kinds of visualizations in Power BI:
- Bar and Column Charts: We can use these visualizations to examine a specific value across several categories. The bar chart above shows sales for the four quarters.
- Area Charts: Area Charts will help you visualize the extent of change over time.
- Doughnut and Pie Charts: These charts will help you visualize relationships among whole parts.
- Cards: Cards will display the aggregate value of a specific data point.
- Slicers: They can be used to filter other visuals on the page.
- Maps: Maps will display categorical and quantitative data with dimensional locations.
- Matrix: A matrix is a type of table that makes it easy to view aggregated data.
7. What are the different kinds of Filters in Power BI Reports?
The following are the different types of Filters:
- Page-Level Filters: These filters will work at the report page level. Different pages of the same report can have varied page-level filters.
- Visual-Level Filters: These filters will work on a single visualization. They minimize the amount of data the visualization can access and filter the calculations and data.
- Report-Level Filters: These filters apply to the entire report, filtering all pages and visualizations within it.
8. Differentiate Calculated Columns, Calculated Tables, and Measures.
| Calculated Columns | Calculated Tables | Measures |
| Calculated Columns are included in the tables by applying the DAX formula to the existing data. | Calculated tables are created using the DAX formulas to define the values. | Measures will use DAX functions to perform complex calculations. |
| DAX formulas specify values for new columns rather than querying data sources. | Calculated Tables are created in both the Report and Data views | Measures can be utilized to highlight running totals, compare sales, forecast sales, and serve other purposes. |
| Calculated Columns are helpful when the data sources do not include the data displayed in the required format. | Calculated tables are suitable for intermediate calculations, and the data users need to store it in the data model. | Measures are generated in both Data Views and Reports. |
9. Explain Query Folding.
Query Folding refers to processes in Power Query that convert specified steps into SQL and execute them on the source database rather than the client machine. This practice is essential for optimizing performance and ensuring scalability in data processing.
10. What is Self-Service in Power BI?
Self-Service BI, or Self-Service Business Intelligence, is an approach to data analytics, visualization, and reporting that allows users to create easy-to-understand, actionable, and intuitive dashboards almost immediately.
11. Explain in detail about Conditional Formatting.
Conditional Formatting is a feature that enables us to apply different formatting styles to data elements based on their values and other conditions. We can apply conditional Formatting to several visual elements, such as matrix cells, table cells, color scales, and data bars. Some general use cases for conditional Formatting include emphasizing trends, highlighting outliers, and visualizing data quality issues.
12. How do we optimize the performance of the Power BI Reports?
The following are some techniques to optimize the Power BI Reports:
- Utilizing the proper data types and minimizing the number of columns in the data model.
- Creating practical DAX Calculations and avoiding complex resources.
- Using the summary and aggregation tables reduces the amount of data processed.
- Enforcing slicers and filters for limiting the data shown in visualizations
- Utilizing the incremental refresh to update only the modified data.
13. What is the difference between a Slicer and a Filter?
In Power BI, a slicer is a visual element that lets us filter the data in the report by selecting specific ranges and values. Slicers offer a more user-friendly and interactive way to filter data than conventional filters. Filters are applied directly to the individual visualizations and the data model and are not visible to the end user.
14. What is the difference between CALCULATETABLE and CALCULATE functions?
CALCULATE TABLE and CALCULATE are the only functions that filter and modify the table. These can be added to existing queries or filters, or used to remove the existing filter context from queries and override the filter context of queries.
15. Explain Custom Visuals in Power BI.
In Power BI, we can create visuals from the library of custom visualizations. We should create a development project and then test the visual in the Power BI Service. Whenever a custom visual is created, it is tested before posting. It is saved as the “.pbviz” file.
16. Why do we use the custom visual file?
We use custom visuals when the pre-existing visuals do not suit the business requirements. Generally, Custom Visuals are created by developers and can be utilized in a similar way to prepackaged files.
17. What are the data sources of the Power Map?
The data sources can be external or Excel. While preparing the data, ensure that all data is in the format of an Excel table, with each row representing a distinct record. The column and row headings should include text, not actual data. This is critical to ensure that Power Map interprets it properly while plotting the geographical coordinates.
18. Describe Query Parameters in Power BI.
Query parameters are used to provide users with a local Power BI Desktop report that includes a prompt. This helps us to specify the values they are interested in:
- The calculation and query can utilize the parameter calculation.
- PBIX files will be exported as the Power BI Templates
- Template Files will include everything from PBIX files except for data.
19. What are the different stages of working with Power BI?
The following are the different stages of Power BI
- Data Integration: The first step in business intelligence is to establish a successful connection to the data source and integrate it to extract data for processing.
- Data Processing: The next step of Power BI is data processing. Most of the time, the raw data also contains unexpected errors, and sometimes a few cells may be empty. Business intelligence must interpret inaccurate data and missing values during the data processing stage.
- Data Presentation: The final and third stage of business intelligence is analyzing data retrieved from data sources and presenting the insights through interactive dashboards and appealing graphs.
| Explore Power BI Sample Resumes Download & Edit, Get Noticed by Top Employers! |
Top Power BI DAX Interview Questions
Let’s go through some Power BI DAX interview questions in this section.
1. Why is DAX so important?
Importing data into Power BI Desktop is easy. You can even create reports that share valuable insights without using DAX formulas in them. But if you want to analyze the growth percentage across different date ranges and product categories, or calculate year-over-year growth relative to market trends? DAX formulas support this capability.
DAX stands for Data Analysis Expression language. Knowing how to use DAX formulas helps you to get the most out of your data. DAX works on operators, functions, and constants to further extend your model.
2. How does Power BI DAX work?
The three fundamental concepts of Power BI DAX are Syntax, Context, and Functions.
Syntax:
It comprises various components that make up the formula. To understand the DAX formula, let’s break down each of the elements into a language.
Total Sales = SUM(Sales[SalesAmount])- Total Sales is the Measure name.
- The equals sign (=) indicates the start of the DAX formula.
- SUM is used to add the values of a given field.
- The parenthesis () is used to enclose and define arguments in an expression
- Sales are in the table referenced
- The referenced column [SalesAmount] is the argument that the SUM function uses to identify the column to aggregate.
Context:
- It is one of the essential concepts of DAX. There are two types of Contexts - Row Context and Filter Context.
- The Row-Context is applied whenever a formula has a function that filters to identify a single row in a table.
- Filter-Context is used when one or more filters are applied in a calculation.
Functions:
Functions are structured, predefined, and ordered formulae. They complete calculations using arguments passed on to them.
3. Explain the DAX function.
A DAX function is a predefined formula that performs calculations on values provided to its arguments. The arguments in a function should be in a specific order and can be a column reference, text, numbers, constants, etc. Every function performs a particular operation on the values enclosed in an argument. There can be more than one argument in a DAX formula.
Some of the most commonly used DAX functions:
Date and Time Functions:
These functions perform calculations on date and time values.
Ex: DATE, CALENDER, HOUR, MINUTE
Time Intelligence Functions:
These functions are used to evaluate values over a fixed period.
Ex: DATESBETWEEN, ENDOFQUARTER, CLOSINGBALANCEMONTH
Information Functions:
These functions provide particular information on the data values included in rows and columns. It checks the given condition in a function for the given value and returns TRUE or FALSE.
Ex: ISERROR, CUSTOMDATA, ISNONTEXT
Logical Functions:
These functions are used to evaluate an argument or expression logically.
Ex: AND, FALSE, IFERROR, IF
Mathematical and Trigonometric Functions:
These functions are used to perform all sorts of mathematical functions on the reference values.
Ex: DIVIDE, FACT, ACOS
Statistical Functions:
These functions perform statistical and aggregation operations on data values in a DAX expression.
Ex: AVERAGE, COUNT, GENERATE
Text Functions:
These are similar to Excel's string functions.
Ex: FIND, LEFT, FIXED, FORMAT
Parent-Child Functions:
These are used for data values that are a part of a parent-child hierarchy.
Ex: PATH, PATHITEM
Table Functions:
In DAX formulas, these functions are used to apply operations and conditions on entire tables.
Ex: FILTER, VALUES, DISTINCT
Other Functions:
There are a bunch of functions that do not fit in any particular category.
Ex: GROUPBY, EXCEPT, GENERATESERIES
4. Tell something about DAX Calculation Types.
DAX formulas can also be called DAX Calculations, as they take an input value and return a result. The calculations that you can perform using DAX in Power BI are Calculated Measures and Calculated Columns.
- Calculated Measures: They create fields that aggregate values, such as sums, percentages, ratios, and averages.
- Calculated Columns: They create a new column in your existing table. The only thing is that there should be at least one function in the calculated column. When you want to create a column with filtered or sorted data, use calculated columns.
5. What’s the main purpose of using the Calculate function?
Calculate functions allow you to modify the filter context of tables or measures. You can perform the following:
- Override filter context from queries
- Remove the present filter context from queries
- Add to the existing filter context of queries.
Scenario-Based Interview Questions For Power BI
1. How do you implement RLS in a Power BI project?
By following the steps below, we can implement RLS in Power BI.
First, prepare a data model consisting of fact and dimension tables.
For static RLS
- Open ‘Manage roles’ in Power BI Desktop
- Create a role and add a DAX filter
- Open dataset security and assign users to the role.
For dynamic RLS
- Create a security table
- Create relationships
- Create a role using USERPRINCIPALNAME().
2. How would you version your PBI files?
We can follow the approach to version PBI files.
- Use the repositories such as GitHub, GitLab, and Azure DevOps
- Use the PBIP format instead of PBIX
- Use separate datasets and reports
- Use deployment pipelines in the Power BI service
- Track changes with CI/CD pipelines
- Store metadata separately
- Maintain release notes.
3. How to add a button in Power BI to toggle between Net Sales $ and Net Sales Qty (label buttons $ and Qty)? Also, you need to replace the net sales $ measure with this dynamic measure in the 4 visuals.
To solve this problem, we can use the field parameters approach in Power BI. Let’s run through the required steps below.
Create the field parameter
- First, go to the ‘Modeling’ tab
- Click ‘New Parameter’ and select ‘Fields’
- Name the parameter like ‘Select Metric’
- Drag in both [Net Sales $] and [Net Sales Qty]
- Double-click the names
- Ensure that ‘Add slicer to this page’ is checked
- Click ‘Create’
Format the slicer to drop a slicer onto your page
- Go to Format Visual > Slicer settings to select the slicer
- Change the style to ‘Tile’ and turn ‘Single Select’ to ‘ON.’
Update the four visuals
- Select your first visual
- Remove [Net Sales $] from the data fields
- Find your new ‘Select Metric’ parameter table
- Drag the ‘Select Metric’ field into your visual
- Repeat this for the other 3 visuals.
Frequently Asked Questions
1. What language does Power BI use?
- DAX and M are the two languages supported by Power BI for filtering, handling, and visualizing data.
- DAX is an analytical data calculation language used to analyze data during the Data View phase.
- On the flip side, M is a query formula language used in Power BI Query Editor to prepare data before loading it into the Power BI model.
2. Is Power BI enough to get a job?
Power BI works with the advanced version of Excel, so one needs to have excellent knowledge of MS Excel and to build interactive dashboards to get hired.
3. What is Q&A in Power BI?
Q&A in Power BI allows you to explore data using natural language capabilities and obtain answers in the form of graphs and charts. You'll find Q&A on dashboards in the Power BI service.
4. Does Power BI need coding?
No coding is required to use Power BI. It’s a data visualization tool to create business intelligence dashboards. However, Power BI has formula languages such as M and DAX that perform operations similar to programming languages.
5. How to become a Power BI developer?
To become a Power BI Developer, you must have key data visualization skills and an ability to glean insights from large data sets. Companies across all industries have made huge investments in big data, building out their analytics departments, making Power BI a field ripe with opportunities. This trend is projected to continue in the foreseeable future.
Here are the five steps to become a Power BI Developer:
- Learn Power BI fundamentals
- Develop your practical data analytics skills by working on projects.
- Create visualizations and practice presenting them.
- Build a portfolio of your work as a Power BI Developer.
- Apply for Power BI jobs.
6 Is Power BI a good career option?
Yes, it is a good career option. Major MNCs like TCS, Infosys, Wipro, HCLTech, LTIMindtree, KPMG, PwC, and Birlasoft use Power BI extensively. So you can get jobs in MNCs for good salaries by learning Power BI.
7. Why is Power BI so popular?
On-premises or in the cloud, Power BI provides a scalable and unified platform for data collection, refinement, analysis, and presentation. Through interactive dashboards and data-rich, easy-to-understand reporting, it provides organizations with a 360-degree view of their operations. It is part of the Microsoft Business Intelligence (MSBI) suite and includes a variety of services, products, and applications.
8. How much do Power BI developers make?
According to AmbitionBox, Power BI developers with 2-5 years of experience can earn a salary between 6.5 LPA and 7.2 LPA in India. Glassdoor reports that they can earn between 91k USD and 100k USD in the USA.
9. What certifications are offered by Power BI?
- Exam PL-300: Microsoft Power BI Data Analyst
- Exam DA-100: Analyzing Data with Microsoft Power BI
- Microsoft Certified: Power BI Data Analyst Associate.
10. What are the job profiles that a Power BI developer can look for?
There are a variety of job profiles available due to Power BI's popularity:
- Power BI Developer
- Power BI Analyst
- Power BI Business Analyst
- Power BI Data Analyst
- Power BI Software Engineer
- Senior Business Intelligence Analyst.
11. How to Learn Power BI?
Because of Power BI's ubiquity, there is a plethora of resources for aspiring professionals to understand all aspects of the platform, from basic to advanced.
Here is a list of different ways you may use to learn Power BI, whether you're just getting started or want to brush up on your existing knowledge.
- Microsoft hosted webinars
- Microsoft’s guided learning resources
- Visit the official Power BI online community
- Microsoft’s YouTube training videos
- Power BI’s development team’s blog
- E-learning sites offer various online courses.
12. Is Power BI better than Tableau?
Both Tableau and Power BI allow users to connect to different data sources. However, Tableau provides better support for connecting to different data warehouses, while Power BI is deeply integrated with Microsoft’s portfolio, including the Azure cloud platform.
13. Is a Data Analyst a Good Career?
Data is useless without proper analytics. Any professional with analytical skills can easily master the vast expanse of Big Data and become a crucial asset to the organization, boosting the business and their career. There are several on-demand job opportunities in Big Data management and analytics, and the demand is constantly growing.
Key Skills Required of Power BI Engineers
Understanding the key skills required for Power BI engineers will help you prepare for Power BI interviews effectively.
- Expertise in designing star and snowflake schemas, creating relationships, and optimizing models.
- Strong command of data analysis expressions (DAX) to build columns, measures, and perform advanced analytics.
- Sound expertise in cleaning, transforming, and loading data using Power Query (M language)
- Proficiency in designing dashboards to help teams grasp insights and draw data-driven conclusions.
- Knowledge of query folding, aggregations, reducing load times, and many more.
Job Responsibilities of a Power BI Engineer
Here, we outline the responsibilities of Power BI engineers for various expertise levels.
Entry-level with 0-2 years of experience
- Developing and maintaining Power BI reports and dashboards.
- Collecting, cleaning, and transforming data
- Creating data models and DAX calculations
- Collaborating closely with business analysts, developers, and other stakeholders
- Troubleshoot report issues, monitor, and optimize business performance.
Middle-level with 2-3 years of experience
- Designing and deploying Power BI Dashboards and Reports that meet enterprise requirements.
- Extracting, transforming, and loading the data from several sources into Power BI.
- Implementing data modeling, visualization, and reporting techniques to provide scalable and effective BI solutions.
- Developing and maintaining documentation for BI solutions.
Senior-level with 3-5 years of experience
- Maintaining row-level data security and understanding application security layer models.
- Creating Data Modeling Solutions in Power BI
- Build, Test, and deploy the Power BI Scripts and perform detailed analytics.
- Creating relationships between the data and developing tabular and multidimensional models.
Tips to Prepare for a Power BI Interview
Here are a few tips to help you ace your Power BI interview.
Research the company
Learn everything there is to know about the organization. Tailor your responses to the company's needs.
Review the job specifications
Look over the responsibilities of the role. Brainstorm at least one example from your previous experience that meets the listed requirements. When the interviewer asks a question about that criterion, you'll be prepared with an example.
Brush up on your knowledge
You may be asked questions about business intelligence processes, methodologies, or best practices. Review your knowledge in essential areas through books, videos, tutorials, and more.
Practice common questions
While you can't predict what the company will ask, familiarising yourself with common interview questions will help you prepare.
Conclusion
We hope these Power BI interview questions helped you gain a solid understanding of its features and capabilities. You must have gained comprehensive knowledge of Power BI from the basics to the advanced without a doubt.
If you want to learn more about Power BI, you can take the Power BI course by MindMajix. By the end of the training, you will gain strong competency to crack your Power BI interviews effortlessly.
 On-Job Support Service
Online Work Support for your on-job roles.

Our work-support plans provide precise options as per your project tasks. Whether you are a newbie or an experienced professional seeking assistance in completing project tasks, we are here with the following plans to meet your custom needs:
- Pay Per Hour
- Pay Per Week
- Monthly
| Name | Dates | |
|---|---|---|
| Power BI Training | Aug 01 to Aug 16 | View Details |
| Power BI Training | Aug 04 to Aug 19 | View Details |
| Power BI Training | Aug 08 to Aug 23 | View Details |
| Power BI Training | Aug 11 to Aug 26 | View Details |