
- Power BI Slicers - A Definitive Guide
- How to Download and Install Power BI Desktop
- How to Share Reports in Power BI for Mobile
- Power BI Architecture: A Complete Tutorial with Diagram
- Power BI Career Opportunities
- What are the Components of Power BI?
- Power BI Tutorial - Power BI Desktop Tutorial
- Power BI Interview Questions and Answers
- Power BI Services and Benefits
- Power BI Visuals List and Chart Types
- Power Apps Interview Questions and Answers
- Power Apps Tutorial
- What is Power BI? The Definitive Guide
- What is Power Apps?
- Top 15 Data Visualization Tools
- Power BI Projects and Use Cases
- Power Pivot vs Power Query
- Power BI Vs QlikView
- Power BI Heatmap
- Power BI Gateway - Power BI Gateway Architecture
- Power BI vs SSRS - What are the Differences
- Power BI Dashboards vs Reports - Which is better?
Do you know why the DAX in Power BI plays a vital role in data analytics? How does the creation of custom measures impact your decision-making?
Well, You might’ve imported some data into Power BI desktop files and even create reports that show valuable insights. But what if, you need to analyze the growth (%) of product lists over different date ranges or, need to analyze the annual growth of your company compared to rivals? This is where Power BI DAX comes into the picture.
In this blog, we’re going to discuss the most useful DAX functions in Power BI and the creation of measures by using the Power BI desktop and more.
DAX In Power BI
| In this Power BI DAX Basics Article, we will discuss the following topics |
|
DAX in Power BI: How does it work? DAX in Power BI: Calculated Columns & Measures Calculated Columns vs Measures |
Power BI DAX Tutorial | DAX Basics in Power BI | DAX Functions in Power BI

So, let us begin with the DAX definition first, which I am going to talk about in the section below.
DAX Basics in Power BI: What is DAX?
Data Analysis Expressions (DAX) is a syntax language that comprises formulae and expressions that are used in data manipulation. Functions, constants, and operators are used in DAX to create expressions. In simpler terms, DAX is the advanced version of MS Excel with high-end data manipulation and management capabilities. It is developed by Microsoft to interact with its business intelligence and data modeling tools like PowerPivot, Power BI. Power BI is a robust analytics tool by Microsoft that offers several features and functions using DAX as a language.
Some of the major advantages of Power BI are:
- Real-time data visualization
- Creation of charts and report generation on voice command using Cortana
- Large storage space and easy retrieval of data from the storage
- Higher security at the Row level
- BI has intuitive user experience features and memorizes the most frequently used trends
All these functions are essentially performed by pre-set tools and commands in the system. But there are several occasions when you want to perform a particular type of function says a certain type of data analysis but you are unable to do so because the command does not pre-exist in the system. What do you do in such a case? This is where DAX comes into the picture.
| Want to be part of the Power BI real-time environment? then visit here Microsoft Power BI Certification Course |
Importance of DAX In Power BI
DAX is quite an important syntax as working in DAX improves the user experience by deploying functionalities like data visualization, data importing, and manipulating. For normal report creation, the basic knowledge of the dashboard is enough but to be able to build up sophisticated and insightful reports, DAX is required. With several commands and measures that can be used under the DAX syntax, the reports generated are highly intuitive and discerning.
DAX in Power BI: How does it work?
DAX works on a combination of three fundamental concepts:
- Syntax
- Context
- Functions
These inputs are fundamental to the creation of a specific command that fetches desired results.
1. Syntax
Syntax refers to the components of the formula you are making. It is the language used in the formula like the command, sign, operators, destination column or row or table, etc. For example, name, parenthesis, summation, name of the table, etc.
2. Context
Context refers to the target row that has been included in the formula for data retrieval or calculation. Context is present in two types: Row Context and Filter Context.
3. Functions
Functions refer to the predefined or already existing commands in the system. For example, Sum, Add, True, False, etc.
| Also Read: Power BI Architecture Tutorial |
DAX in Power BI: Calculated Columns & Measures
In this article, we are going to be focusing on the Power BI DAX formulae used in calculations, Measures, and Calculated Columns.
#1. Calculated Column
Similar to other regular columns, calculated columns are the ones that come out as a result of computations within two columns of different data sets. They are ideal for row-wise calculations;
#2. Calculated Measure
Calculated columns are ideal for dynamic calculations as they do not acquire any physical space. These are used when data in rows are grouped together for computations.
Calculated Columns vs Measures
Calculated columns and calculated measures both use DAX expressions for data manipulation. The difference lies in the context of the underlying formula. In the calculated column type, the calculation takes place at the row level within a given table. In the calculated measure type, the calculation is done at the cell level in the entire report or the query.
Power BI DAX Basics: Types of Functions in DAX
#1. Aggregate Functions
MIN
Fetches the minimum value in a given column.
Syntax
MIN(<column>)Example
=MIN( [ SellerMargin] )MINA
Fetches the minimum value along with Aggregate Functions Logical values and text representation of numbers if any
Syntax
MINA( <column> )Example
=MINA( InternetSales[Freight] )MINX
Fetches the minimum value after evaluation of each row expression in a given table.
Syntax
MINX ( < table >, <expression> )Example
=MINX( FILTER( InternetSales ) , [ SalesTerittoryKey ] = 2 , [Freight] )Other functions
- MAX
- MAXA
- MAXX
- SUM
- AVERAGE
- SUMX
- AVERAGEX
| Checkout Power Bi Desktop Tutorial |
#2. Count Functions
DISTINCTCOUNT
Fetches the count of distinct numbers avoiding any replication.
Syntax
DISTINCTCOUNT( <column> )Example
=DISTINCTCOUNT( ProductsList[ProductID] ) COUNT
Fetches the total count of items even if repetitions are present.
Syntax
COUNT( <column> )Example
=COUNT ( [ShipDate] ) COUNTA
Fetches the count of items in a non-empty column.
Syntax
COUNTA( <column> )Example
= COUNTA( ‘ProductSeller’[Phone] ) COUNTROWS
Fetches the number of rows in a given table.
Syntax
COUNTROWS( < table > )Example
=COUNTROWS( ‘Enquiries’ )| Visit here to know the difference between Tableau Vs Power BI |
#3. Date-Time Functions
DATE
Fetches the desired date in Date-time format.
Syntax
DATE ( <year>, <month>, <day> )Example
=DATE ( 2020,02,27 ) HOUR
Fetches hours in the AM PM format.
Syntax
HOUR ( <datetime> )Example
=HOUR( ‘Orders’ [TransactionTime] )TODAY
Fetches the current date.
Syntax
TODAY()Example
= YEAR ( TODAY())-2012Other functions
- NOW
- EOMONTH
| Visit here to know the Power BI Slicers - A Complete Guide |
#4. Math Functions
ABS
Fetches the absolute value.
Syntax
ABS( <number> )Example
=ABS( [LabelPrice] - [SellingPrice] ) EXP
Fetches the exponent's value.
Syntax
EXP( <number> )Example
=EXP( [Power] ) FACT
Fetches the factorial of a given number.
Syntax
FACT( <number> )Example
=FACT( [Values] )Other functions
- LN
- LOG
- PI
- POWER
- QUOTIENT
- SIGN
- SQRT
| Read these latest Power BI Interview Questions and Answers that help you grab high-paying jobs |
#5. Logical Functions
AND
Performs the logical conjunction on two specified expressions.
Syntax
AND( <logical1> , <logical2 > )Example
=IF( AND(1<2 , 2<3) , “All true” , “One or false” ) OR
Performs the logical disjunction on two specified expressions.
Syntax
OR( <logical1 > , <logical2 > )Example
=( IF(OR(1<2 , 2<3) , “All true” , “One or more false” ) NOT
Performs logical negation on the given expression.
Syntax
NOT( <logical > )Example
=NOT( [ProductPrices] )Other functions
- IF
- IFERROR
| To learn more about Power BI in detail go through Power BI Desktop Tutorial |
#6. Information Functions
ISBLANK
Declares if the value is blank or not as true or false.
Syntax
ISBLANK( <value> )Example
=IF( ISBLANK(‘CalculatedMeasures’[PreviousYearTotalSales]) ,BLANK() , (CalculatedMeasures’[PreviousYearTotalSales]/ ‘CalculatedMeasures’[PreviousyearTotalSales])ISNUMBER
Declares if the value is a number or not.
Syntax
ISNUMBER(<value>)Example
=IF( ISNUMBER(2), “Is number”, “Is Not number” ) ISNONTEXT
Declare if the value is non-text.
Syntax
ISNONTEXT( <value> )Example
=IF( ISNONTEXT(“ ”), “Is Non-Text”, “Is Text” )Other functions
- ISERROR
- ISTEXT
#7. Text Functions
CONCATENATE
Performs joining of two strings.
Syntax
CONCATENATE( <text1> , <text2> )Example
= CONCATENATE( “Hello” , “Learner” ) FIXED
Performs rounding off of number to a given decimal.
Syntax
FIXED( <number> , <decimals> , <no_commas> )Example
=FIXED( [LabelPrice], 3,1 ) REPLACE
Replaces part of a string with specified characters.
Syntax
REPLACE( <old_text> , <start_num>, <num_chars> , <new_text> )Example
=REPLACE( ‘New Services’[Service ID],2,3,”AB” )Other functions:
- SEARCH
- CONCATENATEX
- SEARCH
- UPPER
| Also Read: Power BI Services and Benefits |
Creating a Measure using Power BI DAX
The following steps make your task simple to create a measure using Power BI DAX.
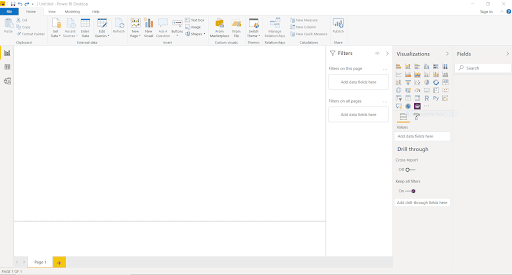
1. First, go to the Power BI Desktop app.
2. Right-click the Sales table or hover over More options (...) of Field pane.
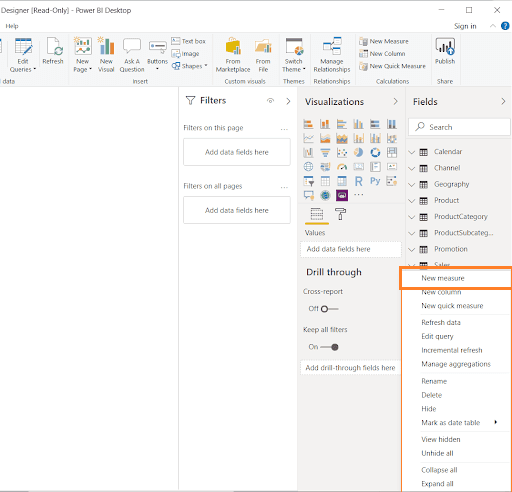
3. Once the menu is presented, select New Measure. This activity stores the new Measure in the Sales table. You can also create a new Measure from the Power BI desktop ribbon in the following way.
Go to Home tab > Calculations group > New Measure.
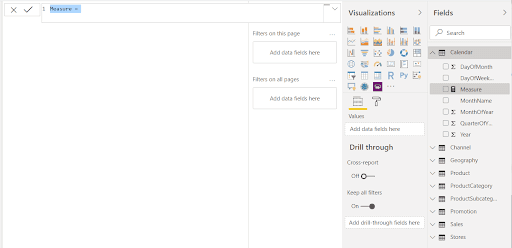
4. Next, the Formula bar exists on top of the reporting canvas, where you can edit your name and write a Data Analysis Xpression formula.
Let’s discuss the concept before creating the formula. This makes it simple to proceed further
Variables Selection and Formula creation:
- The net amount of any products or services requires some variables.so, I listed out prerequisite variables: Net Amount, Quantity of products or services, price of each quantity, and other expenditure(Total cost price).
- Net amount = (Total Quantity Sales) * (Per/Product or Service) - Expenditure (cost price).
5. The Measure is named by default in the formula bar, but we need Measure to be more noticeable, emphasize Measure in the formula bar and alter it to Net Amount.
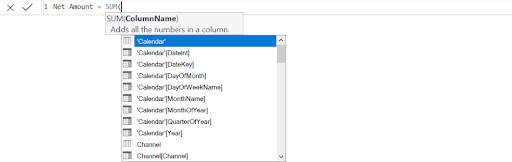
6. While creating your formula, write Sum after the equal sign. Now, the drop-down suggestion list appears, once you type the starting of the letter. Select from the list, if needed, and then press Enter.
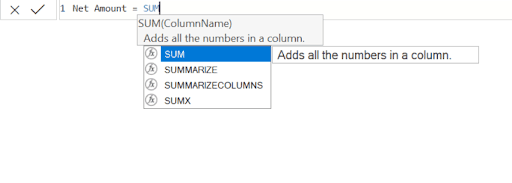
7. Press enter after typing the SUM. Now, you can see an open parenthesis along with a drop-down suggestion list of existing columns. It can be passed to the SUM function.
8. The expression is always between Open parenthesis and Closing parenthesis. For this instance, your expression comprises an argument to push to the SUM function: the SalesQuantity Column. Start Typing SalesQuantity until Sales[SalesQuantity] is the only value that appears in the list.
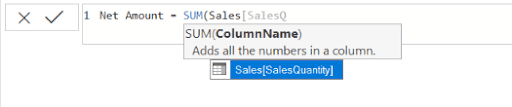
The Table name is preceded by the column name is called the fully qualified name of the column. It makes your formula easier to comprehend.
9. Select Sales[Sales quantity] from the list then enter closing parenthesis.
Multiply the Value with the First Expression and Subtract the other Column from the Final Value:
- After finishing the first expression, multiply 15,000 with that expression to obtain the total amount of quantity.
Sales[SalesQuantity]* 15000.
- Type a space after the desired value, space, a minus operator (-), and then another space.
- Write another SUM function, and Start writing TotalCost you can select the Sales[TotalCost] and then enter closing parenthesis.
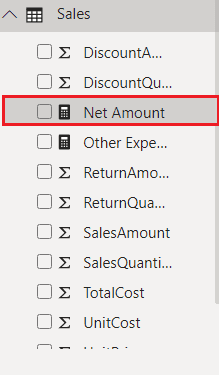
10. To finish and validate the formula, we need to enter either Enter or Select CheckMark icon(Commit).
The validated Net Amount measure is now ready to use in the sales table in the Fields pane.
Conclusion:
DAX is one of the most commonly used expression syntax these days with a wide range of applicability. Learning it opens up several opportunities in the market, especially in SQL-enabled companies. With DAX in Power BI, you are empowered to build up any kind of logical expression or formula as per requirement.
Reach out to us in the comments if you want to learn and excel in DAX.
Got any questions? Leave a comment below and we will get back to you
 On-Job Support Service
Online Work Support for your on-job roles.

Our work-support plans provide precise options as per your project tasks. Whether you are a newbie or an experienced professional seeking assistance in completing project tasks, we are here with the following plans to meet your custom needs:
- Pay Per Hour
- Pay Per Week
- Monthly
| Name | Dates | |
|---|---|---|
| Power BI Training | Aug 01 to Aug 16 | View Details |
| Power BI Training | Aug 04 to Aug 19 | View Details |
| Power BI Training | Aug 08 to Aug 23 | View Details |
| Power BI Training | Aug 11 to Aug 26 | View Details |

Madhuri is a Senior Content Creator at MindMajix. She has written about a range of different topics on various technologies, which include, Splunk, Tensorflow, Selenium, and CEH. She spends most of her time researching on technology, and startups. Connect with her via LinkedIn and Twitter .


