
- Power BI Slicers - A Definitive Guide
- How to Download and Install Power BI Desktop
- How to Share Reports in Power BI for Mobile
- Power BI Architecture: A Complete Tutorial with Diagram
- Power BI Career Opportunities
- DAX In Power BI - Learn Power BI DAX Basics
- Power BI Tutorial - Power BI Desktop Tutorial
- Power BI Interview Questions and Answers
- Power BI Services and Benefits
- Power BI Visuals List and Chart Types
- Power Apps Interview Questions and Answers
- Power Apps Tutorial
- What is Power BI? The Definitive Guide
- What is Power Apps?
- Top 15 Data Visualization Tools
- Power BI Projects and Use Cases
- Power Pivot vs Power Query
- Power BI Vs QlikView
- Power BI Heatmap
- Power BI Gateway - Power BI Gateway Architecture
- Power BI vs SSRS - What are the Differences
- Power BI Dashboards vs Reports - Which is better?
Microsoft Power BI is a leading Business Intelligence tool, used by data analysts. And, also most companies adopted this #1 BI tool to manage their data effectively at affordable prices and to make apt decisions at the right point of time. Power BI is consists of 13 main components, which can be used even individually, and which will make the data more reformed and easy to interpret. So, let's dive into the most popular Components of Power BI.
List of Microsoft Power BI Components
For business users, Power BI has its own building blocks, usually referred to as Power BI content. Here are they:
What are the Building Blocks of Power BI?
Power BI consists of 5 main tools which serve as the base for the functioning of Power BI and they are:
1. DataSets
Dataflow’s source data or the collection of data that are imported are called Datasets. Each of these datasets is connected to Power BI to make them be stored in one single place.
2. Visualization
When the data are represented in the form of charts/graphs/diagrams/ any other form of visuals, it is called visualization. These help in reforming the data for a better understanding.
3. Reports
The visual representation of any collected data is called Reports and they include charts, maps, graphs, and even treemaps. These reports can be created in Power BI and can be shared through dashboards, with one’s friends. Another way to generate reports is when the user connects to various datasets from their SaaS applications / Excel workbooks. Report making includes 2 modes, called Reading View and Editing View.
4. Dashboards
A single sheet that consists of numerous widgets and tiles is called Dashboards. These are either created by the user himself or are borrowed from the one created and shared by their colleague in the Power BI service. In short, it is a collection of various data and reports.
5. Tiles
Each and every visual data stored in the dashboards are called a Tile. In other words, the Dashboard is a collection of Tiles.
| Want to learn Power BI through a real-time environment? then enroll here Best Power BI Certification Training |
What are the Main Components of Power BI?
Power BI has a defined architecture that includes various important components that serve to the usage of Power BI. However, these components can also be used individually whenever required.
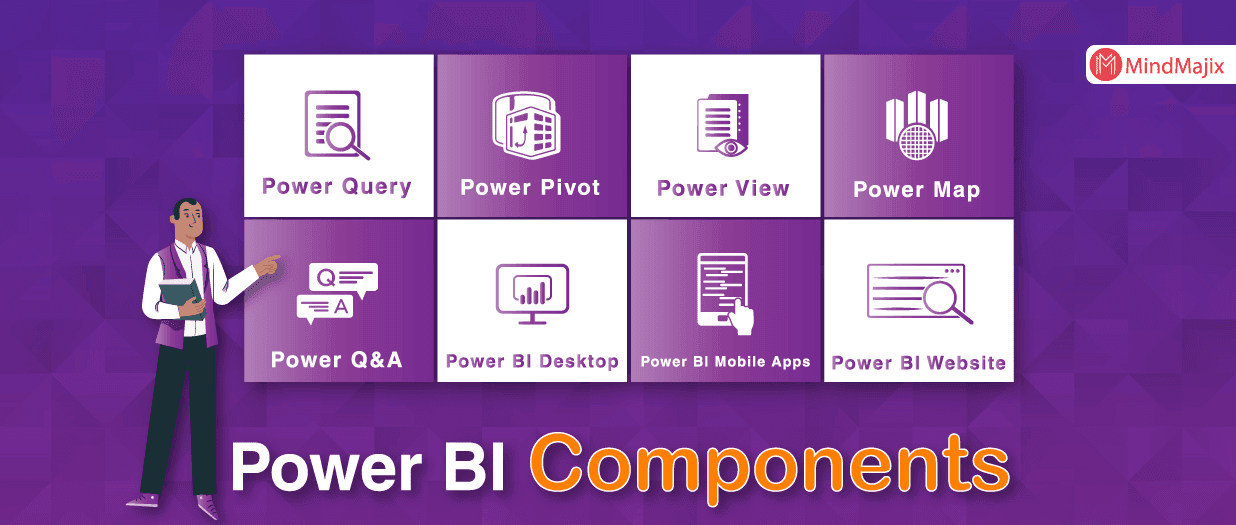
Power BI components are:
Component #1 - Power BI Desktop
This component is the first and foremost in the Power BI architecture as this is a free software through which one can easily connect to various data sources, get data, transform it and see the transformed data in their desktops. One can also create their own graphics and images which can be shared within the organization. This component is seen as the primary element and is used widely.
Component #2 Data Sources
Data Sources of Power BI are nothing but the sources from which data are collected either by importing them or by planting a live service to get the data. In both ways, the data received are only compressed versions as the storage space in Power BI is limited. However, Power BI supports only certain data sources, and they:
- Online Services like SharePoint Online List, Power BI Service, Microsoft Exchange Online, Dynamics 365 (online), Salesforce reports, and many more.
- Databases of SQL Server Analysis Services, Sybase, Google BidQuery, Snowflake, Oracle, Access, and many more.
- File Types like JSON, XML, Excel, txt/CSV, and other Share point folder type files are all supported by Power BI.
- Components of Azure like Azure SQL Database, Azure Table Storage, Azure Analysis Services Database (Beta), and many more are all also accepted by Power BI.
Component #3 Power BI Service
This service is important as this is the online platform where the transformed data and reports are all shared and published in Power BI Desktop. This is a service that follows the protocols of On-Cloud services along with a web-based platform. By using Power BI Service, one can also create dashboards that give other names to Power BI Service like Power BI Web Portal, Power BI Suite, and Power BI Workspace. Apart from these functions it also helps the users by providing natural language Q&A and also alerts for updates and other new upgrades. The user can access Power BI Services in the Free or Pro or Premium versions.
Component #4 Power BI Gateway
This is necessary as these gateways help the users to get their on-site data sources without actually transferring the data in the most secure manner. By using these gateways, the user can transfer the data to On-premise services and also to Microsoft Cloud Services like Power BI, PowerApps, Azure Logic Apps, Microsoft Flow and etc.
Component #5 Power BI Report Server
All those users who have a Power BI Premium license can make the best use of Power BI Report Server which enables them to share and transfer reports, data, and dashboards in the most secure manner, both inside and outside the organization.
Component #6 Power BI Embedded
This component is present only in Azure’s On-premises Service. The function of this component is to provide APIs which can be used by the users to have their reports and dashboards embedded in their custom applications.
Component #7 Power BI Mobile Apps
This helps the users to access the data from their mobile devices themselves. Power BI works on android, iOS, and even on Windows.
Component #8 Power BI Query
This is a component that enhances data connectivity by allowing the users to grab and redesign the data that are spread across various platforms and data sources, just to meet their business’s requirements. SDK is the connector, which allows even its 3rd party connectors to develop their own data connectors and this is the connector that Power BI Query uses for its function.
Component #9 Power Pivot
This can be accessed from an Excel Workbook and can be used as the element for building a data model. It can also be used as a storage space where data is stored after compressing it to the maximum. The stored data can be calculated and aggregated and can be loaded into Power Pivot either on its own or with the help of Power Query. This is also similar to that of SSAS [SQL Server Analysis Services] of the tabular model.
Component #10 Power View
This component uses the data model of Power Pivot just to offer a ‘drag-and-drop function which helps the users to easily develop various visualizations in their Excel workbooks. These visualizations are also interactive in nature.
Component #11 Power Maps
These maps are used to highlight the differences present in the data or visual data. These differences are shown with the help of colors and their intensity of shades. On the whole, Power Maps provide a Data Visualisation Tool which has the properties of a 3D geospatial tool.
Component #12 Power Q&A
This component enables the users to use their natural language to ask a question and also to receive an answer to their questions.
Component #13 Power BI.com Website
This website can be used as a host or as a cloud to store the analyzed data that is shared on the web.
Power BI’s components are supported by many users because they can be used separately and as well as in combinations. Its flexibility increases its efficiency and also supports users with big and small data handling and sharing.
| Want to be part of the Power Real-Time Environment? then Practice Power BI Interview Questions and Answers |
Power BI Components in Excel:
- Though Power Query is inserted in Excel 2016, it is suitable to use in Excel 2010 and Excel 2013 as their add-ins are present in Power Query, by default.
- In Excel 2010, Power Pivot is used as an add-in but in Excel 2013, Power Pivot became an embedded feature for Excel.
- Power View is present only in Excel 2013 and that too is an add-in.
- Power Map is available in Excel 2013 as an add-in while it is placed in Excel 2016 as an important tool that enables the ‘3D maps’ function.
- However, Power Q&A; functions without the help of add-ins or installations and works on top of the other Power BI’s models.

Conclusion:
Power BI is an important and significant tool that enables users to collect, handle, modify, and share data through a cloud system. Its various components act with different features, adding to the overall performance of Power BI. However, these components can be mashed up to increase their efficiency and functionalities. One such example is Power BI Desktop, which is a compilation of Power Pivot, Power Query, and Power View. Therefore, if Power BI is a dominant tool in the business world, then its Power BI Components are equally important to its success because when put together, they make Power BI.
 On-Job Support Service
Online Work Support for your on-job roles.

Our work-support plans provide precise options as per your project tasks. Whether you are a newbie or an experienced professional seeking assistance in completing project tasks, we are here with the following plans to meet your custom needs:
- Pay Per Hour
- Pay Per Week
- Monthly
| Name | Dates | |
|---|---|---|
| Power BI Training | Aug 01 to Aug 16 | View Details |
| Power BI Training | Aug 04 to Aug 19 | View Details |
| Power BI Training | Aug 08 to Aug 23 | View Details |
| Power BI Training | Aug 11 to Aug 26 | View Details |

Pooja Mishra is an enthusiastic content writer working at Mindmajix.com. She writes articles on the trending IT-related topics, including Big Data, Business Intelligence, Cloud computing, AI & Machine learning, and so on. Her way of writing is easy to understand and informative at the same time. You can reach her on LinkedIn & Twitter.


