- Power BI Slicers - A Definitive Guide
- How to Download and Install Power BI Desktop
- How to Share Reports in Power BI for Mobile
- Power BI Architecture: A Complete Tutorial with Diagram
- Power BI Career Opportunities
- What are the Components of Power BI?
- DAX In Power BI - Learn Power BI DAX Basics
- Power BI Tutorial - Power BI Desktop Tutorial
- Power BI Interview Questions and Answers
- Power BI Services and Benefits
- Power BI Visuals List and Chart Types
- Power Apps Interview Questions and Answers
- Power Apps Tutorial
- What is Power BI? The Definitive Guide
- What is Power Apps?
- Top 15 Data Visualization Tools
- Power BI Projects and Use Cases
- Power Pivot vs Power Query
- Power BI Heatmap
- Power BI Gateway - Power BI Gateway Architecture
- Power BI vs SSRS - What are the Differences
- Power BI Dashboards vs Reports - Which is better?
Undeniably, insights fuel every business's growth in all possible ways. Business Intelligence tools (BI) are pivotal in generating insights and analytics from business data. You can get answers to all your business questions in the form of reports, charts, analytics, graphs, etc., with the help of BI tools. In a way, BI tools connect data and decision-making very closely. So, you can make informed decisions using the data provided by BI tools and become competitive in the market as well.
Power BI and QlikView are business intelligence (BI) tools that convert data into helpful insights and provide real-time process updates. The process could be a production, business, or any other.
This blog compares Power BI and QlikView more deeply regarding their features, advantages, drawbacks, etc.
Power BI Vs QlikView - Topics of Content:
What is Power BI?
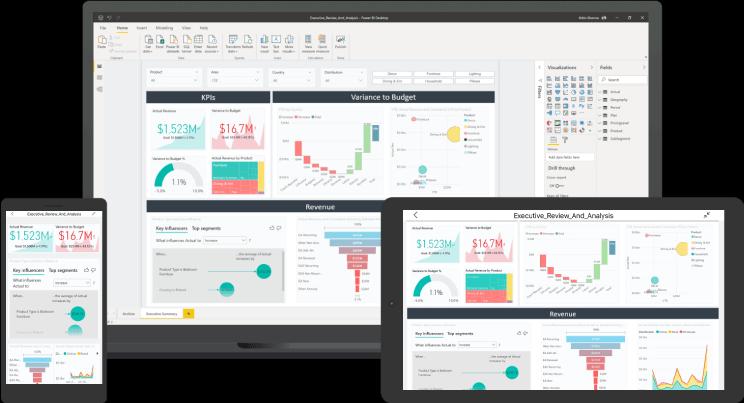
Power BI is one of the BI tools that effectively connects, models, and visualises data. Know that Power BI can create reports and insights based on KPIs in the business processes, allowing users to make confident decisions. Also, this tool allows users to share analytics and insights with other users. Data can be analyzed and processed accurately in Power BI while respecting security and consistency. It is the single platform from which you can get pixel-perfect reports, semantic models, and fixed layouts.
Who uses Power BI?
Power BI is widely used across many industries such as energy, retail, manufacturing, healthcare, and media. It is also used in IT companies, transportation, life sciences, finance, resource management, and many more. Besides, business users, developers, and analysts use Power BI to track project progress and analyze.
| If you want to enrich your career and become a professional in Power BI, then enroll in "Power BI Training". This course will help you to achieve excellence in this domain. |
Key features of Power BI:
Let’s see what the features of Power BI in below:
Analytics with AI power: Be it an individual or team, you can generate real-time analytics using Power BI. The AI capabilities of Power BI allow even non-technical employees to prepare data, build ML models, and generate insights efficiently. In fact, Power BI analyses both structured and unstructured data. Power BI analyses all types of data – no matter whether it is text or image data.
Integration: Power BI offers more than 500 extensions through which Power BI connects with both on-premises and cloud resources. You can get helpful insights with the support of data connectors and excel integrations. Here, the insights could be the eye-catching visuals. Insights help to explore data and make informed decisions in a better way. Not just this, you can view the analytics of the processes that are in active mode. Integration with Azure helps to analyse data and get deeper insights into business processes. On similar tracks, integration with power apps and Power automate helps build business applications and automate workflows.
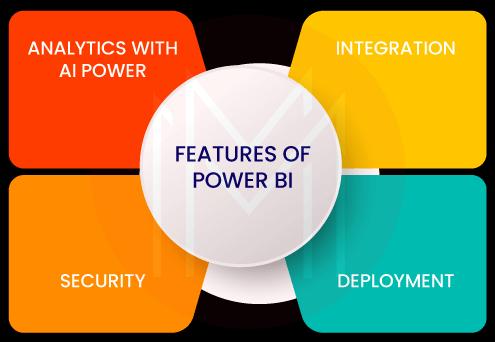
Security: Power BI secures data through various mechanisms such as sensitive labeling, end-to-end encryption, and real-time access monitoring. And it allows employees to work from anywhere through persistent data protection mechanisms. With the Microsoft cloud app security portal, you can identify the risky behavior patterns in the business processes. It helps to analyse them and take remedial actions. Additionally, tools such as Azure private links, Azure virtual networks, and service tags help significantly increase data security in Power BI.
Deployment: Power BI quickly moves data from development to deployment using deployment pipelines. Essentially, these pipelines are used to develop and test power BI content before users use them. Know that deployment consists of three stages – development, testing, and production. During the development stage, content is designed and created. After that, pipeline testing is done with volumes of data. The finalised content is shared with end-users in the production stage for usage.

Advantages of Power BI:
Let’s now know the advantages of Power BI:
- With Power BI, anyone in your company can make informed decisions. Simply put, it is a tool for all types of users.
- As Power BI can break down high-level data into smaller-level data, you can view the granular forms of the data easily.
- You can create interactive data visualisations in the Cloud and share them with other users
- With Power BI, you can create configurable reports applying quick filtering methods
- You can make historical data comparisons and track progresses in the processes accurately.
- You can generate actionable insights even from real-time data.
| CheckOut: "Power BI Projects" |
Drawbacks of Power BI:
No wonder Power BI has a few drawbacks. Let’s look at them below:
- Power BI doesn’t support the macOS version for desktops
- Power BI Reports Server is bundled with SQL Server Enterprise license. So, you cannot purchase the Report Server separately.
- On-premise Power BI doesn’t support Azure AD or claims-based authentication platforms.
- Power BI doesn't work well when tables have complex relationships between themselves.
- There are a few limitations that exist while configuring visuals in Power BI
- DAX is the language used to manage data in Power BI, which creates complexity.
- The free version of Power BI cannot handle Data with more than 2 GB. But, you can use commercial versions to do so.
What is QlikView?
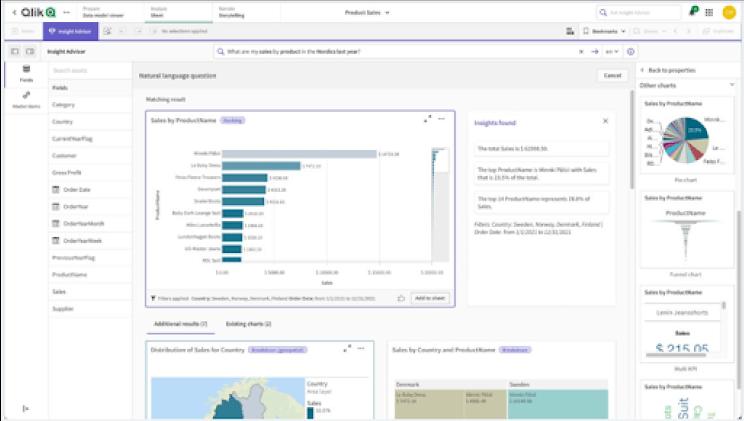
QlikView is nothing but a BI tool and is one of the classic products of Qlik. With its interactive dashboards and analytic Apps, QlikView provides answers to businesses for their business questions. Considering QlikView, Pixel-perfect reports and customisable dashboards are its key features. And QlikView offers natural language analytics, embedded analytics, predictive analytics, reporting, mobile analytics, and alerting by following the agile data discovery approach. Besides, QlikView provides a competitive edge to its users and significantly reduces costs.
Who uses QlikView?
Generally, QlikView is used across IT and services, insurance, finance, social media, education, helpdesk management, and many more. Mainly, the companies that have more than 1000 employees use QlikView. It is helpful for Business users, analysts, and data scientists. Business users can perform informed decisions based on AI-generated insights, natural language interaction, and AutoML predictions. For data scientists, QlikView supports expanding models and making interactive predictive calculations.
| Do you want to get certified and build your career in Qlikview? Then enroll in "Qlikview Online Training" this course will help you to achieve excellence in this domain. |
Key features of QlikView
QlikView offers many key features to its users. Let’s have a look ahead.
Associative Analytics Engine: This engine is designed for making interactive data exploration and analysis. No single data would be left while making an analysis using this engine, which is the outstanding feature of this engine. As a result, it identifies all the hidden insights from the data. Moreover, it allows developers to create and deploy interactive dashboards and analytic applications.
Augmented Analytics: QlikView’s augmented analytics allows analysis by all users – no matter their skill level. With Augmented Analytics, QlikView prepares data effectively, generates actionable insights, and makes quick visualisation. The dashboards display charts, tables, graphs, and other visual aids for users. In particular, QlikView uncovers hidden insights that no one would have imagined. Augmented analytics can automate tasks and perform conversational analytics. Thus, any user can interact with QlikView efficiently.
Insight Advisor: It usually auto-generates advanced analyses and insights. Insight Advisor supports natural language interactions using search and conversational analytics. Based on the results of this interaction, Insight Advisor refines the data visualisations and then adds them to dashboards. Further, it also provides visual analytics and advanced analyses such as correlation, clustering, forecasts, etc.
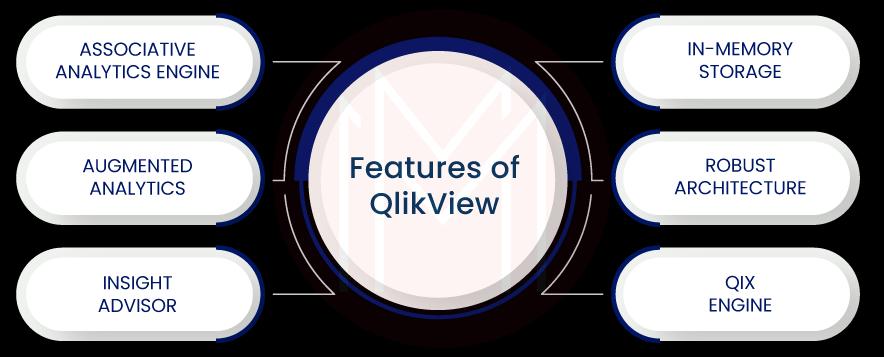
In-memory storage: QlikView offers in-memory architecture for data storage using RAMs. Therefore, you can load data from different sources into RAM and retrieve them anytime. For instance, if the QlikView client wants to fetch data, it quickly takes data from in-memory.
Robust Architecture: QlikView is designed based on a robust architecture comprising components such as client, publisher, server, etc. These components help to scale data and balance loads. As a result, QlikView ensures the consistent functioning of businesses at any scale and data type.
QIX Engine: This engine helps to highlight the data relevant to the selected fields in reports by changing colors. In return, it simplifies the analysis of reports.
| Also, CheckOut: "QlikView Architecture" |
Advantages of QlikView
Let’s take a look at the advantages of QlikView as below:
- Without support from IT teams, users can work on QlikView since it is a self-service tool.
- No doubt that leveraging and maintaining QlikView is simple and hassle-free
- You can make quick data interpretation and analysis through the visual and dynamic dashboards
- With the user-friendly dashboards, you can get valuable reports and analytics
- With collaboration tools, data sharing is simplified in QlikView
- QlikView provides quick delivery – no matter how many requests are made simultaneously.
Drawbacks of QlikView
- As you can see below, QlikView also has a few drawbacks. Let's check them out.
- QlikView doesn’t offer the latest drag-and-drop options. That’s why it is usually slower in functioning.
- With QlikView's steep learning curve, beginners have difficulty learning the tool.
- QlikView doesn’t support all the encryption forms alongside security protocols such as TLS 1.2 and TLS 1.3
- It requires ample storage space. Because of this, operations in QlikView are usually computationally intensive.
- Real-time analysis is not efficient in QlikView
- Exporting data is not a smooth process in QlikView
- Pricing is costlier compared to other tools since users need to purchase additional tools.
| Related Article: "Tableau vs Power BI" |
Key differences between Power BI and QlikView
Let’s discuss the differences between Power BI and QlikView as follows:
Ease of learning: Know that learning Power BI is a simple process. On the other hand, Power BI's steep learning curve demands data science knowledge.
Ease of Operation: Working with Power BI is simple since it has easy drag-and-drop tools. In a way, Power BI could be considered the advanced version of excel. Contrarily, working with QlikView requires programming skills. Power BI's operational speed is good, whereas QlikView's speed depends on the RAM size.
Data Management: Data management is good in Power BI when compared with QlikView. Power BI connects with all Microsoft technologies and external platforms such as MySQL, Google Analytics, Oracle, Facebook, etc. On the other side, QlikView connects with the cloud services such as Azure, Twitter, MS office, Hadoop, SAP, etc. Especially, the in-memory storage increases the speed of data access in QlikView more than in Power BI. In other words, QlikView is good in data access.
Analytics: Although both the tools are good in Analytics, Power BI is considered better because of its mobile exploration and intelligent data recovery capabilities.
Integration: Power BI easily integrates with business applications and system management tools such as Microsoft Dynamics, Google Analytics, Salesforce, Adobe Analytics, GitHub, and so on. On the other hand, QlikView needs extensive APIs to integrate with them.
Pricing: Power BI’s basic version is offered at free-of-cost, but the Pro and premium versions are the commercial versions. Similar to Power BI, the basic version of QlikView is offered free of cost. However, commercial versions of QlikView are costlier than Power BI.
Below is the comparison table briefs the differences between Power BI and QlikView in certain aspects.
| Features | Power BI | QlikView |
| Learning process | Excel knowledge is enough for learners | Data science background is required |
| Analytics | Excellent | Good |
| Deployment | Cloud Desktop Windows Mobile Android | Cloud Desktop Windows,macOS On-premise Windows and Linux Mobile - Android and iPhone |
| Alternatives | Fuel, Iridium BI, Pro workflow, etc. | Netsuite,Odoo,RepiarQ,etc. |
Conclusion:
At a glance, Power BI is good in ad-hoc reporting, access control, analytics, security, mobile capabilities, and embedding. On the other hand, QlikView is good in customisable dashboards, report sharing, collaboration, drill-down analysis, and formatting capabilities. Moreover, Power BI will be helpful for all users, whereas QlikView will be helpful for users with a bit of data science background. In certain aspects, Power BI is better than Qlikview. On similar tracks, QlikView is better than Power BI in certain aspects. Ultimately, it is up to the users who have to decide on the right tool to help meet their requirements.
 On-Job Support Service
Online Work Support for your on-job roles.

Our work-support plans provide precise options as per your project tasks. Whether you are a newbie or an experienced professional seeking assistance in completing project tasks, we are here with the following plans to meet your custom needs:
- Pay Per Hour
- Pay Per Week
- Monthly
| Name | Dates | |
|---|---|---|
| Power BI Training | Jul 25 to Aug 09 | View Details |
| Power BI Training | Jul 28 to Aug 12 | View Details |
| Power BI Training | Aug 01 to Aug 16 | View Details |
| Power BI Training | Aug 04 to Aug 19 | View Details |