
- Power BI Slicers - A Definitive Guide
- How to Download and Install Power BI Desktop
- How to Share Reports in Power BI for Mobile
- Power BI Architecture: A Complete Tutorial with Diagram
- Power BI Career Opportunities
- What are the Components of Power BI?
- DAX In Power BI - Learn Power BI DAX Basics
- Power BI Tutorial - Power BI Desktop Tutorial
- Power BI Interview Questions and Answers
- Power BI Services and Benefits
- Power BI Visuals List and Chart Types
- Power Apps Interview Questions and Answers
- Power Apps Tutorial
- What is Power BI? The Definitive Guide
- What is Power Apps?
- Top 15 Data Visualization Tools
- Power BI Projects and Use Cases
- Power Pivot vs Power Query
- Power BI Vs QlikView
- Power BI Heatmap
- Power BI Gateway - Power BI Gateway Architecture
- Power BI vs SSRS - What are the Differences
In the current market, data analytics has become a crucial aspect of businesses across various industries. As a result, there has been a growing demand for data visualization tools that can help organizations make data-driven decisions. Power BI, a data analytics tool developed by Microsoft, has gained immense popularity in recent years. Power BI offers two distinct data visualization tools: Power BI Dashboard and Power BI Report. In this post, we will explore the differences between these two tools and discuss their present market demand.
Do Power BI Dashboards and Reports are the same thing? The answer to this question is a partial Yes! Dashboards depend on reports but they are definitely not the same thing. When you ask the experts about the same, they will give you certain differences. For example – reports are tabular and detailed whereas dashboards are great for visualization. However, the actual differences are much more trivial than the apparent definitions. By the end of this blog, you will be able to take your side in the debate of Power BI Dashboards vs Reports. Let us dive in!
| Table of Content - Power BI Dashboards vs Reports |
What is Power BI Dashboard?
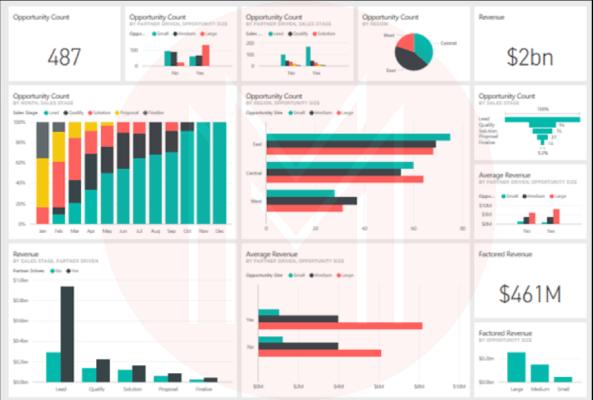
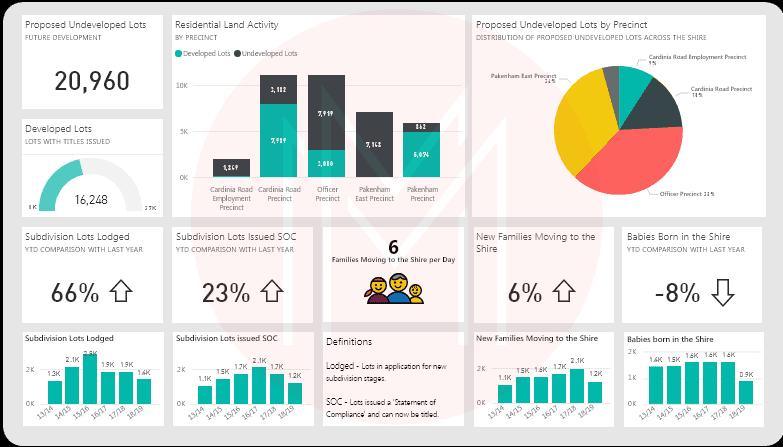
A Power BI Dashboard is a single page, often called a canvas, which uses visualizations to tell a story. Since it is limited to one page, a well-designed dashboard contains only the most important elements of a story.
Following are some Power BI Dashboard examples with data:
- Airport authority Performance Dashboard
- Customer analysis Dashboard
- Global Superstore Dashboard
| If you want to enrich your career and become a professional in Power BI, visit MindMajix and Enroll in the "Power BI Training" and Certification Course. |
What are the advantages of a Power BI Dashboard?
The following are some advantages of a Power BI Dashboard:
- Artificial Intelligence: It allows AI-based image recognition, and text analytics, creates machine learning models, and integrates with Azure Machine Learning.
- Allows analysis of big data: It helps in tackling big volumes of data and helps to reduce the time taken to get insights.
- Personalized dashboards and interactive reports: It is customizable, intuitive, and interactive rather than being instead of one-size-fits-all.
- Access to information in real-time: It gets updated in real-time whenever data is pushed or streamed while displaying and updating the visuals with the latest data and information.
- Excel integration: Businesses still use Excel for analytics and reports. Thus, it benefits businesses preferring to continue with Excel and allows seamless integration with Excel.
- Profuse data sources support and integration: It offers seamless integration with Microsoft products, databases like SQL, Oracle Database, IBM, Amazon Redshift Google BigQuery, and other Power BI databases, and various online services like Salesforce Reports, Google Analytics, Adobe Analytics, and Facebook.
- Interactive UI/UX features: Its easy drag-and-drop functionality with features to copy all formatting across visualizations.
- Customizable security features: It is possible to set up row-level-security filters to ensure that viewers can only see the relevant data, preventing data from being misused by mitigating the data breach risk.
- Cost-effective: It is less expensive and affordable especially for small and mid-sized businesses compared to other business intelligence and analytics tools.
- Monthly updates: Microsoft brings regular monthly updates and offers a Power BI community platform where users can provide suggestions. It listens and implements the most frequently asked-for functionality by users.
[Related Article: Power BI Tutorial]
What is a Report?
Power BI reports are a multi-perspective view of a dataset. They come with visuals representing findings and insights from that dataset. A report can either have single visual or many pages full of visuals.

What are the advantages of a Power BI Report?

The following are the advantages of a Power BI Report:
- It provides you with multiple perspectives of the data model.
- It creates summary pages.
- It provides safe interaction with data.
- It saves your changes
- It allows you to filter, export, and view data.
Key differences - Power BI Dashboards vs Reports
Let us see the difference between the Dashboard and the Report with the help of the following table:
|
Items |
Dashboard |
Report |
|
Number of pages |
One page |
One or more pages |
|
Data Sources |
Dashboards are built based on multiple data tables connected in one or more ways. |
Reports are generally created from a single data set table with no relationship to other tables. |
|
Visualization |
Dashboards always concentrate on building insights into the data by using attractive visuals, graphs, charts, etc. |
Reports are not concentrated on the visualization part of the data. Rather, it looks to create summary pages. |
|
Available in power bi desktop |
No |
Yes |
|
Filters and Slicers |
Since dashboards are limited to a single page, we cannot use filters and slicers |
We can filter and slice the data using slicers and many filtering options like cross-filtering, visual-level filtering, and page-level filtering. |
|
User Interactivity |
Dashboards are pinned to the page so the reader can just read through the data. |
Reports are created with filters and slicers so the user can interact with the data set. |
|
Applications |
Yes |
Yes |
|
Q&A Feature |
Yes |
No |
|
Alerts |
Dashboards can create alerts to email when a specific condition or criteria is met, or a limit is crossed. |
Reports cannot create alerts to email when a specific condition or criteria is met or a limit is crossed. |
|
Subscribe |
Yes |
Yes |
|
Data Set View |
We cannot see the source data with dashboards because the reader only gets the single-page information. |
Reports can see tables, data sets, and data fields in detail, i.e., raw data. |
Which is better? Power BI Dashboards vs Reports
Based on the comparison in the debate of Power BI dashboards vs Reports, several factors play a significant role. These include the number of pages, user interactivity, applications, visualization, availability in BI desktop, data sources, data set view, etc. Each has its pros and cons. Research thoroughly about the two and choose according to your requirements.
[Related Article: What is Power BI?]
Power BI Dashboards vs Reports FAQs
1. How do I convert a report to a Power BI Dashboard?
Here is how we can convert a report to a Power BI Dashboard:
- Step-1: Open any Power BI report which visuals you want to display in Dashboard.
- Under Workspace > Go to Reports Tab > Open Report
- Step-2: Now hover the mouse on that visual that you want to add to Dashboard
- Step-3: Now click on the Pin icon and follow the below steps: -
- Existing dashboard: Select if you want to add this visual to the existing dashboard.
- New dashboard: Add into the new dashboard.
- Dashboard name: Assign a new name or select the existing dashboard name
- Step-4: Now pin another visual & select Existing dashboard, because when we pinned the first visual that time we create a new dashboard, therefore is no need to create a new one.
- Step-5: As of now we successfully pinned two visuals to the “HR dashboard” dashboard. To view the dashboard, open your report workspace and click on the dashboard Tab & open your dashboard.
- Step-6: Dashboard view.
- Step-7: You can resize the dashboard visual
2. What are the three benefits of a Power BI Dashboard?
The following are three advantages of a Power BI Dashboard:
- Artificial Intelligence: It allows AI-based image recognition, and text analytics, creates machine learning models, and integrates with Azure Machine Learning.
- Allows analysis of big data: It helps in tackling big volumes of data and helps to reduce the time taken to get insights.
- Personalized dashboards and interactive reports: It is customizable, intuitive, and interactive rather than being instead of one-size-fits-all
3. Can we create Dashboard without Report?
Yes, you can!
4. How do I move my Reports to the Dashboard?
- Sign in to Google Analytics.
- Navigate to your view.
- Open Reports.
- Click CUSTOMIZATION > Dashboards
5. What is the best tool to create a Dashboard?
SEMrush, ClickUP, and Datapad are some of the best tools to create a Dashboard.
6. What are the disadvantages of Dashboards?
Some advantages of Dashboards are slower performance and the inability to handle larger data sets under extreme cases.
7. How do I create a Dashboard on the Power BI desktop?
You can create Dashboards on the Power BI Desktop using the following steps:
- Step 1: Download Power BI Desktop
- Step 2: Install the Power BI Desktop
- Step 3: Import Data to Power BI
- Step 4: Format the Data in Power BI
- Step 5: Create visualizations for your Power BI Dashboards
[Related Article: Power BI Interview Questions]
Conclusion
We have discussed detailed differences between Dashboards and Reports. This difference will help you decide which one you should concentrate on. It eventually boils down to what kind of information your authority requires. If you wish to have detailed information on the data, you can go for reports. And if you wish to see a single-page summary, you can go for reports.
As the demand for data analytics continues to grow, tools like Power BI Dashboard and Report are expected to become even more popular. The key benefit of using these tools is that they enable businesses to visualize their data in a way that is easy to understand and interpret. With Power BI Dashboard, users can quickly identify trends and patterns in their data, whereas Power BI Report allows users to drill down into their data to gain deeper insights.
In the future, we can expect to see more advanced features being added to Power BI, making it an even more powerful data analytics tool. As more businesses adopt data-driven decision-making, tools like Power BI will become an integral part of their operations. By understanding the differences between Power BI Dashboard and Report, businesses can choose the tool that best meets their needs and help them achieve their data visualization goals. you can also enroll in "Power BI Training" and get a certification.
 On-Job Support Service
Online Work Support for your on-job roles.

Our work-support plans provide precise options as per your project tasks. Whether you are a newbie or an experienced professional seeking assistance in completing project tasks, we are here with the following plans to meet your custom needs:
- Pay Per Hour
- Pay Per Week
- Monthly
| Name | Dates | |
|---|---|---|
| Power BI Training | Aug 01 to Aug 16 | View Details |
| Power BI Training | Aug 04 to Aug 19 | View Details |
| Power BI Training | Aug 08 to Aug 23 | View Details |
| Power BI Training | Aug 11 to Aug 26 | View Details |

Madhuri is a Senior Content Creator at MindMajix. She has written about a range of different topics on various technologies, which include, Splunk, Tensorflow, Selenium, and CEH. She spends most of her time researching on technology, and startups. Connect with her via LinkedIn and Twitter .


