
- Power BI Slicers - A Definitive Guide
- How to Download and Install Power BI Desktop
- How to Share Reports in Power BI for Mobile
- Power BI Career Opportunities
- What are the Components of Power BI?
- DAX In Power BI - Learn Power BI DAX Basics
- Power BI Tutorial - Power BI Desktop Tutorial
- Power BI Interview Questions and Answers
- Power BI Services and Benefits
- Power BI Visuals List and Chart Types
- Power Apps Interview Questions and Answers
- Power Apps Tutorial
- What is Power BI? The Definitive Guide
- What is Power Apps?
- Top 15 Data Visualization Tools
- Power BI Projects and Use Cases
- Power Pivot vs Power Query
- Power BI Vs QlikView
- Power BI Heatmap
- Power BI Gateway - Power BI Gateway Architecture
- Power BI vs SSRS - What are the Differences
- Power BI Dashboards vs Reports - Which is better?
We all know that Power BI is one of the best BI tools, and many organizations are using this tool to generate reports and dashboards to make effective business decisions.
Before using the Power BI services and features, you should know about the Architecture of Power BI. Because, you should know how the Power BI services, components are being used to transform the data, create the reports and dashboards.
| Want to become a Master in Power BI? Then Enrol here for Microsoft Power BI Training Online |
In this blog, we are going to provide detailed information about the Power BI Architecture and its components.
Let’s get started!
Microsoft Power BI Architecture:
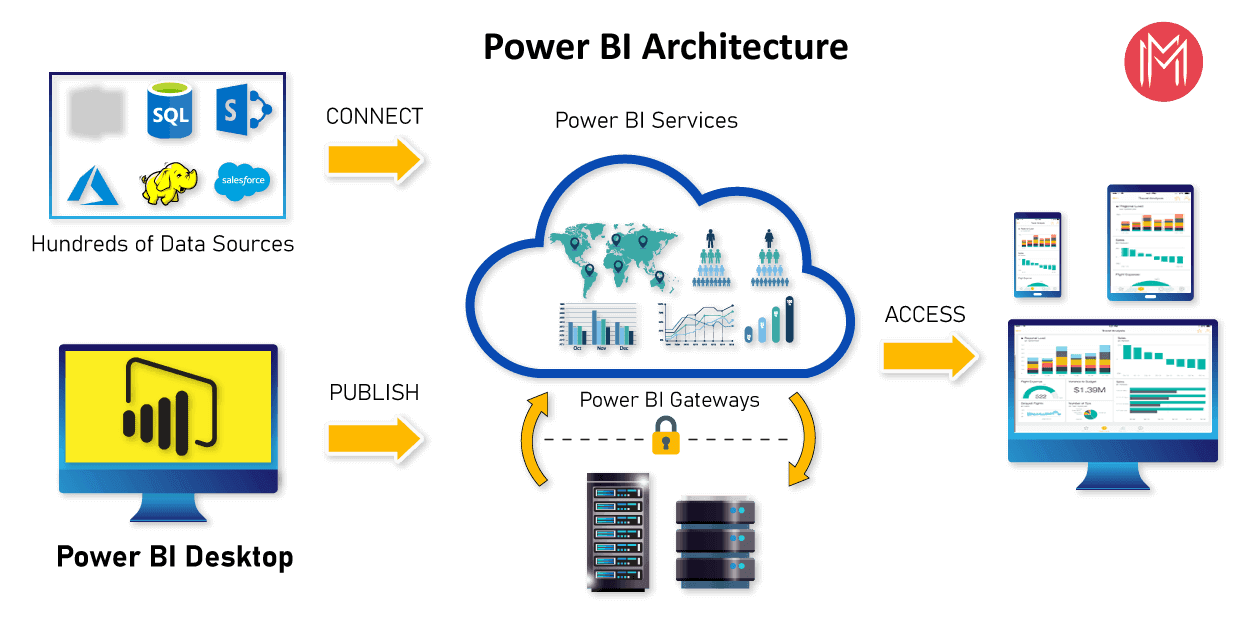
Power BI is a business platform that includes several technologies to work together. It delivers outstanding business intelligence solutions. Power BI Architecture contains four steps.
Let us discuss these four steps giving insightful information about each one of them.
- Data Integration
- Data Transforming
- Report & Publish
- Creating and Dashboard
1. Data Integration:
Data is extracted from different sources which can be different servers or databases. The data from various sources can be in different types and formats. If you import the file into the Power BI, it compresses the data sets up to 1GB, and it uses a direct query if the compressed data sets exceed more than 1GB. Then the data is integrated into a standard format and stored at a place called a staging area. There are two choices for big data sets. They are as follows.
- Azure Analytics Services
- Power BI premium
2. Data Transforming:
Integrated data is not ready to visualize data because the data should be transformed. To transform the data, it should be cleaned or pre-processed. For example, redundant or missing values are removed from the data sets. After data is pre-processed or cleaned, business rules are applied to transform the data. After processing the data, it is loaded into the data warehouse.
| Related Page: Know about Power BI Slicer |
3. Report & Publish:
After sourcing and cleaning the data, you can create the reports. Reports are the visualization of the data in the form of slicers, graphs, and charts. Power BI offers a lot of custom visualization to create the reports. After creating reports, you can publish them to power bi services and also publish them to an on-premise power bi server.
4. Creating Dashboards:
You can create dashboards after publishing reports to Power BI services, by holding the individual elements. The visual retains the filter when the report is holding the individual elements to save the report. Pinning the live report page allows the dashboard users to interact with the visual by selecting slicers and filters.
These are basic steps in the Power BI Architecture. Now we are going to discuss components of Power BI and how they work together in the Power BI Architecture.
| To know more information about Power BI, go through our Power BI Desktop Tutorial. |

Components of Power BI Architecture:
Let us learn the components of Power BI Architecture in detail. Here is the list of components.
These components play an important role in delivering the Power BI capabilities. Now, let’s discuss the Components of Power BI Architecture.
#1. Data Sources

Power BI can supply information from different online sources and file types. Import the information into the Power BI or establish a live service to receive the information. If you import the file into the Power BI, it compresses the data sets up to 1GB and, uses a direct query if the compressed data sets exceed more than 1GB. Here is the list of Data Sources supported in Power BI.
Here is the list of Data Sources supported in Power BI.
- File Types: Power BI supports XML, txt/CSV, Excel, JSON, and Share point folder type files.
- Database: It supports SQL Server Analysis Services Database, SAP HANA Database, SQL Server Database, SAP Business Warehouse server, Access Database, Google BigQuery (Beta), Amazon Redshift, Snowflake, Impala, Oracle Database, IBM Informix database (Beta), Teradata Database, MySQL Database, IBM Netezza (Beta), Sybase Database, PostgreSQL Database.
- Azure: Azure SQL Data Warehouse, Azure Blob Storage, Azure Analysis Services database (Beta), Azure SQL Database, Azure Data Lake Store, Azure Table Storage, Azure HDInsight (HDFS), Azure Cosmos DB (Beta), Azure HDInsight Spark (Beta).
- Online Services: Power BI service, Dynamics 365 (online), Microsoft Exchange Online, Common Data Service (Beta), SharePoint Online List, Visual Studio Team Services (Beta), Dynamics 365 for Financials (Beta), Microsoft Azure Consumption Insights (Beta), Salesforce Objects, Salesforce Reports, Google Analytics, Dynamics 365 for Customer Insights (Beta), GitHub (Beta), appFigures (Beta), comScore Digital Analytix (Beta), Facebook, Kusto (Beta), Planview Enterprise (Beta), MailChimp (Beta), Mixpanel (Beta), QuickBooks Online, Projectplace (Beta).
- Other Services: Hadoop File (HDFS), Vertica (Beta), Web, OData Feed, SharePoint List, Microsoft Exchange, Active Directory, R Script, ODBC, Spark (Beta), Blank Query, OLE DB.
#2. Power BI Desktop

It is free software that enables you to connect, transform and visualize the data on your desktop. You can connect to various data sources with the help of Power BI Desktop and combine the data into a data model. This data model allows you to create a collection of images and graphics that make you share the information within the organization as records. The majority of the users who work on Business Intelligence projects use Power BI Desktop to create and share their reports with others.
| Visit here to know Power BI Visualization Types with Examples |
#3. Power BI Service

Power BI Service is an On-Cloud service with a web-based platform and used to share and publish the reports made on Power BI Desktop. It collaborates the data with other users and creates dashboards. Power BI Service is also called “Power BI Workspace”, “Power BI Web Portal”, and “Power BI Site”. Power BI Service offers wonderful features like alerts and natural language Q&A.
It is available in three versions. They are as follows:
- Premium version
- Pro version
- Free version
#4. Power BI Report Server

Power BI Report Server is similar to the Power BI Service. It is an On-Premises server platform. Using Power BI Report Server, organizations can secure their data. It enables the users to create reports and dashboards and allows you to share the reports with other users or organizations with proper security protocols. To use this service, you need to have a Power BI premium license.
#5. Power BI Gateway

Power BI Gateway is used to maintain fresh information by connecting to your on-site data sources without transferring the data. It provides secure data and allows you to transfer the data between Microsoft cloud services and on-premise services. Microsoft cloud services include PowerApps, Power BI, Azure Analysis Services, Microsoft Flow, and Azure logic apps. By using a gateway, organizations can maintain the databases and other data sources securely in cloud services.
| Related Article - What is Power BI Services and their Benefits |
#6. Power BI Mobile Apps

Using Power BI Mobile Apps, you can stay connected with on-premises data from anywhere. Power BI apps are available for iOS, Windows, and Android platforms.
#7. Power BI Embedded

Power BI Embedded is an On-premises service in Azure. It offers APIs for embedding the reports and dashboards into custom applications. Till now, we have been discussing major components of the Power BI, and now, we will talk about the remaining components of Power BI as well.
Here is the list of the remaining Power BI Components.
#8. Power BI Query

Power Query is the data connectivity that enables the business users to access the data which is stored in multiple data sources and redesign it to satisfy their business requirements. Power Query offers custom connectors SDK so that third-party users can create their data connectors.
| Visit here to know about Power BI Desktop Installation |
#9. Power Maps

Power BI Query is used to display how the values vary in proportion across the region. It also shows differences with the shadings that range from dark to light. It offers a 3D geospatial Data Visualization Tool.
#10. Power Pivot

Power Pivot is an element that stores the information in memory and allows highly compressed data storage and incredibly quick aggregation and calculation. It is also accessible as part of Excel and can be used within an Excel workbook to build a data model. Power Pivot can load information on its own, or Power Query can load information into it. It is highly comparable to the tabular model of SSAS (SQL Server Analysis Services), which is like a Power Pivot server-based variant.
#11. Power View
Power View offers interactive visualization that enables a drag-and-drop interface for users to create visualizations quickly and effectively in their Excel workbooks (using the Power Pivot data model).
#12. Power Q&A

Power Q & A is the feature of Power BI, and it enables you to explore your data in your own words. In other words, you can use natural language and ask a question to get an answer from your data.
| Also Read - Power BI Interview Questions |
Power BI Architecture - Working
We hope that you have understood the individual components of Power BI, and now, you will learn how these components work together. You will have a clear understanding of the Power BI Architecture with the help of the below image.
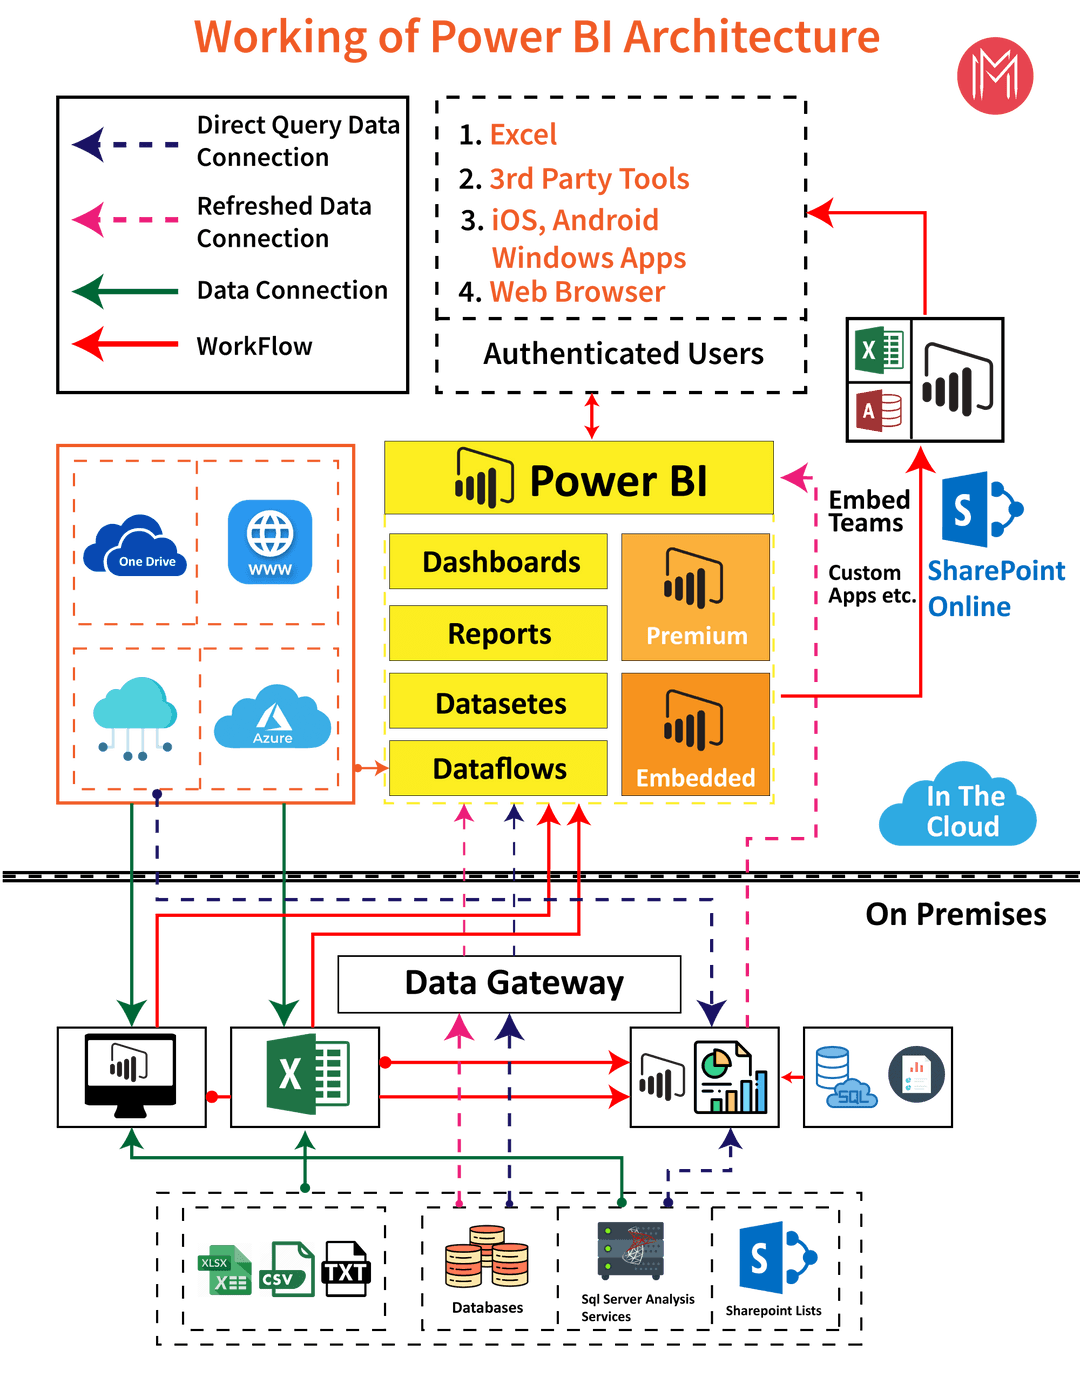
In the above diagram, it is clear that the upper half part represents On-Cloud services, and the lower half part represents the On-Premise services.
If you observe in the top of the image excel, web browsers and other sources are streaming into Power BI components, and they are called data sources. These data sources are authenticated users. Power BI has different data sources like On-Premise, Cloud databases, direct connections, etc.
| Related Blog: Power BI Gateway |
On-Premise:
Power BI Desktop is accomplished with the authenticating, development and publishing tools. You can transfer the data from data sources to Power BI Desktop. And also, it allows users to create and publish reports on the Power BI Report Server or Power BI Service.
Power BI Publisher allows you to publish the Excel workbooks to the Power BI Report Server. Report Publisher and SQL server Data tools help in creating the KPIs, datasets, paginated reports, mobile reports, etc. All kinds of reports are published at the Power BI Report Server, and from there, reports are distributed to the end-users.
On-Cloud:
Power BI Gateway is the essential component in the Power BI architecture. The Power BI Gateway acts as a bridge or secure channel to transfer the data from On-premise data to On-cloud data sources or apps.
Cloud side architecture consists of a lot of components including Power suite having datasets, dashboards, reports, Power BI Premium, Power BI Embedded, etc. Users can embed the dashboards, reports into applications, SharePoint, Teams, etc. There are Cloud data sources and they are connected to the Power BI tools.
Power BI Service Architecture
In the previous section, you have learned how to publish the created reports in the Power BI Service.
Power BI Service enables the users to create and access the reports, dashboards from the client platforms like mobile devices, websites, etc. User needs to interact with the Power BI Service whenever they want to access the data that is created on the Power BI. So, now, we will learn how the Power BI Service works.
Power BI Service Architecture consists of two clusters. The following are the two clusters.
- Front End Cluster
- Back End Cluster
Now, we will discuss the two clusters in detail.
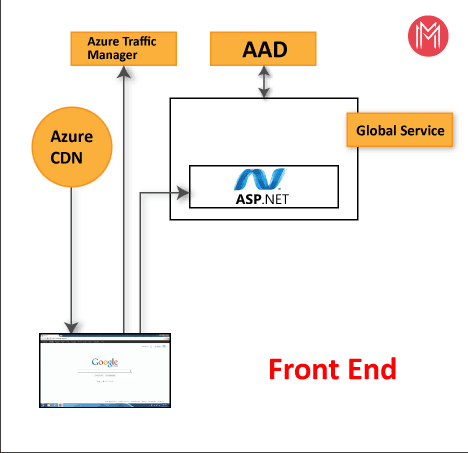
1. Front End Cluster: Front end cluster acts as an intermediate between the back end cluster and the clients. It is also called a Web Front End Cluster. It establishes the initial connection and authenticates the users or clients using the Azure Active Directory. After user authentication, Azure Traffic Manager directs the user requests to the nearest data centers and Azure Content Delivery Network (CDN) allocates the statice files/content to the users or clients based on the geographical locations.
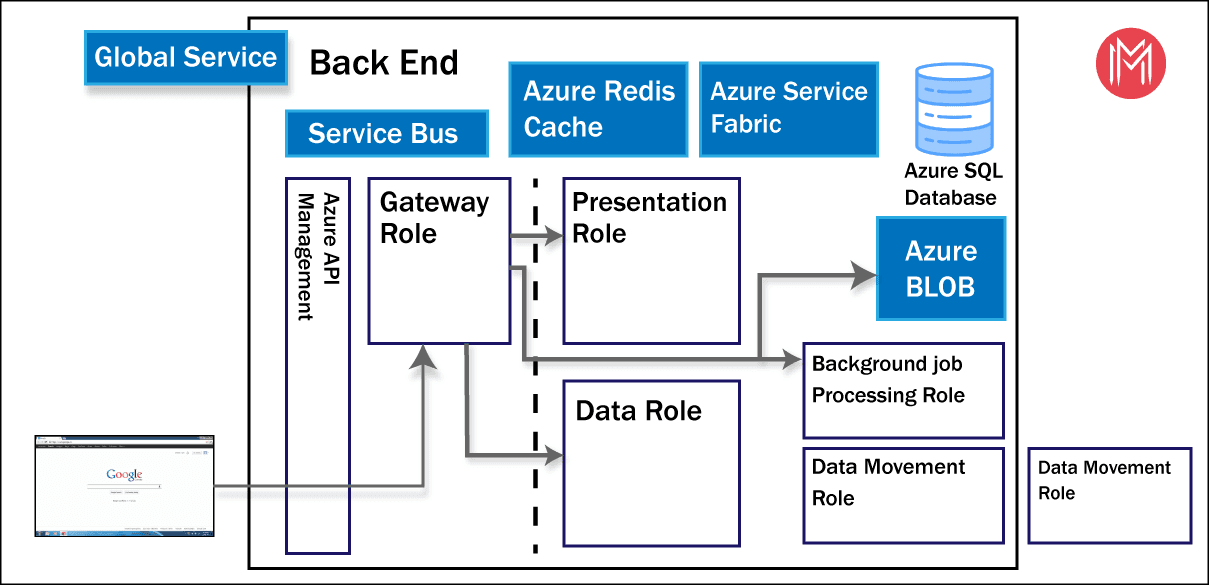
2. Back End Cluster: It manages the datasets, reports, storage, visualizations, data refreshing, data connections, and other services in the Power BI. At the back end cluster, the web client has only two direct points to interact with the data, i.e., Gateway Role and Azure API Management. These two components are responsible for authorizing, load balancing, routing, authentication, etc.
Working Of Power BI Service
- Power BI stores the data in two leading repositories, i.e., Azure SQL Database and Azure Block Storage. Azure Block Storage enables the users to store the datasets, and all system-related data and metadata are stored in the Azure SQL database.
- It authenticates the user requests and sends them to the Gateway Role. It processes the requests and assigns them to the appropriate components like Background Job Processing Role, Data Movement Role, Presentation Role, and Data Role.
- The presentation role manages all the associated visualization queries like reports and dashboards.
- Presentation Role sends requests to the Gateway Role to the Data Movement Role or Data Role for all relevant datasets.
- Azure Service Bus is used to connect and fetch the data from the On-Premises data sources with the cloud. It sends a request to execute the queries On-Premises data source and retrieve the data from its cloud service.
- The Azure Service Fabric allows all components and microservices which are related to the Power BI Service.
- Azure Cache helps in reporting the data that is stored in the in-memory of the Power BI system.
Conclusion:
In this blog, we gave detailed information about the Power BI Architecture, its working, and its components. And also, we have explained the Power BI service and its works.
If you still have queries regarding Power BI Architecture?
Got any questions? Leave a comment below and we will get back to you
 On-Job Support Service
Online Work Support for your on-job roles.

Our work-support plans provide precise options as per your project tasks. Whether you are a newbie or an experienced professional seeking assistance in completing project tasks, we are here with the following plans to meet your custom needs:
- Pay Per Hour
- Pay Per Week
- Monthly
| Name | Dates | |
|---|---|---|
| Power BI Training | Jul 25 to Aug 09 | View Details |
| Power BI Training | Jul 28 to Aug 12 | View Details |
| Power BI Training | Aug 01 to Aug 16 | View Details |
| Power BI Training | Aug 04 to Aug 19 | View Details |

Usha Sri Mendi is a Senior Content writer with more than three years of experience in writing for Mindmajix on various IT platforms such as Tableau, Linux, and Cloud Computing. She spends her precious time on researching various technologies, and startups. Reach out to her via LinkedIn and Twitter.


