
- Power BI Slicers - A Definitive Guide
- How to Download and Install Power BI Desktop
- How to Share Reports in Power BI for Mobile
- Power BI Architecture: A Complete Tutorial with Diagram
- Power BI Career Opportunities
- What are the Components of Power BI?
- DAX In Power BI - Learn Power BI DAX Basics
- Power BI Interview Questions and Answers
- Power BI Services and Benefits
- Power BI Visuals List and Chart Types
- Power Apps Interview Questions and Answers
- Power Apps Tutorial
- What is Power BI? The Definitive Guide
- What is Power Apps?
- Top 15 Data Visualization Tools
- Power BI Projects and Use Cases
- Power Pivot vs Power Query
- Power BI Vs QlikView
- Power BI Heatmap
- Power BI Gateway - Power BI Gateway Architecture
- Power BI vs SSRS - What are the Differences
- Power BI Dashboards vs Reports - Which is better?
Power BI is a user-friendly solution developed by Microsoft to handle the business analytics services like data visualization, sharing of such data through your company’s data line, and connecting various data sources from across the world just to enable the end-users to edit, modify and use these data for their own presentations, dashboards and reports.
This Power BI tutorial will assist you in learning the fundamentals as well as more advanced topics associated with this application. It provides you with the opportunity to increase your level of competence in this area.
So, let's become acquainted with how it works in order to develop strong database schemas and generate results for you!
Microsoft Power BI Tutorial - A Definitive Guide
| The subjects listed below are the ones that will be covered in this Power BI Tutorial. |
|
What is Business Intelligence?
Data is transformed into actionable insights via business intelligence (BI) tools and services, which then inform the business insights of a company's management team. The use of business intelligence (BI) tools to access and analyze data sets and share data in presentations, summaries, dashboards, graphs, charts, and maps can give readers information about the condition of their businesses.
Depending on the context, the phrase business intelligence can also refer to a collection of tools that enable quick, simple access to information about an organization's present situation, based on data that is currently available.
What is Microsoft Power BI?
Microsoft Power BI is a business intelligence application designed to be used by both technical and non-technical business people. When used by customers who are already familiar with Excel, Power BI's user interface is fairly easy, and its strong connection with other Microsoft products makes it an extremely adaptable self-service tool that requires little initial training.
A free version of Power BI is accessible for small and medium business owners, while a professional version dubbed Power BI Plus is offered for a monthly subscription cost for larger organizations. A desktop version for Windows 10, titled Power BI Desktop, as well as native mobile apps for Windows, Android, and iOS devices, are available for download. Power BI Report Server is also available for firms that prefer to keep their data and reports on-premises rather than in the cloud. Power BI Report Server requires a specific version of the desktop application, which is appropriately named Power BI Desktop for Power BI Report Server.
Different Types of Licenses in Power BI
The Power BI license sets the range of functionalities that are available to users in the Power BI Service: for example, users can access the following features:
An area to store data and reports as well as a working technique
The possibility of working together on reports
Access to data sources, data analysis, and report creation are all made possible with Power BI Free / Desktop, which is a free license. Each individual client who wants to create reports for their own use and does not have to access the information through a cloud storage service is targeted by this licensing option.
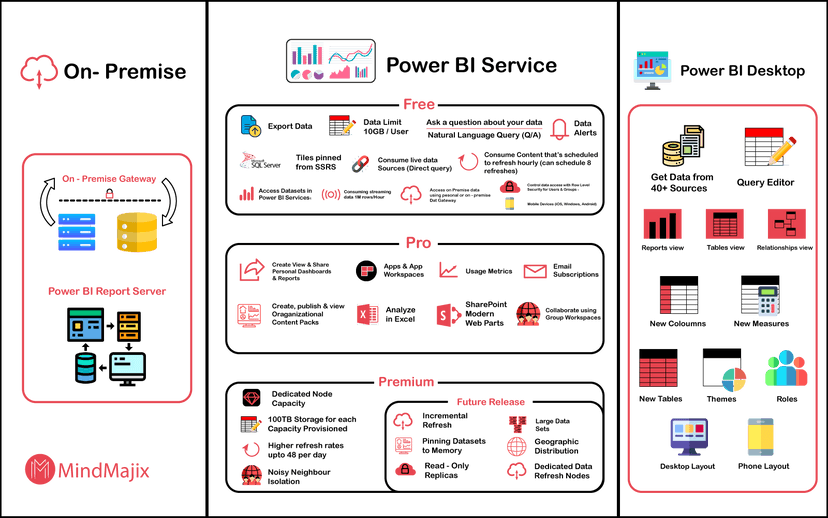
Power BI Desktop / Free
Power BI Free / Desktop covers all development functions, such as the integration of hundreds of data sources, the creation of reports in Power BI Desktop, among others (on a local machine)
- Data and reports are being stored in a separate workstation mostly on the cloud inside Power BI
- Export the report/data to an Excel spreadsheet, PowerPoint presentation, or another format.
- Pdf format (Portable Document Format)
- Python is being used to create visualizations with the R programming language.
Power BI Pro
In comparison to a free license, a Pro license provides additional features such as sharing data and reports with other users who also have a Pro license, storing datasets (up to 10GB per user), publishing results onto a website or a SharePoint site, and many other features.
Power BI Pro is licensed on a per-user basis. Its capabilities are extensively utilized in small and medium-sized businesses where users are required to create, distribute, and examine reports created by other employees. Pro License is frequently used in conjunction with a Power BI Premium subscription in large corporations and organizations.
Licenses for Power BI Pro are available for $9.99 per user/month.

Power BI Premium per User
Microsoft made this licensing option available to customers in April 2021. The advantages of both a Power BI Pro license and an annual Power BI Premium subscription are combined in this package. Therefore, some Premium features such as big data models (up to 100 GB), frequently scheduled refreshes (up to 48 times per day), and premium functionalities such as Paginated Reports or Artificial Intelligence (AI) scripts are available to you.
Power BI Premium, despite the fact that it is usually referred to as a license, is actually a subscription service (do not confuse it with Power BI Premium per User). It is not assigned to specific users but rather to the entire organization as a whole.
How to Download and Install Power BI Desktop
The following steps make to download Microsoft Power BI Desktop
Step1 - Go to Official Microsoft Power BI Web Page - Microsoft Power BI Official Website
Step2 - Select language, read the instructions below and click on the download option
Step3 - After installing Power BI Desktop just click on it to open it
For more detailed information visit - How to Install Power BI Desktop
Power BI Architecture
Power BI is a business suite that consists of a number of technologies that are designed to function together. Microsoft Power BI technology consists of a number of components that work together to deliver outstanding business intelligence solutions. These components include:
- Query with a lot of power
- Power BI Desktop is a business intelligence application.
- Power BI Mobile is a mobile version of Power BI (for Android, iOS, Windows phones)
- Power Pivot is an acronym that stands for Power Pivot (for in-memory tabular data modeling)
- View from a position of strength (for viewing data visualizations)
- Power Flow Diagram (for visualizing 3D geo-spatial data)
- Q&A Session with Influence (for natural language Q&A)
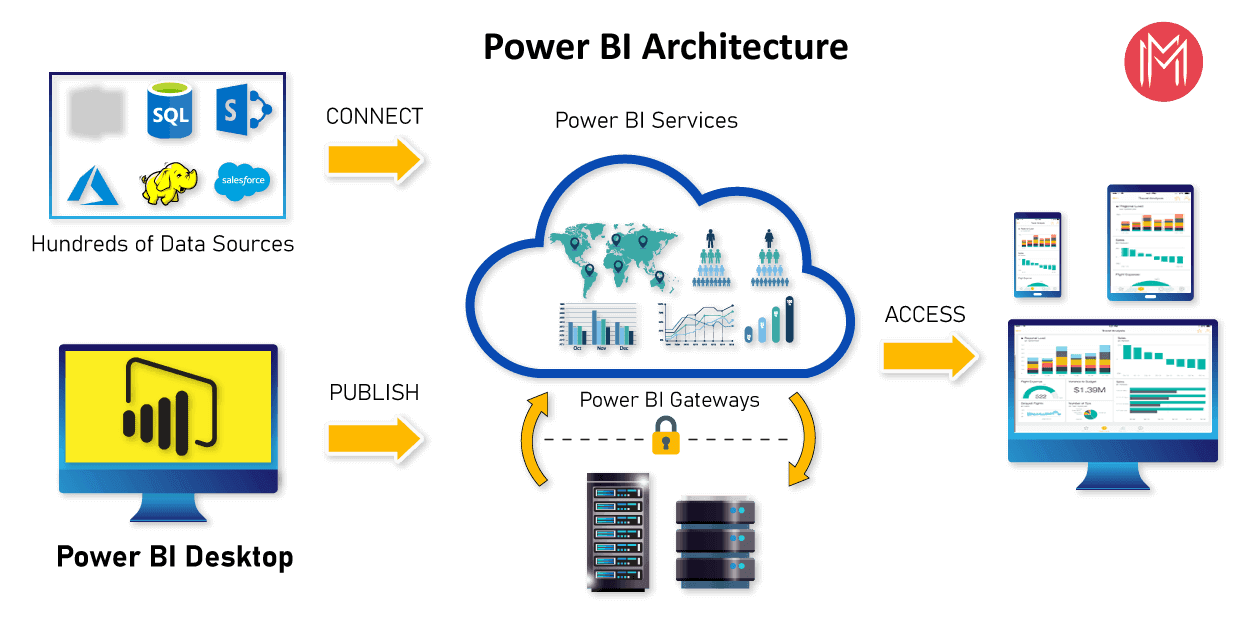
Put another way, a Power BI user imports data from a variety of different data sources such as files or Azure sources. Other data sources include online services such as DirectQuery or gateway sources. Then, using a client development tool such as Power BI Desktop, users may work with the information. The data that has been imported is cleaned and changed here to meet the demands of the user.
As soon as the data has been processed and formatted, it is available to be used in the creation of report visualizations. A report is a collection of visual representations such as graphs, charts, tables, filters, and slicers that convey information.
The reports developed in Power BI desktop can be published on two different types of platforms: Power BI Service and Power BI Report Server, which are the next steps in the chain of activities.
Power BI Service is a publicly accessible cloud-based platform, whereas Power BI Report Server is an on-premises platform protected by a firewall.
By attaching visuals from your official studies to these platforms, you can construct dashboards. Sharing and collaboration with other users within your business or outside of it is possible through several delivery choices such as a web browser, Power BI on iPad and other tablet devices, PCs and mobile phones, and other devices.
Power BI Components
- Power Query
- Power Pivot
- Power View
- Power Map
- Power Q/A
- Power BI Desktop
| For more details about Power BI components - visit - List of Power BI Components |
Types of Data Sources that Power BI Supports
There are numerous data sources supported by Power BI. You may select Get data from the drop-down menu, which will display all of the available data connections. It enables you to connect to a variety of flat files, SQL databases, and Azure cloud services, as well as web-based platforms such as Facebook, Google Analytics, and Salesforce object instances. It also includes an ODBC connection, which allows you to connect to other ODBC data sources that are not listed on the website.
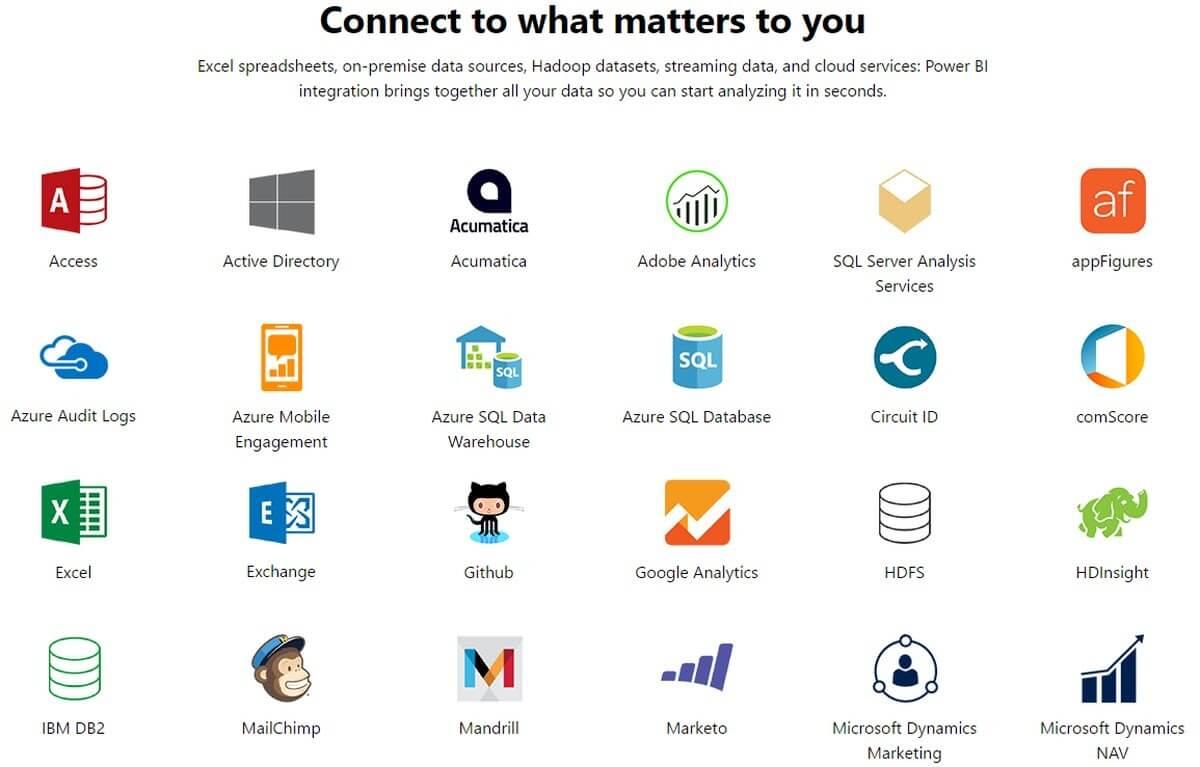
The following are the data sources that are available in Power BI.
- Flat Files
- SQL Database
- OData Feed
- Blank Query
- Azure Cloud platform
- Online Services
- Blank Query
- Other data sources such as Hadoop, Exchange, or Active Directory, and more.
In order to obtain data on the Power BI desktop, you must first navigate to the Get data option on the main screen. It presents you with the most frequently used data sources first. Then select More from the drop-down menu to see a comprehensive list of accessible data sources.
Importing Datasets into Power BI Desktop
The initial thing that you should do to build a dashboard connects with your data sources. The steps to import the data sets are as follows:
- Choose and Click on the Get Data button
- Select the data sources you want to connect. You’ve got CSV, excel azure, etc. You can even scrape the data off web pages if necessary.
- Load it into your model.
- Click on the Get Data button
[Related Article: Power BI Dashboards vs Reports]
Types of Views available in Power BI Desktop
When you are adding data for the first time, a blank screen will appear, and you will come across three basic views on the left of the screen.
Report View
The Report view is the first one on the list, at the top of the page. It's also the default view, which means it's the one you'll see when you first launch Power BI Desktop. This view is used by creators to build visually appealing reports based on their data. For many creators, this is the screen on which they spend most of their time.
Beginning with blank square space on the left side and a list of available tools and functions on the right, the Report view is easy to navigate and use. Bar graphs, pie charts, line graphs, and a plethora of other visualizations will be constructed in this area. Take some time to explore the many visualization options available in Report view and become comfortable with their capabilities. When you become more comfortable with the different types of visualizations accessible, you will be able to rapidly choose which options best reflect your data and express what your data is saying the most clearly. While in this view, you can also add many pages to a single report, allowing you to retain all of your associated data in one handy and understandable spot in the event that you ever send these models via Power BI Service.

Other features are available in the Report view as well. It is possible to copy and paste visuals, as well as hide report pages, for example.
Data View
Consider the Data view, which follows after that. The Data view choice is located in the center of the screen. Once you've spent the effort to model your data, you'll be able to see the results on the Data view. Instead of presenting you with visuals similar to those you've made, Data view presents the information in a grid format, piece by piece.
You'll want to spend some time getting to know Data View, just like you did with Report View so that you can understand how to use it to your advantage. Once you've examined Data view and become acquainted with it, you'll find that visualizing your data in this manner has a number of advantages. For starters, you will be able to study the smaller components of your data more closely. You can also search for certain bits of information, locate the information you require, and organize the information. The Data view can assist you in gaining further insights into your data so that you can study it from a variety of perspectives. You will be able to optimize your data knowledge and make the best well-informed decisions possible as a result of your efforts.
Model View
The model view displays all of the tables, columns, and relationships that are present in the model. This view can be particularly useful when your model contains intricate relationships between a large number of different tables.
To see a view of the current model, click on the Model icon on the side of the window on the right. When you place your cursor over a relationship line, the columns that are being used will be displayed.
If you're using a report theme, the colors in the table card headers will automatically match the colors in the report theme you've selected. If the color is too close to white, it will not be utilized in the Model view theme headers in order to avoid circumstances where it is difficult to distinguish between tables while using the dual-mode feature of the browser.
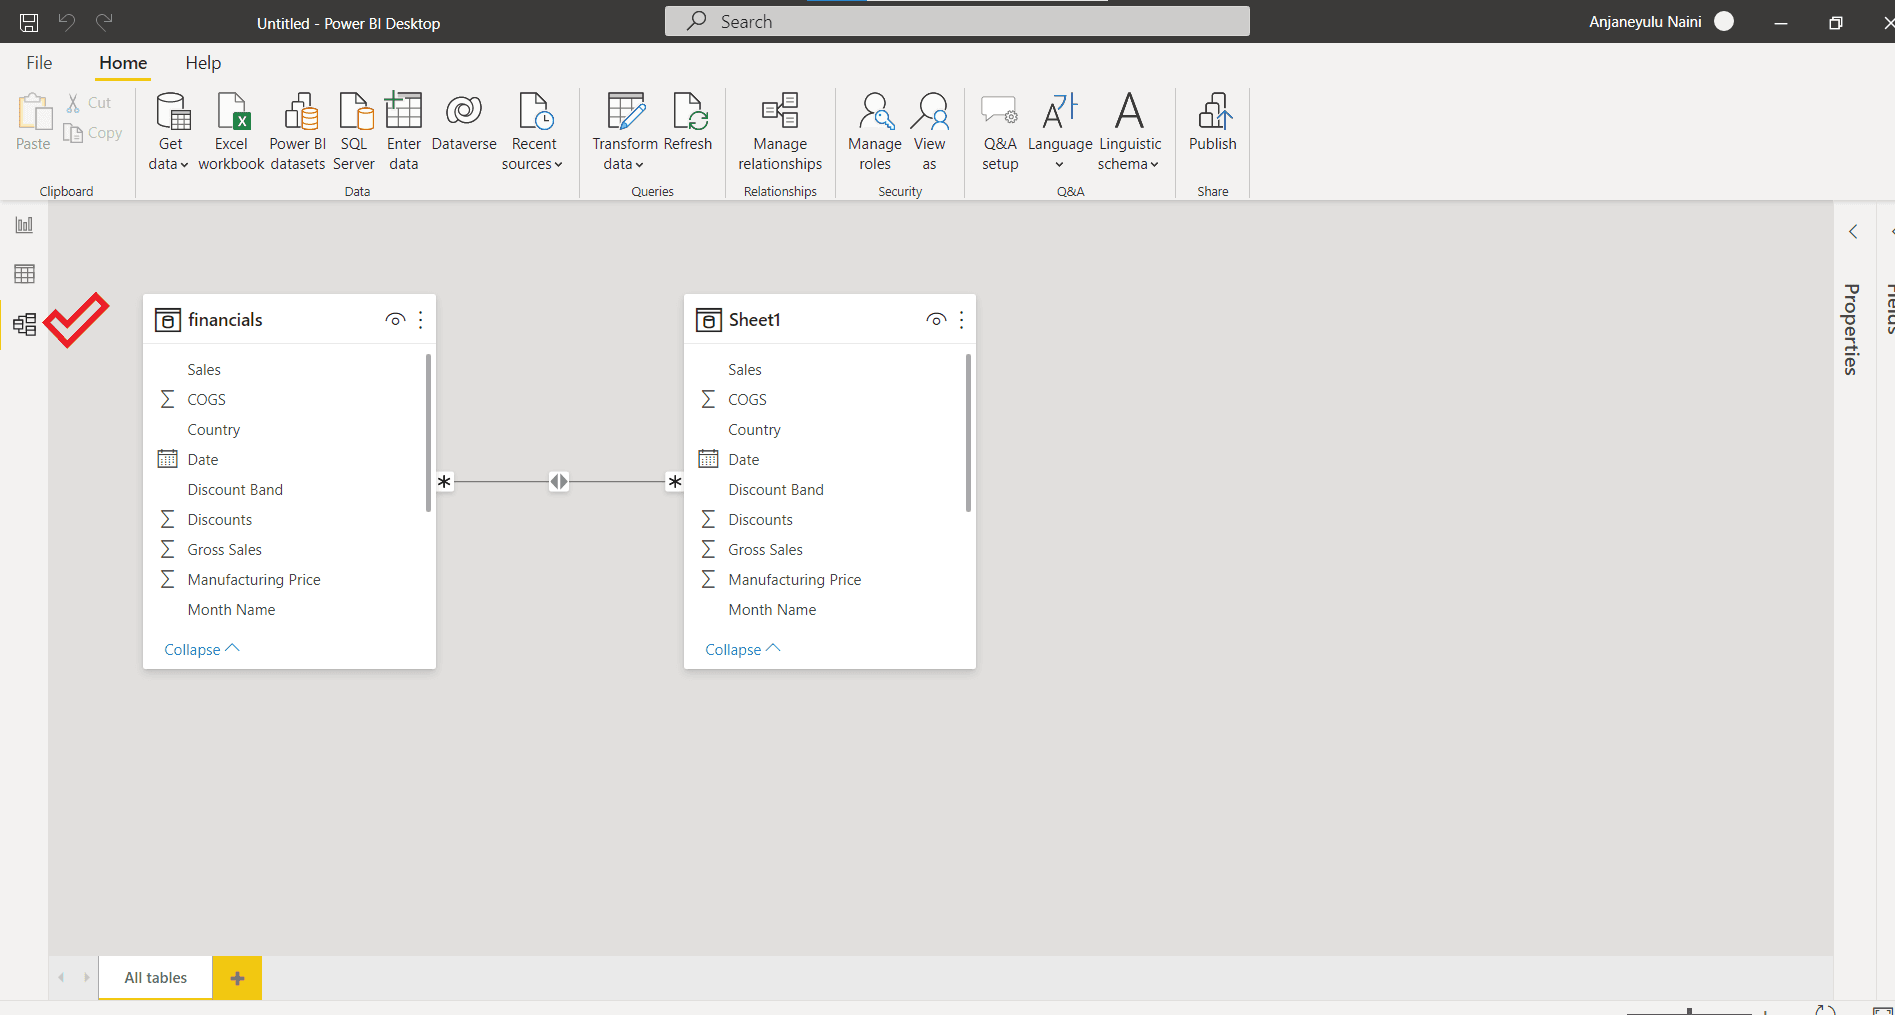
All of the tables in your model will be seen in the Model view if your model has fewer than 75 tables. Alternatively, if your model includes more than 75 tables, you will see the following image instead of all of the tables:
Introduction to DAX & Query Editor
DAX
In business intelligence and visualization, DAX (Data Analysis Expressions) is a formula expression language that may be utilized in a variety of technologies. DAX is also referred to as a functional language because the entire code is contained within a single function. Data types in DAX programming formulas are divided into two categories: numeric and other. Numeric data types include integers, currency, and decimals, whereas Other data types include string and binary object data types.
In addition to other functions, conditional statements, and value references, a DAX function can contain additional functions.
| For more information visit our DAX Tutorial blog |
Query Editor
The Query Editor in Power BI is a tool for transforming and editing data files before they are put into the Power BI environment.
When you use the Query Editor, it acts as an intermediate data container, allowing you to alter data by highlighting or selecting rows and columns, separating rows and columns, pivoting or unpivoting columns, and so on. The modifications made by the Query Editor in Power BI are not reflected in the underlying dataset that was used to create them. As soon as you have completed the pre-processing and transformation of your data into the proper format, you may load it into the Power BI environment.
Building a Dashboard in Power BI Desktop
Before moving into dashboard creation, let's discuss what is a dashboard first
What is a Dashboard?
A dashboard can be defined as a canvas to bring various visualizations or elements representing data sets together. It will provide you with the story overview, and contains all the critical aspects of the report. A report can be a single page or multiple pages long.
Let's now look into the dashboard creation in Power BI Desktop
Let's consider that we are creating a Dashboard in Power BI from scratch.
For instance, let's say we are creating a Sales dashboard for different countries. To create this, we need to import customer-related sales data, products, orders, sales, and region details into the Power BI system. Using this data, we can create distinct kinds of visualizations to represent the aspects of the imported data effectively.
| Download Sample Sales Data for a practical approach |
A workspace appears as soon as you open a Power BI Desktop. You have tabs like Home, Modeling, View, and Help on the top bar with a range of options in them. There will be two sections on the right, Fields, and Visualizations. The Fields section consists of all the fields of the imported data tables, whereas in Visualizations, you can select a visual and edit it.

Step 1 - Bringing in information
When you initially start working on a Power BI dashboard, the first action you must complete is to import data from source files. Select a data source from the drop-down menu by clicking on the Get Data button. Connect to a data source by selecting it and clicking on Connect. In the Power Query Editor, you can prepare the data that has been imported.
Step 2 - To Format
You can access all of the imported tables from the Data tab, where you can also see them in tabular format. There is a list of tables and fields inside those tables on the right-hand side of the screen. You can conduct formatting actions on a table or field by selecting them from the drop-down menu. If you have fields that contain data such as date, time, city, state, percentage value, currency, and so on, you can modify the format or data type from the Modeling tab by selecting the appropriate option.

Step 3 - Modelling
Despite the fact that the linkages and connections between both the tables that you import have already been established by the Power BI engine, you can still inspect and make changes to the data model by selecting the Model tab from the left horizontal bar on the toolbar. The relationships between the two tables are represented by links connecting two fields that are shared by both tables.
Step 4 - Creating Visuals
Complete the final Dashboard
Now that we have completed the process of integrating all of the various sorts of images and graphics into our dashboard, we are nearing the completion of the last phases. As needed, you can reposition and resize the visualizations on the dashboard. You may also customize the dashboard by choosing a theme, changing the page size, changing the background, and so on.
Final Step - Publish the Dashboard
We are done by adding various types of graphics and visuals that we want to have on the dashboard. Since we are nearing the final step. Let’s adjust and resize the dashboard visualizations according to our requirements. You can also select themes for the dashboard, its background page size, etc.
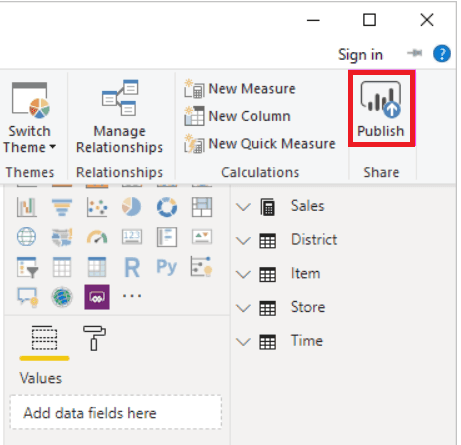
Once you have completed your dashboard, you can publish it to the Power BI workspace for others to see. To begin, save your dashboard to your computer's hard drive.
To publish the dashboard on the web, select the Publish option from the drop-down menu. Log in to your Power BI account, and the publishing procedure will be completed without error. After that, you will be provided with a connection to a web page where the dashboard has been uploaded and is accessible to other users.
| Check out Top Power BI Project Ideas For Practice |
Power BI Sample Dashboards
Here are the sample dashboards collections of various domains available on the Microsoft Power BI official Website
1. Human Resource Management Dashboard
Below mentioned dashboard represents the entire Human Resource Management in a simple visualization manner.
Source: Obvience.com (in Microsoft Official Portal)
2. Retail Analysis Dashboard
Below mentioned dashboard represents the retail sales and profits area wise
3. IT Spend & Analysis Dashboard
Below mentioned dashboard represents the IT Spend Analysis Country wise
4. Sales and Marketing Reports Dashboard
The below-mentioned dashboard represents Market Share including sales & profit. Learn about Growth opportunities.
Note: This file and associated data is property of obviEnce llc and has been shared solely for the purpose of demonstrating Power BI functionality with industry sample data.
Conclusion
Power BI is the ideal marriage of a visually appealing interface with Microsoft Excel functionality. Once you have a basic understanding of Microsoft Office, you will be able to create interactive graphs in your reports using the data that you have available.
If you and your department are considering implementing a business information collection system, Power BI is a product that should be considered. Power BI is not restricted to a specific organization size, which allows it to be extremely scalable in nature. From small teams utilizing a single connector to large organizations processing data through a number of connectors and external data sources, Power BI can be used by any size team or organization.
 On-Job Support Service
Online Work Support for your on-job roles.

Our work-support plans provide precise options as per your project tasks. Whether you are a newbie or an experienced professional seeking assistance in completing project tasks, we are here with the following plans to meet your custom needs:
- Pay Per Hour
- Pay Per Week
- Monthly
| Name | Dates | |
|---|---|---|
| Power BI Training | Jul 28 to Aug 12 | View Details |
| Power BI Training | Aug 01 to Aug 16 | View Details |
| Power BI Training | Aug 04 to Aug 19 | View Details |
| Power BI Training | Aug 08 to Aug 23 | View Details |

Prasanthi is an expert writer in MongoDB, and has written for various reputable online and print publications. At present, she is working for MindMajix, and writes content not only on MongoDB, but also on Sharepoint, Uipath, and AWS.


