Quality Assurance is one of the crucial stages in software application development. If you want to assess the performance of applications and other resources, you must conduct performance testing inevitably. The metrics of the performance testing will indicate the effectiveness of the applications.
That's why performance testing of applications and other resources is considered highly essential to optimise the performance of resources. Usually, this testing is performed before launching applications into production environments.
This way, JMeter is one of the powerful tools used for performance testing. With this tool, we can perform different types of testing to measure the performance of resources very closely.
Of course! In this blog, we will tell you about JMeter performance testing, how to conduct this testing, types of testing, its benefits, and many more in a better way.
What is Performance Testing?
Performance testing is a process by which we can test the performance of applications against performance metrics. By performing this testing, we can identify whether applications fail or lack in their performance. The performance testing results indicate areas where we need to make further improvements. Also, we can ensure that applications meet the requirements set at the beginning of the application development. Simply put, we can identify the production readiness of the applications with this testing.
By conducting performance testing, we can identify bottlenecks in the normal functioning of applications and rectify them before deploying them into a production environment.
The following are some of the bottlenecks:
- CPU utilisation
- Operating System limitations
- Disk usage
- Memory utilisation
- Network utilisation
When it comes to performance metrics, speed, stability, and scalability are some of the vital metrics that decide the performance of applications. Data transfer rates, throughput, network bandwidth, reliability, and workload efficiency are some other performance metrics we can measure through performance testing.
Besides, we can conduct performance testing for multiple applications and compare the results to identify the factors that impact the performance of applications. As a result, we can fine-tune applications and improve their performance.
| If you want to enrich your career and become a professional in JMeter, then enroll in "JMeter Training". This course will help you to achieve excellence in this domain. |
What is JMeter?
JMeter is one of the popular open-source performance testing tools developed by the Apache software foundation. It is an excellent go-to tool for testers and developers to conduct performance testing. No wonder it is a tool that you can easily install and scale.
With JMeter, you can conduct performance testing for various web resources. Even you can also conduct functional testing using this tool. When it comes to load testing, JMeter helps find the resources' responses for different loads. For example, you can test the capacity of servers and networks for different loads, especially for heavy loads.
What is JMeter Performance Testing?
You can accurately measure web applications and other resources performance using JMeter.
With JMeter performance testing, you can measure the performance of both static and dynamic resources. Here, the static resources include JavaScript and HTML. Dynamic resources include JSP, AJAX, and Servlets. Also, you can test web applications, shell scripts, databases, web services, and so on.
Moreover, you can test the performance of different servers and web services. They can be listed as follows:
- Database servers
- Mail servers such as SMTP, IMAP, and POP3
- Web servers such as HTTP and HTTPS
- LDAP servers
- TCP servers
- Web services such as SOAP and REST
Know that JMeter Performance testing includes load testing, volume testing, stress testing, and many more. After the testing, JMeter provides the test results with a graphical analysis.
Further, speed, stability, and scalability are the three essential metrics measured in the JMeter performance testing of web resources. Speed is the metric that is used to check whether a web resource is working fast or not. Scalability is the metric that shows how many users can use a particular resource concurrently. Stability is yet another metric used to check the performance of resources at different loads.
| Related Article: JMeter Tutorial |
Why JMeter Performance Testing?
Wondering why JMeter is widely used in performance testing?
Here are the reasons:
- It is a portable tool that works across any platform. Simply put, it’s a platform-independent tool.
- It is a highly extensible tool.
- JMeter comes with a multi-threading framework. Therefore, we can conduct JMeter performance testing for many thread groups concurrently.
- With JMeter performance testing, we can find the maximum number of concurrent users a web application can handle.
- It has an easy-to-use Graphical User Interface (GUI).
- The graphical analysis created by the JMeter includes graphs, tables, reports, trees, etc. It simplifies tracking the performance of web applications.
- We can test the speed, response time, reliability, and resource usage of applications through JMeter performance testing.
- We can find the bottlenecks that slow down the normal functioning of applications. As a result, you can take corrective actions and boost the performance of applications.
- We can view test results while running tests.

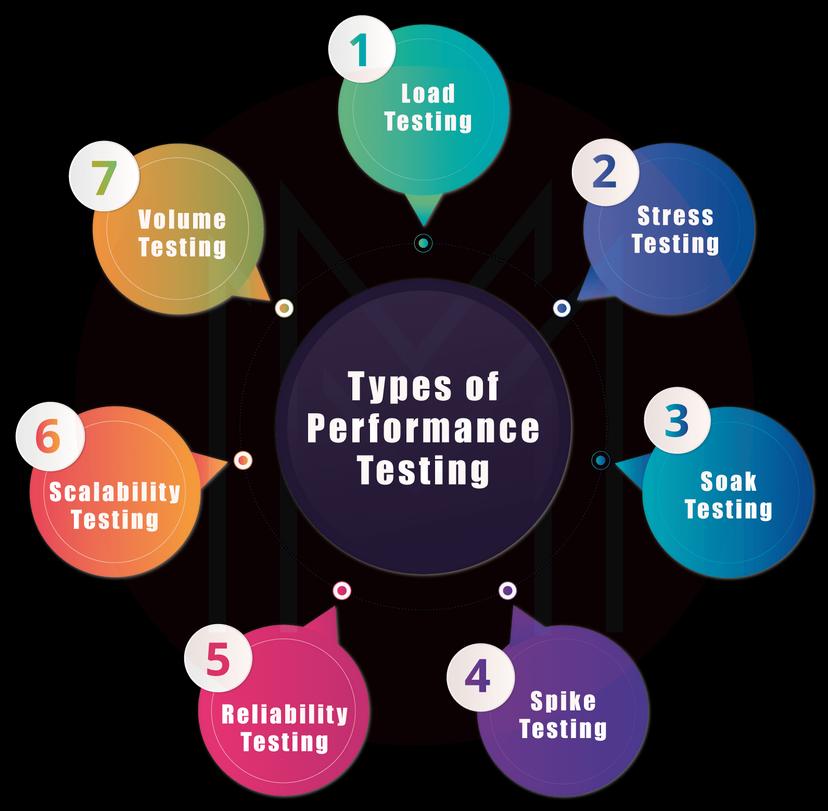
Types of Performance Testing
There are many types of performance testing with which you can measure the performance of resources.
Let’s discuss a few performance testing types one by one below.
-
Load Testing
With load testing, you can measure the capacity of web applications when multiple users use the applications at a time. By performing load testing, you can track the behavior of applications and identify bottlenecks in the normal functioning of applications.
Also, you can test the performance of applications at normal workload as well as peak usage. Thus, you can measure the response time and consistency of the applications accurately.
-
Stress Testing
Know that every web server has a maximum load capacity. Stress testing allows for finding the maximum load capacity that web servers can handle. If a web server is receiving a load beyond its maximum capacity, it will start functioning slowly and create errors without a doubt.
Not only servers you can perform stress testing to measure the performance of other resources such as CPUs, hard disks, solid-state drives, memory, and so on.
Stress testing is essential simply because an overload in applications may happen unexpectedly in a production environment. So, it is essential to find the potential breaking point of applications based on resource usage.
-
Soak Testing
It is also known as endurance testing. Soak testing is a subtype of stress testing. In this testing, the number of users is increased step-by-step to test the performance of applications, mainly to test consistency and sustainability.
-
Spike Testing
It is yet another subtype of stress testing. Here, a sudden spike in the number of users is applied to applications, and the response is measured. With spike testing, you can check the performance of applications when there is an abrupt change in workload in a short while.
-
Reliability Testing
Reliability testing measures how soon applications return to their normal state from an abnormal.
-
Scalability Testing
It is the testing performed to check whether an application could scale up when there is a need for expansion.
-
Volume Testing
With this testing, you can measure the behavior of applications when there is a massive amount of data to handle.
| Related Article: JMeter Interview Questions |
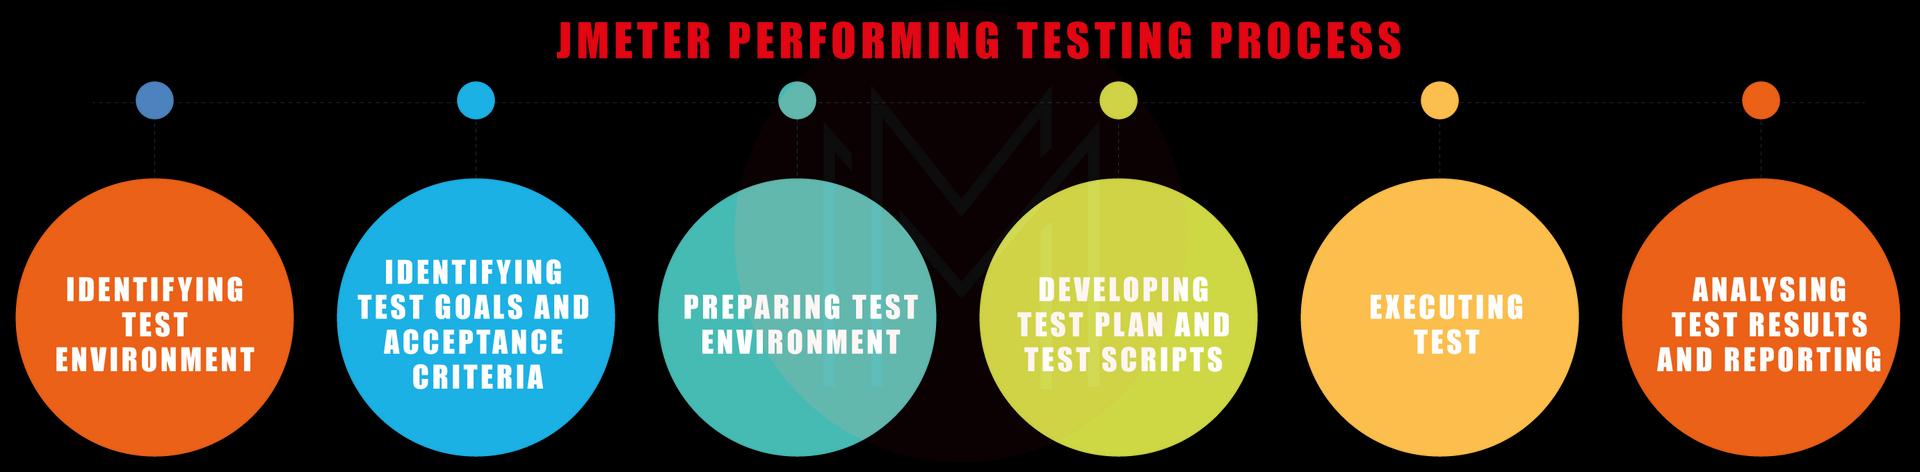
How to conduct Performance Testing using JMeter?
There is a step-by-step procedure to conduct performance testing using JMeter. Let’s look at the steps right away as follows.
-
Identifying Test Environment
It is the first step in which you must identify the proper hardware, configuration, software, and functionalities completely. This step will help to prepare an effective test plan at later stages.
The system under the test environment should have basic requirements to run JMeter. It means you must have installed the correct version of Java to run JMeter.
You can download the latest version of JMeter in two ways – using binary files or source codes. If it is a binary file, you can run test scripts quickly. With source codes, you can have more control over the test scripts.
Once the files are downloaded, extract them and install JMeter. No matter what operating system you use to run JMeter, the functionality would be the same.
-
Identifying test goals
In this step, you need to set performance goals or acceptance criteria. For example, you must set the expected response time, resource utilisation, throughput, etc.
-
Preparing Test Environment
In this step, you must choose the proper hardware and software and define configuration details accurately. Building an effective test environment will result in generating the best test results.
Thread Groups
Creating thread groups is one of the essential elements in building a test environment. Essentially, a thread represents a virtual user. The Thread group is a set of virtual users chosen for the performance test. The number of threads refers to the number of virtual users selected for the test. In addition, you need to set up the thread properties such as the number of threads, loop count, delays, ramp-up period, test start and stop times, etc.
-
Test Plan and Script Development
In this stage, you must prepare a robust test plan. Before that, you must ensure the suitable use cases and perform the script development in line with that.
You can use the templates provided with JMeter to prepare a test plan. SOAP web service test plan, FTP test plan, basic and advanced web test plan, and functional testing plan are a few test plan templates offered by JMeter.
It is essential to note that you need to run JMeter in GUI mode while creating a test plan. Generally, a test plan has thread groups, sample-generating controllers, logic controllers, listeners, assertions, timers, and configuration elements.
For script development, first, you can record testing using a test script recorder. After that, you can remove the randomly generated values and hard-coded values.
Moreover, you must add an appropriate listener to check the results.
-
Executing the Test
You must perform testing incrementally in JMeter. Because of this requirement, you must gradually increase the number of users. Note that you need to use CLI to run tests in JMeter.
-
Test Results Analysis and Reporting
With the test results, you can analyse the performance metrics closely. You can check whether the application is working as per your expectations. The main thing is that you must perform testing repeatedly to ensure consistency across the results.
| Related Article: JMeter Correlation |
Metrics of JMeter Performance Testing
Metrics help to identify the performance of applications in numeric form.
Let’s see some of the metrics of JMeter performance testing.
- Throughput: It is the ability of a web server to handle loads. Also, it is the number of requests a web server can handle per second. Note that the throughput value goes up when the performance of the web server is doing well.
- Thread Counts: It is the number of active threads that an application can handle.
- Speed of Processor: It is the time taken by a processor to execute threads.
- Disk time: It is the time taken by a disk to read and write a request.
- Bandwidth: It is the volume of data transfer that can be taken place between systems.
- Response Time: It is the time gap between a user’s request and an application’s first response.
- Disk Queue Length: It represents the average number of read-and-write requests waiting for a sample interview.
- CPU Interrupts per Second: It refers to the number of interrupts received by a processor per second.
Benefits of JMeter performance Testing
There are a lot of benefits that we can gain by performing performance testing using JMeter.Let’s move on to the benefits.
Plugins
As JMeter is a platform-independent tool, we can integrate many plugins with JMeter. As a result, we can accelerate script creation and testing. The user community of JMeter is so large. So, it’s not a surprise development, and release of new plugins are frequent. Even you can develop your plugin and publish it.
- Server Compatibility: Whether a web server, database server, or any other, JMeter is compatible with all types of servers. So, we can test any server with JMeter.
- Record and Playback: This feature allows testers to record their performance tests and view them offline. It allows testers to create test scripts and run the tests more effectively.
- Customisation: As JMeter is an open-source tool, we can easily access the source code and make customisation as per the application requirements.
- Distributed Load Testing: JMeter supports the master-slave method. So, we can distribute workloads across many systems and perform testing across many systems simultaneously.
Limitations of JMeter Performance Testing
Although JMeter performance testing offers many benefits, it has a few limitations. Below is the list that addresses the same.
- JMeter performance testing is unsuitable for large projects since it demands dedicated hardware and network requirements.
- Moving from one script to another takes work. It is time-consuming and creates errors as well.
- Visual reports consume extra memory, especially for heavy workloads.
- There are no attractive reporting functionalities in this testing.
Conclusion
JMeter is an easy, portable, robust, and highly extensible tool. Also, it is a go-to tool for performance testing. With JMeter, we can test the performance of resources effectively. Be it a web application or web service, no matter we can conduct performance testing seamlessly. Also, we can perform various testing, from load testing to volume testing. Metrics are used to know the accurate picture of performance testing. On top of all, JMeter provides a lot of plugins to strengthen the testing.
 On-Job Support Service
Online Work Support for your on-job roles.

Our work-support plans provide precise options as per your project tasks. Whether you are a newbie or an experienced professional seeking assistance in completing project tasks, we are here with the following plans to meet your custom needs:
- Pay Per Hour
- Pay Per Week
- Monthly
| Name | Dates | |
|---|---|---|
| JMeter Training | Aug 01 to Aug 16 | View Details |
| JMeter Training | Aug 04 to Aug 19 | View Details |
| JMeter Training | Aug 08 to Aug 23 | View Details |
| JMeter Training | Aug 11 to Aug 26 | View Details |

Madhuri is a Senior Content Creator at MindMajix. She has written about a range of different topics on various technologies, which include, Splunk, Tensorflow, Selenium, and CEH. She spends most of her time researching on technology, and startups. Connect with her via LinkedIn and Twitter .