- Home
- Blog
- Elasticsearch
- ELK Stack Tutorial

- Elasticsearch Interview Questions
- Elasticsearch Tutorial
- Elasticsearch vs Solr
- Overview on ElasticSearch Aggregations
- CRUD Operations & Sorting Documents
- Elasticsearch Curl Commands with Examples
- Elasticsearch Custom Analyzer
- Elasticsearch Dynamic Mapping - Overview
- Elasticsearch Filtered Query
- Combine Aggregations & Filters in ElasticSearch
- Introduction to Elasticsearch Aggregations
- Elasticsearch Mapping
- Learn Elasticsearch Stemming with Example
- Elasticsearch Pagination
- Elasticsearch Post Filter Aggregation
- Elasticsearch Multi Get - Retrieving Multiple Documents
- Elasticsearch Query String
- Learn Elasticsearch Sorting
- Elasticsearch Bulk API
- Elasticsearch Nested Mapping
- Elasticsearch Update API
- Kibana Interview Questions
- Kibana vs Splunk
- Elasticsearch vs Algolia
With more IT infrastructures shifting to the cloud, the requirement for log analytics platforms and public cloud security tools is increasing. Regardless of organization size users generate a large amount of data regularly. A substantial amount of that data is related to the web server logs of the company. Logs are one of the essential data sources, and every log file comprises precious information that is unstructured. Without any detailed analysis of the log data, an organization remains unaware of the threats and opportunities. Here is where log analysis tools are useful. ELK Stack is a perfect log analysis tool that assists in in-depth analyzing, visualizing, and searching the log that we generate from various machines. In this ELK Stack Tutorial, we will provide you with insights on it.
ELK Stack Tutorial for Beginners
| Following topics will be covered in ELK Stack Tutorial |
What is ELK Stack?
ELK Stack is a group of three freeware Products- Elasticsearch, Logstash, and Kibana. The elastic company develops and manages these three products. In ELK Stack:
Elasticsearch: We use ElasticSearch to store the logs.
LogStash: We use LogStash to Ship, Store, and Process the logs.
Kibana: We use Kibana as a tool for visualizing the data through dashboards and charts.
ELK Stack Advantages
- ELK performs better when logs from different Apps of a company form a single ELK Instance.
- It offers an incredibly deep understanding of the instance and reduces the requirement to register into different data sources.
- It offers quick on-site installation.
- Elasticsearch Provides a group of language clients that includes Python, Ruby, Perl, PHP, etc.
- It contains libraries for various scripting and programming languages.
ELK Stack Architecture
ELK Stack Architecture displays the order of the log flow in ELK. The logs generated from different data sources are gathered and processed by the Logstash, according to the given filter criteria. After that, Logstash pipes those Logs to the Elasticsearch, and after that, Elasticsearch searches and analyses the data. Finally, through Kibana, we can visualize and manage the logs according to the requirements.
| Enroll in our ELK Stack Online Certification Training today and develop a strong foundation in ELK Stack. |
Elasticsearch – ELK Stack Tutorial
What is Elasticsearch?
Elasticsearch enables us to search, analyze and store extensive volume data. We can use it as a fundamental engine to authorize the applications that fulfill the search requirements. It also acts as a NoSQL database, and it is based on the Lucene Search Engine. It provides easy management, simple deployment, and maximum reliability. It also offers sophisticated queries for performing detailed analysis and stores the data.
Elasticsearch Features
- We can use Elasticsearch for indexing any type of diverse data.
- It contains the REST API web interface with the JSON output.
- It is a freeware search server.
- It has Geolocation and Multi-language support.
Important Concepts of Elasticsearch
Node
Node means a single working instance of Elasticsearch. Single virtual and physical servers adapt multiple nodes according to the abilities of their physical resources like storage, processing power, and RAM.
Cluster
A cluster is a group of multiple nodes. It provides mutual search and indexing capabilities throughout all the nodes of the complete data.
Index
An index is a group of various kinds of documents and their properties. The index uses the shard concept for improving performance. For instance, a group of documents comprises data of the social networking application.
Shard
Indexes are laterally subdivided into shards. This indicates that every shard comprises all document properties. The lateral separation makes the shard a separate node that we store in any node. Main(Primary) Shard is the native lateral part of the index.
Document
It is a group of fields in a particular manner specified in the JSON format. Each document relates to a format and inhabits inside the index. Each document is related to a distinct identifier known as “UID”.

Replicas
Elasticsearch enables us to create replicas of their shards and indexes. Replica not only assists in increasing the accessibility of the data when any failure occurs but also enhances the performance of the search query by implementing a concurrent search operation in the replicas.
Elasticsearch Installation
To install the Elasticsearch, we have to follow the below steps:
Step1: First, check the version of java installed on our system. The version of java should be a seven or higher version. We can check it by performing the following:
In Windows OS, we execute the following command:
> java -versionIn the UNIX OS, we execute the following command:
$ echo $JAVA_HOMEStep2: According to our operating system, we can download the Elasticsearch from the “www.elastic.co” as defined below:
- In windows OS, we have to download the ZIP file.
- In the UNIX OS, we have to download the TAR file.
- In the Debian OS, we have to download the DEB file.
Step3: Elasticsearch installation process is simple and is explained below for various operating systems:
- In Windows OS - We have to Unzip the zip package, and elasticsearch is installed.
- In UNIX OS - We have to extract the tar file in any drive, and elasticsearch is installed.
$wget
https://artifacts.elastic.co/downloads/elasticsearch/elasticsearch7.0.0-linux-x86_64.tar.gz
$tar -xzf elasticsearch-7.0.0-linux-x86_64.tar.gz- Utilizing the APT utility for the Linux OS - Download and install the Public Signing key.
$wget -go - https://artifacts.elastic.co/GPG-KEY-elasticsearch | sudo
apt-key add
We save repository definition as displayed below-
$ echo "deb https://artifacts.elastic.co/packages/7.x/apt stable main"
sudo tee -a /etc/apt/sources.list.d/elastic-7.x.list
Execute update through the below command.
$ sudo apt-get updateAfter that, we can install an elasticsearch through the below command.
Download and install Debian Package through the following command
$wget https://artifacts.elastic.co/downloads/elasticsearch/elasticsearch7.0.0-amd64.deb
$sudo dpkg -i elasticsearch-7.0.0-amd4.deb0
Utilizing the YUM Utility for the Debian Linux OS
Download and Install Public Signing Key
$ rpm --import https://artifacts.elastic.co/GPG-KEY-elasticsearchInsert the below text in a file with the repo suffix in our directory.
elasticsearch-7.x]
name=Elasticsearch repository for 7.x packages
baseurl=https://artifacts.elastic.co/packages/7.x/yum
gpgcheck=1
gpgkey=https://artifacts.elastic.co/GPG-KEY-elasticsearch
enabled=1
autorefresh=1
type=rpm-md
After that, we can install the Elasticsearch through the following command:
sudo yum install elasticsearchGo to elasticsearch home directory and bin folder. Run elasticsearch.bat file in windows os, or we can execute the same file in the command prompt. In UNIX os we can execute the elasticsearch file through the terminal.
Windows OS:
> cd elasticsearch-2.1.0/bin
> elasticsearch
Unix OS:
> cd elasticsearch-2.1.0/bin
> elasticsearch
9200 is the default port for the elasticsearch web interface, and we can change it by changing the http. port in the “elasticsearch.yml” file that is present in the bin directory. We can check whether the server is started and running by browsing the “http://localhost:9200”.
Following are the three significant steps of Elasticsearch.
Significant Steps of Elasticsearch
Indexing
It is the process of inserting the data into Elasticsearch. We call this process indexing because when data enters into the Elasticsearch, it gets stored into the Apache Lucene Indexes. After that, Elasticsearch uses the Lucene Indexes for retrieving and storing the data. Indexing is like creating and updating the process of CRUD operations.
Index scheme contains name, type, id, where type and name are necessary fields. If we do not provide “id”, Elasticsearch will provide the “id”. After that, we append the complete query to the HTTP PUT request and the Url will be: PUT name/type/id.
| Read these latest Elasticsearch Interview Questions that help you grab high-paying jobs! |
Mapping
Mapping is a technique of configuring the schema of the index. Through mapping, we tell Elasticsearch about data types of attributes that are present in our schema. If we do not do mapping for a particular schema at the pre-index time, Elasticsearch will add a generic type to that field. But the generic types are fundamental, and they do not satisfy the query requirements.
Searching
Searching is a common search query with a particular type, and the index will be like: “POST index/type/_search”. We will use the following search query for searching customer details that are present in the “customer” index.
When we want to search for particular results, Elasticsearch offers the following three ways:
Queries:
Through Queries, we can search for some particular entries or documents. For instance, we can use the following search query for searching the VIP customers.
POST /customer/US/_search
{
 "query": {
 "match": {
 "Type": "VIP"
 }
 }
}
Filter
Through Filters, we can further narrow down our searches. Following is the search query that searches for VIP Customers with ID as “102”.
POST /customer/_search
{
 "query": {
 "match": {
 "Type": "VIP"
 }
 },
 "post_filter": {
 "match" : {
 "ID" : 102
 }
 }
}
Aggregation
Aggregation is a framework that assists in aggregating the data by using the search query. We can join small aggregations for building difficult outlines of the data given.
POST /customer/_search
{
 "size": 0,
 "aggs" : {
 "Cust_Types" : {
 "terms" : { "field" : "Type.keyword" }
 }
 }
}
Logstash – ELK Stack Tutorial
What is Logstash?
It acts as a data collection pipeline tool. It gathers the data inputs and stores them into ElasticSearch. It collects different kinds of data from different data sources and makes it accessible for future reference. Logstash can amalgamate the data from distinct sources and standardize the data into your required destinations. Following are the three elements of Logstash:
Input: Sending the logs for processing them into the machine-understandable format.
Filter: It is a group of conditions for performing a specific action or an event.
Output: It acts as a decision-maker to a processed log or event.
Logstash Features
- It enables various inputs for our logs.
- It does parsing or filtering for your logs.
- Logstash forwards the events in every phase by using the internal queues.
Logstash Service Architecture
Logstash processes the logs from various data sources and servers, and it acts as a shipper. Shippers collect the logs and install them in all input sources. Brokers like Kafka, RabbitMQ, and Redis act as buffers for storing the data for the indexers, and we can have multiple brokers.
We use Lucene indexers to index logs for good search performance, and after that, we store the output in Elasticsearch or other output destinations. The data present in the output storage is accessible for the kibana and other visualization software.
Logstash Installation
For installing the Logstash in our system, we should follow the below steps:
Step1: We have to check the version of java installed on our computer, it must be Java 8 as it is not consistent with java 9. We can do this by:
In Windows OS, we execute the following command.
> java -versionIn UNIX OS, we execute the following command.
$ echo $JAVA_HOMEStep2: We download the Logstash
- In Windows OS, we have to download the ZIP file.
- In UNIX OS, we have to download the TAR file.
- In Debian OS, we have to download the DEB file.
Step3: Logstash installation process is very simple. Let us see how we can install the Logstash on different platforms.
- Windows OS- After unzipping the zip folder, we install the Logstash.
- UNIX OS- In UNIX OS, we have to extract the tar file in any location, and after that, we can install the Logstash.
$tar -xvf logstash-5.0.2.tar.gzUtilizing the APT Utility for the Linux OS
Download and Install Public Signing Key.
$ wget -go - https://artifacts.elastic.co/GPG-KEY-elasticsearch | sudo apt-key addSave the warehouse definition.
$ echo "deb https://artifacts.elastic.co/packages/5.x/apt stable main" | sudo tee -a /etc/apt/sources.list.d/elastic-5.x.listExecute the Update-
$ sudo apt-get updateNow we can install the Logstash through the below command-
$ sudo apt-get install logstashUsing the YUM utility for the Debian Linux OS-
Download and Install Public Signing key-
$ rpm --import https://artifacts.elastic.co/GPG-KEY-elasticsearchAdd the below text in a file with repo suffix in our directory.
[logstash-5.x]
name = Elastic repository for 5.x packages
baseurl = https://artifacts.elastic.co/packages/5.x/yum
gpgcheck = 1
gpgkey = https://artifacts.elastic.co/GPG-KEY-elasticsearch
enabled = 1
autorefresh = 1
type = rpm-md
Now we can install the Logstash through the below command.
$ sudo yum install logstashStep4: If you are using the Windows operating system, then Open the Logstash home directory, and go to the bin folder, execute the “elasticsearch.bat” file. If you are using the UNIX operating system, then execute the Logstash file.
We have to specify the input and output source, optional filters. To check the installation, we have run it with basic configuration through stdin(standard input stream) as input source and stdout(Standard Output Stream) as output source. We can specify the configuration in the command line through the “-e” option.
In Windows-
> cd logstash-5.0.1/bin
> Logstash -e 'input { stdin {} } output { stdout {} } '
In Linux-
$ cd logstash-5.0.1/bin
$ ./logstash -e 'input { stdin {} } output { stdout {} } '
Step5: The Logstash web interface default ports are 9600 and 9700, and we define them in “logstash-5.0.1configlogstash.yml” as http.port. We can verify whether the Logstash server is running by running “http://localhost:9600” or whether the port is different, and after that, we have to verify the terminal or command prompt.
Collecting Logs in Logstash
Logstash collects from various data sources or servers through the shippers. Shipped is defined as an instance of the Logstash that we install in a server, that accesses server logs and forwards to a particular output destination. It primarily forwards output to elasticsearch for storing purposes. Logstash takes the input from the below sources:
- Syslog
- Files
- STDIN
- Microsoft Windows Event Logs
- TCP/UDP
Log collection through the Apache Tomcat 7 server
We collect the logs of the Apache Tomcat 7 Server that we install through a file input plugin and forward them to other logs.
Logstash.conf
We configure the logstash for accessing the access log of the Apache Tomcat 7 that we install locally. We use the regex pattern in the path setting of the file plugin for retrieving the data from the log file. This contains the access in the name, and it inserts the apache type, that assists in differentiating apache events from others in the centralized destination source.
Run the Logstash
We run the Logstash through the below command:
c:logstashbin> logstash -f Logstash.confApache Tomcat Log
We can use the Apache Tomcat server and its web apps for generating the logs. We read the updated logs through Logstash in real-time and stored them in the output.log as defined in the configuration file. Apache tomcat creates the new access log file based on the logs and dates the access events exist.
Kibana – ELK Stack Tutorial
What is Kibana?
Kibana is the data visualization tool that completes the ELK Stack. We use this tool to visualize Elasticsearch documents, and it helps the developers in analyzing them. The Kibana Dashboards provide different responsive geospatial data, graphs, and diagrams for visualizing difficult queries.
We can use Kibana for viewing, searching, and interacting with the data saved in the Elasticsearch directories. Through Kibana, we can do advanced data analysis and visualize our data in different charts, maps, and tables.
Kibana Features
- Kibana has a robust front-end dashboard that can visualize the indexed information from an indexed cluster.
- Kibana allows the real-time search of indexed information.
- Kibana executes the queries on the data and visualizes the results in tables, maps, and charts.
- Kibana can provide historical data in the form of charts, graphs, etc.
Kibana Installation
For installing Kibana, first, we have to go to the official kibana site:
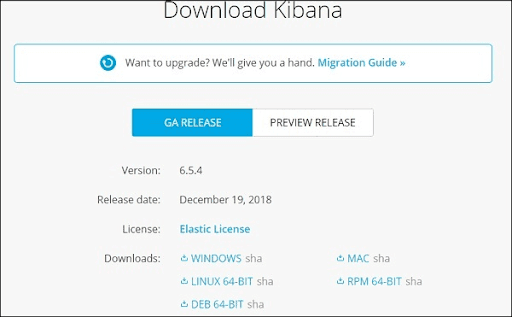
After that, press the download link that is present on the top right corner and it will show the following screen:
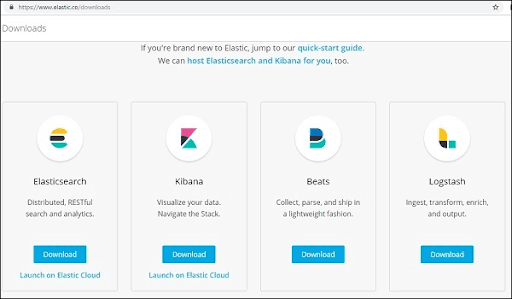
Press the download button for the Kibana. Kindly note that for working with kibana we require a 64-bit system and kibana will not work in a 32-bit system. Kibana is available for Windows, Linux, and Mac. We can download it according to our requirements.
After downloading, We have to create a folder and uncompress the zip/tar downloads for the kibana. We have to work with the sample data that is uploaded in the elasticsearch. Therefore, now we will see how to start the kibana. For starting kibana, first, we have to go to the folder where we unpacked the kibana.
In windows:
> cd kibanaproject/kibana-6.5.4/kibana-6.5.4/bin
> kibana
In Linux:
$ cd kibanaproject/kibana-6.5.4/kibana-6.5.4/bin
$ kibana
When the Kibana starts, we see the below screen:
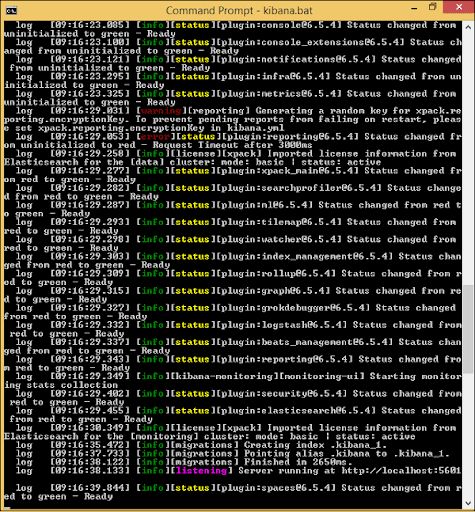
When we see a ready signal in the console, we open kibana in the browser through “http://localhost:5601/. The default port of Kibana is 5601.
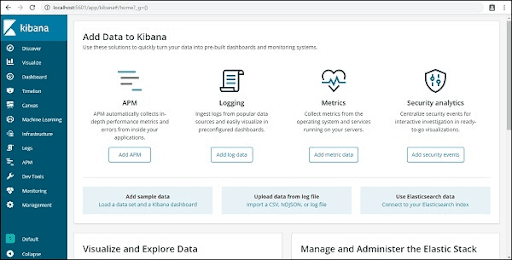
The following screen displays the UI(User Interface) of the Kibana.
Kibana Visualisation
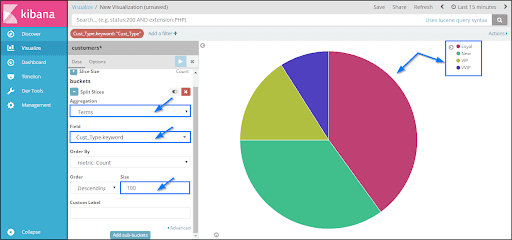
Kibana visualization allows us to visualize the data that exists in our elasticsearch indices, in the form of bars, charts, pipes. We can create dashboards that display the associated visualizations according to the elasticsearch queries. Usually, we use a group of elasticsearch aggregation queries for extracting and processing the data. In the Kibana visualization page, we can open the existing visualizations, or we can create a new visualization.
Kibana Visualisation Page:
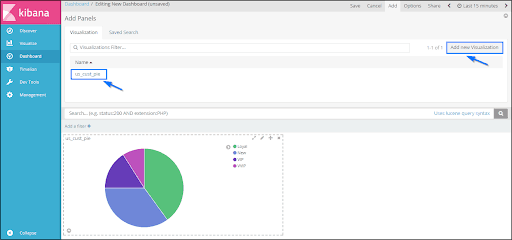
Kibana Dashboard
Kibana Dashboard displays a group of existing visualizations. On the dashboard page, we can add new visualizations, or we can use existing visualizations.
Kibana Dashboard Page:
Conclusion
ELK Stack is useful for resolving centralized logging system issues. It is a group of freeware tools like Elasticsearch, Logstash, and Kibana. Elasticsearch acts as a NoSQL database, Logstash is a data collection tool, and Kibana is a data visualization tool. I hope this article provides you with the required information about the ELK Stack.
If you have any queries, let us know by commenting in the below section.
 On-Job Support Service
Online Work Support for your on-job roles.

Our work-support plans provide precise options as per your project tasks. Whether you are a newbie or an experienced professional seeking assistance in completing project tasks, we are here with the following plans to meet your custom needs:
- Pay Per Hour
- Pay Per Week
- Monthly
| Name | Dates | |
|---|---|---|
| ELK Stack Training | Jul 21 to Aug 05 | View Details |
| ELK Stack Training | Jul 25 to Aug 09 | View Details |
| ELK Stack Training | Jul 28 to Aug 12 | View Details |
| ELK Stack Training | Aug 01 to Aug 16 | View Details |

Viswanath is a passionate content writer of Mindmajix. He has expertise in Trending Domains like Data Science, Artificial Intelligence, Machine Learning, Blockchain, etc. His articles help the learners to get insights about the Domain. You can reach him on Linkedin


