- Home
- Blog
- Elasticsearch
- Kibana Interview Questions

- Elasticsearch Interview Questions
- Elasticsearch Tutorial
- Elasticsearch vs Solr
- Overview on ElasticSearch Aggregations
- CRUD Operations & Sorting Documents
- Elasticsearch Curl Commands with Examples
- Elasticsearch Custom Analyzer
- Elasticsearch Dynamic Mapping - Overview
- Elasticsearch Filtered Query
- Combine Aggregations & Filters in ElasticSearch
- Introduction to Elasticsearch Aggregations
- Elasticsearch Mapping
- Learn Elasticsearch Stemming with Example
- Elasticsearch Pagination
- Elasticsearch Post Filter Aggregation
- Elasticsearch Multi Get - Retrieving Multiple Documents
- Elasticsearch Query String
- Learn Elasticsearch Sorting
- Elasticsearch Bulk API
- Elasticsearch Nested Mapping
- Elasticsearch Update API
- Kibana vs Splunk
- Elasticsearch vs Algolia
Kibana is an Elasticsearch data visualization plug-in that is open-source. In the context of indexing, it improves the visual capabilities of the data. Elasticsearch is a freeware search engine that works with full-text JSON documents and an HTTP interface. Its features provide extremely specific and comprehensive responses to the majority of queries. For those interested in Elasticsearch engineering, there are numerous opportunities. You can gain a distant platform to showcase your skills if you have the right approach and knowledge over the concepts. Our expertise curated Top 30 Kibana Interview Questions and Answers for Freshers and Experienced professionals.
This article is focused on all key concepts including definitions, Core features, architecture, dashboards, visualizations concepts and many more.
We have categorized Kibana Interview Questions - 2023 (Updated) into 3 levels they are:
TOP Kibana Interview Questions
Below mentioned are the Top Frequently asked Kibana Interview Questions and Answers that will help you to prepare for the Kibana interview. Let's have a look at them.
- Why use Kibana
- Explain about the Kibana dashboard
- What are the important features of Elasticsearch
- Explain about Indices
- What is meant by Elasticsearch Cluster
- Explain ELK Stack Architecture
- Explain about Kibana Lens
- Explain about Kibana Pre-configured Dashboards
- Explain about Elastic Machine learning features
- Explain about Kibana Security
Basic Kibana Interview Questions and Answers:
1. What is meant by Kibana?
Ans: Kibana is an open-source and free frontend tool that sits at the top of the Elastic Stack, allowing users to search and visualize the data which is indexed in Elasticsearch. Kibana is the user-friendly interface for managing, protecting and monitoring an Elastic Stack cluster, as well as the administrative hub for built-in solutions based on the Elastic Stack (formerly known as the ELK Stack after Logstash, Kibana, and Elasticsearch). Kibana, which was developed in 2013 by members of the Elasticsearch forum, has evolved into a window into the Elastic Stack itself, providing a platform for individuals and businesses.
2. What is Kibana used for?
Ans: Kibana's strong integration with Elasticsearch and the significant Elastic Stack is a perfect ideal for supporting the accompanying points:
-
- Data indexed in Elasticsearch is searched, viewed, and visualized, and the data is analyzed using tables, maps, pie charts, bar charts, and histograms. A dashboard overview integrates various visual features to provide real-time analytical perspectives into enormous data volumes in support of use cases like:
- Business analytics
- Infrastructure metrics and container monitoring
- Geospatial data analysis and visualization
- Logging and log analytics
- Application performance monitoring (APM)
- Security analytics
- Using the web interface, you can secure, monitor and manage an Elastic Stack instance.
- Providing centralized access to built-in Elastic Stack solutions for enterprise search applications, security and visibility.
- Data indexed in Elasticsearch is searched, viewed, and visualized, and the data is analyzed using tables, maps, pie charts, bar charts, and histograms. A dashboard overview integrates various visual features to provide real-time analytical perspectives into enormous data volumes in support of use cases like:
3. Why use Kibana?
Ans: Elasticsearch's official interface is Kibana. Kibana is the most efficient platform for obtaining data insights and actively managing the integrity of their Elastic Stack for Elasticsearch users.
Kibana covers a wide range of scenarios. Elastic has put a lot of effort into improving the visualization interface. Kibana's built-in abilities are used for uptime monitoring, business analytics, security analytics, APM, geospatial analytics, and other applications.
Kibana has a large and active user base. Kibana has a large community of users and contributors since it is an open and free interface. Kibana users have a wide range of experience, which is reflected in the documentation, training, and community support they receive. Elastic also provides training and one-on-one support to help users get started.
| Enrol in our Kibana Training and Certification Course today and develop a strong foundation in Kibana. |
4. Explain about Elasticsearch?
Ans: Elasticsearch is a Java-based, open-source search, analytical engine distributed based on Apache Lucene. It began as a modular implementation of the open-source Lucene search platform, then incorporated the ability to expand the Lucene indices dynamically. Elasticsearch allows you to easily analyze, store, and search large amounts of data in near real-time, with results arriving in milliseconds. It can produce quick search results because it searches an index rather than searching the text directly. It has a document-based structure rather than tables and schemas, and it has comprehensive REST APIs for searching and storing the data. At its most basic level, Elasticsearch can be thought of as a server that can accept JSON requests and return JSON data.
5. How does visualizing and searching data in Kibana work?
Ans: Kibana allows you to visualize the data from a single Elasticsearch database or several resources. When Beats (a group of individual data importers) or Logstash (a large-scale investor) ingests large amounts of data from network activity and other sources and changes it to a proper format for Elasticsearch warehousing and search capabilities, indices are formed.
Users can query data in the Elasticsearch database using Kibana's interface, and then view the results using conventional chart possibilities or built-in widgets like maps, Lens, and Canvas. Users can choose from different chart types, adjust number aggregations, and filter data to specified parts.
6. Explain about the Kibana dashboard?
Ans: A Kibana dashboard is a single pane that contains a variety of maps, graphs, searches, and charts. Dashboards provide a glance of data insights from different angles and allow users to delve deeper into the details.
7. How to create dashboards in Kibana?
Ans: Users should have data crawled in Elasticsearch and have created a visualization, map, or search before they can create a dashboard in Kibana. In Kibana, go to the side navigation and choose Dashboard. When you first visit the Dashboard interface, you'll get a list of all of your current dashboards. Sample data sets, which include pre-built widgets, can be added if no dashboards are available.
Following are the steps for users to build a dashboard in Kibana:
-> In the side navigation, click Dashboard.
-> Click Create a new dashboard.
-> Click Add.
-> Add visualizations and stored queries to the dashboard with Add Panels. The lists can be filtered if there are a lot of visualizations.
If the header has a read-only icon, it means that the user does not have enough access to edit, create or save the dashboards. These authorization settings can be changed on an individualized or group basis by Kibana administrators.

8. What are the important features of Elasticsearch?
Ans: Following points are the important features of Elasticsearch:
-
- An open-source search server that is written using the java programming language.
- Indexes any type of heterogeneous data.
- Has a web interface with a REST API and JSON output.
- Full-Text Search
- NRT (near-real-time) search
- JSON document store that is searchable, sharded, and replicated.
- A distributed document storage that is schema-free, RESTful, and JSON-based.
- Support for several languages and geolocation
9. What are the advantages of Kibana?
Ans: Following are few advantages of Kibana:
-
- Contains open-source software visualization tools that are used to disintegrate massive quantities of data into pie charts, bar graphs, heat maps, line diagrams, and other visual representations.
- For beginners, it's simple to understand.
- The ease with which the representation and dashboard can be transformed into reports.
- The canvas display aids in the thorough dissection of complex data.
- In Kibana, Timelion perception aids in comparing facts in reverse and better understanding the show.
10. Explain about Kibana Query language?
Ans: The Kibana Query Language (KQL) provides a simple language for searching Elasticsearch data using either free text or field-based search. KQL is exclusively used for data filtering and has no role in data sorting or aggregation.
As you type, KQL will suggest operators, field names, and values. Kibana parameters determine how well the suggestions function.
The KQL query syntax differs from the Lucene query syntax in terms of features. KQL can query nested and programmed fields. Regular expressions and searches with fuzzy terms are not supported by KQL. Click KQL beside the Search field, then switch off KQL to use the classic Lucene syntax.
11. What is meant by boolean queries in Kibana?
Ans: KQL supports And, Not, and Or. And it takes priority over or by default. Group operators in brackets to override the default ordering. These operators might be lower or uppercase.
To find documents with a response code of 200, a PHP extension, or both:
response:200 or extension:php
Experienced Kibana Interview Questions and Answers:
12. Explain about wildcard Queries in Kibana?
Ans: Wildcard queries are used to explore several attributes or by a phrase prefix. For performance reasons, Kibana's default settings prevent leading wildcards, although this can be overridden with an advanced parameter.
To find documents in which the machine. os begins with the letter "win," such as "windows 7" and "Windows 10," use the following formula:
13. What is meant by Documents in Elasticsearch?
Ans: Documents are the simplest type of data that may be indexed in Elasticsearch and are expressed in JSON, the universal internet data interchange format. A document is same as row in a database system in that it represents a specific object - the thing you're looking for. A document in Elasticsearch can be anything data integrity encoded in JSON, not only text. strings, dates, and Numbers are examples of data. Each document has a distinct ID and a data type that identifies what type of object it is. For instance, a document could be an educational article or web server log entries.
14. Explain about Indices?
Ans: A collection of documents with comparable qualities is referred to as an index. In Elasticsearch, an indicator is a topmost entity against which you can query. The index can be compared to a repository in a relational database system. In most cases, the documents in an array are logically related. You can have an index for one for Orders, Customers, one for Products, and so on in the context of an e-commerce website. An index is given a name that is used to refer to it while conducting indexing, searching, updating, and deleting operations on the documents included within it.
15. Tell us about Inverted Index?
Ans: In Elasticsearch, an index is actually an inverted index, which is the technique that all web browsers implement. It's a data model that maintains a mapping between information (such words or integers) and their places in a document or series of documents. It's a data structure that works like a hashmap and guides you from a phrase to a document. Instead of storing strings directly, an inverted index divides every document into discrete search phrases (i.e. each phrase) and then maps each keyword search to the documents in which it appears. The term "best" appeared in document 2 in the following image, so it is linked to that document.
This is useful for quickly determining where to look for search phrases in a document. Elasticsearch swiftly identifies the best results for full-text searches from even very huge data sets by leveraging decentralized inverted indices.
16. What is meant by Elasticsearch Cluster?
Ans: A cluster of Elasticsearch nodes is a collection of nodes that are all part of the same cluster. name is a name attribute. You have a cluster of one node if you run a specific instance of Elasticsearch.
A single node stores all main shards. The cluster state remains yellow because no duplicate shards can be deployed. Although the cluster is completely functional, data loss is a possibility in the event of system breakdown.
Replica shards are dynamically allocated when extra nodes are deployed to a cluster. When all basic and duplicate shards are active, the cluster phase changes to green.
17. Explain about Nodes?
Ans: A single server is part of a cluster is referred to as a node. A node is a storage device that also participates in the cluster's filtering and search functions. Elasticsearch nodes can be set up in a variety of ways:
The master node is in charge of the Elasticsearch cluster and is in charge of all cluster-wide activities such as index creation and deletion, as well as adding and removing nodes.
Data Node – It Stores data and performs data-related tasks like searching and aggregating it.
Client Node – Transmits cluster inquiries to the data requests and master node to the data nodes.
18. What is meant by shards in Elasticsearch?
Ans: Elasticsearch enables you to split the index using shards, which are smaller portions of the index. Each shard is a comprehensive integrated and conscious "index" that can be stored on any cluster node. Elasticsearch ensures redundancy by redistributing documents in an index throughout many shards and those shards across numerous nodes, which provides against component failure while also increasing query capacity when nodes are deployed to a cluster.
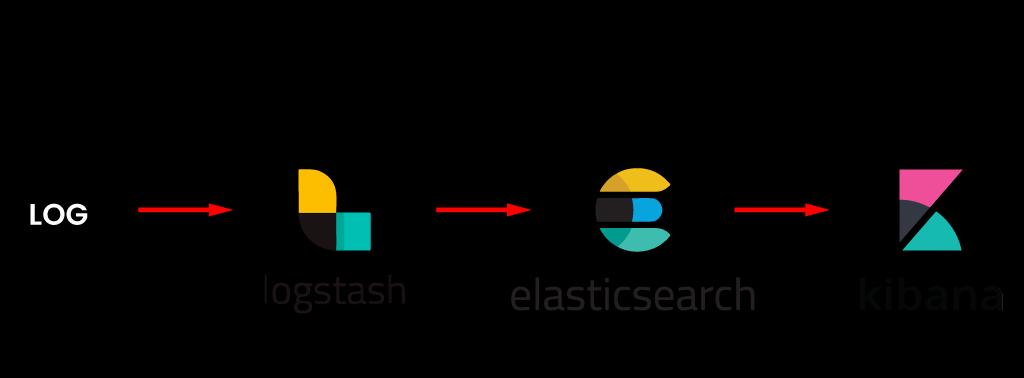
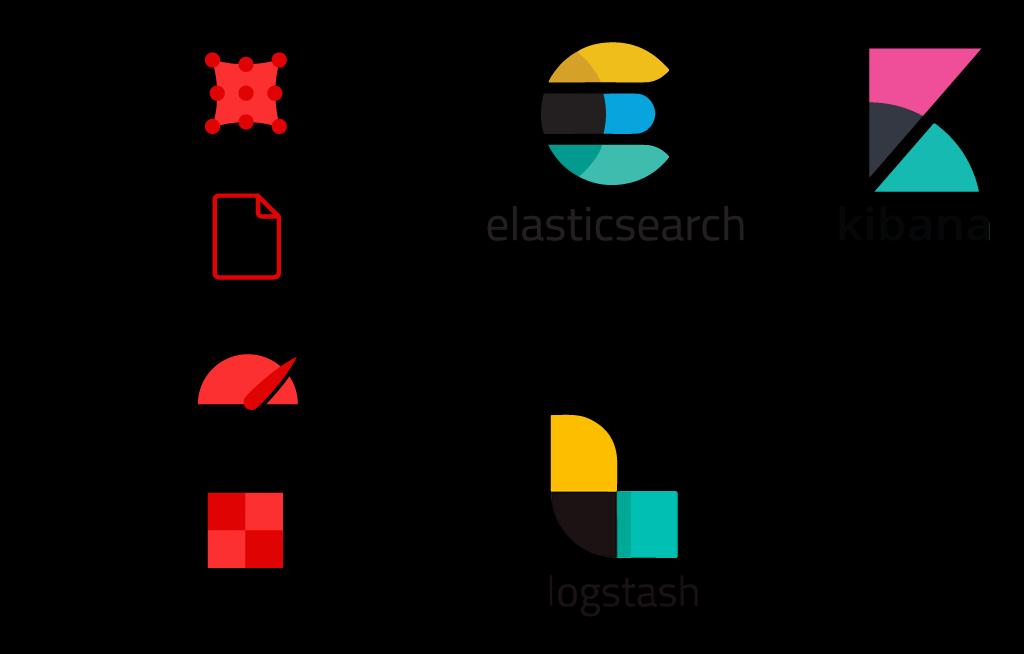
19. Explain ELK Stack Architecture?
Ans: An elastic stack is a collection of Elastic Open Source tools that allow users to analyze, visualize and search the data in real-time from any type of media and in any format. Logstash is used for data aggregation, Elasticsearch is used for searching, and Kibana is used for data visualization and analysis.
ElasticSearch: it is a database that allows you to store, search, and analyze data.
Logstash: (Log collection engine) Data from logs and events is collected, parsed, and transformed.
Kibana: Kibana is a Japanese word that means " (VI tool) Explore, Visualize, and Share without having to run a difficult SQL query.
Beats: It is a client-side data shipper that captures data and sends it to elasticsearch or logstash.
20. Explain about Replicas?
Ans: Elasticsearch enables you to duplicate multiple of your index's pieces, referred to as "replica shards" or simply "replicas" by Elasticsearch. A replica shard is a duplicate of the main shard. Each item in an array is associated with a single main shard. Replicas provide duplicate copies of your data to defend against component failure and boost capacity to satisfy read demands such as document searches and retrieval.
21. How do I retrieve the list of all Elasticsearch documents from an index?
Ans:
- You need to have a cURL configured and executed before you make an HTTP request to an Elasticsearch search.
- Use the_search API, GET requests, and GET API to query any items in an Elasticsearch database.
- Use the '?' pretty option to request the return JSON items in a human-readable form.
- Run a scan search on the regular Elasticsearch interface of 9200 to match with all existing documents.
- To restrict the search criteria you need to use the scroll option. Encapsulate the content of the request in a single quote mark (') which avoids errors.
[ Check out: Kibana Tutorial]
Advanced Kibana Interview Questions and Answers:
22. What is Elasticsearch used for?
Ans: We have a better knowledge of why and how Elasticsearch can be utilized for several use cases now that we have a basic picture of what it is, the conceptual concepts underlying it, and its design. We'll look at some of Elasticsearch's most common use cases and give examples of how firms are currently using it.
Primary Use Cases:
Application Search --> For applications, that run extensively on a searching platform for data reporting, retrieval, and access.Website
Website Search --> Elasticsearch is a highly important technology for accurate and effective searches on websites that contain a huge amount of information. It's no wonder that Elasticsearch is gathering steam in the arena of site search.
Enterprise Search --> Elasticsearch enables organization search, including E-commerce product, people, document, and blog searches, as well as any other type of search you can conceive of. It has gradually infiltrated and supplanted the search solutions of the majority of the visited websites we visit regularly. Elasticsearch has been used to tremendous success in enterprise intranets from a more organization perspective.
Logging and log analytics --> As previously mentioned, Elasticsearch is widely used for acquiring and interpreting log data in a scalable and near-real-time way. It also provides crucial actionable insight into log statistics, which can be used to guide actions.
Infrastructure metrics and container monitoring--> Many firms utilize the ELK stack to evaluate various data metrics. This could entail acquiring data on a variety of performance analyses that differ depending on the use case.
Security intelligence --> Security analysis is another important Elasticsearch analytics application. The ELK stack can analyze access logs and other logs related to system security, giving you a more extensive picture of what's going on across your network in real-time.
Business Analytics --> The ELK Stack has a lot of built-in capabilities that make it a viable alternative as a business analytics software. However, most firms will have a severe learning curve while deploying this solution. Because Kibana only operates with Elasticsearch data, this is highly relevant in circumstances when enterprises have several data sources other than Elasticsearch. Knowi, an analytics platform that interacts directly with Elasticsearch and allows even non-technical business people to generate visualizations and execute analyses on Elasticsearch data without any prior knowledge or skill of the ELK Stack, is a solid option.
23. Tell us about Logstash?
Ans: Data has been collected, processed, and sent to Elasticsearch using Logstash. It's a server-side and open-source data processing pipeline that simultaneously receives data from a variety of sources, processes it, and transmits it to clients. It also integrates and transforms data in any format by recognizing specific fields and transforming them to converge on a single format. For example, because data is frequently dispersed across numerous systems in different forms, Logstash allows users to connect disparate systems such as Amazon services, databases, web servers, and so on, and publish data in a continuously streaming fashion to wherever it needs to go.
24. Explain about Kibana Lens?
Ans: Kibana Lens is a designed tool that allows both expert and inexperienced users to have quick access to the information insights. The lens is indeed a drag-and-drop UI interface to make analyzing Elasticsearch data and creating visuals easier. The lens makes it easier to make charts by suggesting various ways to show data implemented in data analysis and typical usage patterns.
A user can do the following with Kibana Lens:
-
- With minimal program involvement, browse the data in an Elasticsearch index.
- Create many data visualizations by dragging and dropping data fields.
- Search across many Elasticsearch indices at the same time for evaluation in the same visualization.
- Switch aggregations and chart types in real-time to create data visualizations.
- Kibana allows you to create interactive dashboards without coding or prior training.
25. Describe Kibana Canvas?
Ans: Within Kibana, Canvas provides a visual and reporting application. Live data from Elasticsearch may be blended with text, colors, photos, and other configurable features to create animated, multi-page slideshows with Canvas.
A user can do the following with Canvas:
-
- Make a workplace your own by adding fonts, borders, backgrounds, colors, and many more.
- Add custom visuals to work pads, such as texts and images.
- Pull data directly from Elasticsearch to customize it.
- Data can be shown using progress monitors, graphs, charts, and other tools.
- Filters help you stay focused on the data you want to display.
26. Explain about Kibana Pre-configured Dashboards?
Ans: When using the Elastic Stack to analyze metrics and logs, you can choose from a multitude of preconfigured dashboards for a variety of data sources. From the outset, use Kibana like a pro. Following are the few preconfigured dashboards:
Web Server Modules: Instance dashboards— NGINX, Apache, HAProxy, IIS, and other web servers make it simple to get started tracking system metrics and log data in Kibana. Use these pre-configured dashboards to get started quickly, and then adjust them to match your specific needs.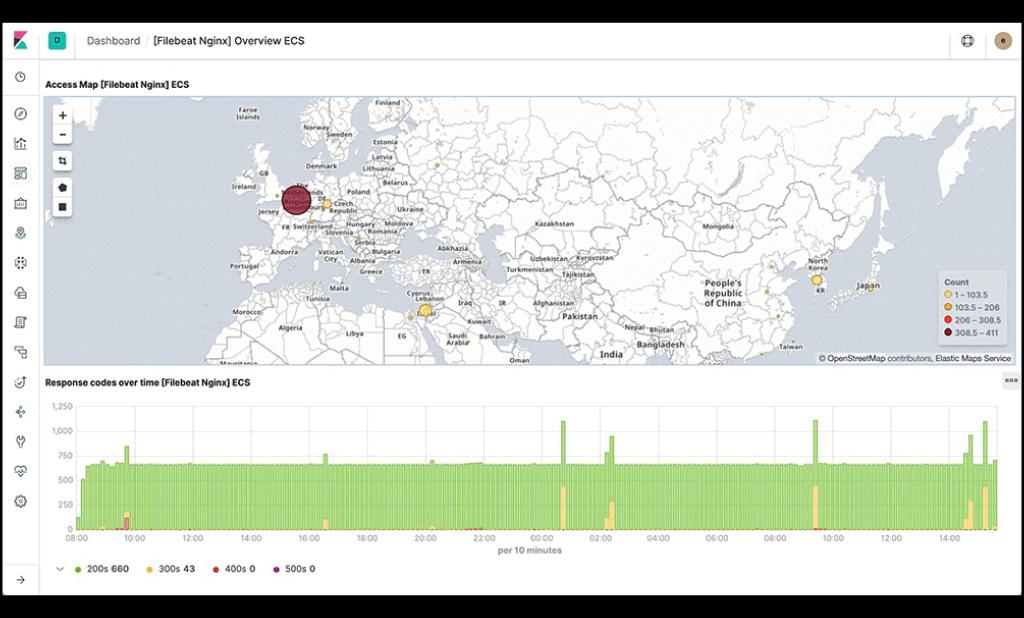
Database Modules: Instance dashboards--- MongoDB, Microsoft SQL, MySQL, PostgreSQL, and other databases make monitoring databases and processing system metrics and log data in Kibana simple. Use these pre-configured dashboards to get started quickly, and then adjust them to match your specific needs.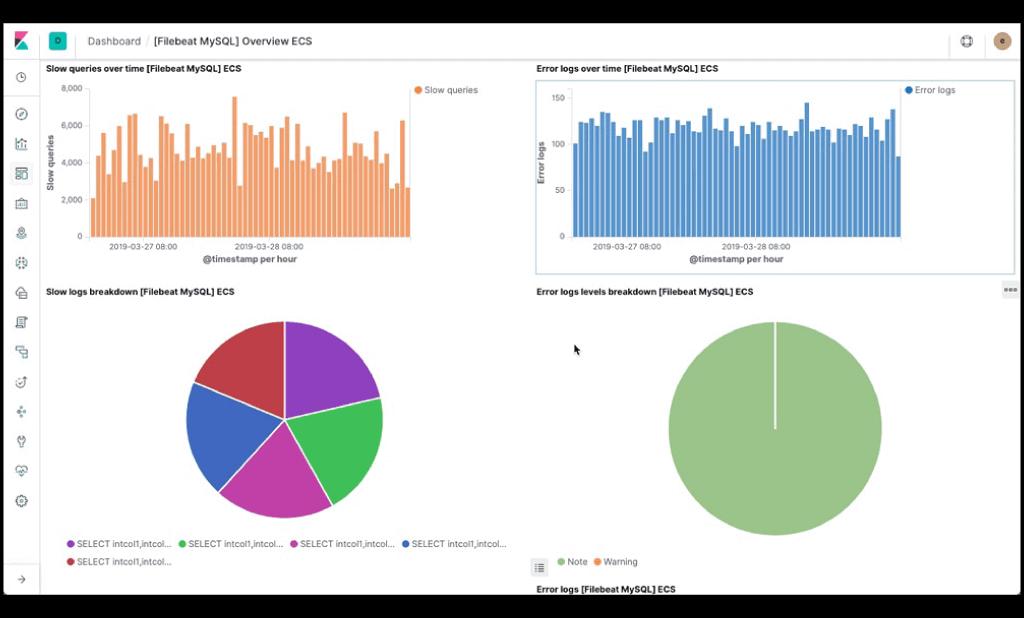
Infrastructure Modules: Instance dashboards——Audited, Docker, System, journals, Windows, Kubernetes dashboards make it simple to actively monitor your systems in Kibana. Use these pre-configured dashboards to get started quickly, and then adjust them to match your specific needs.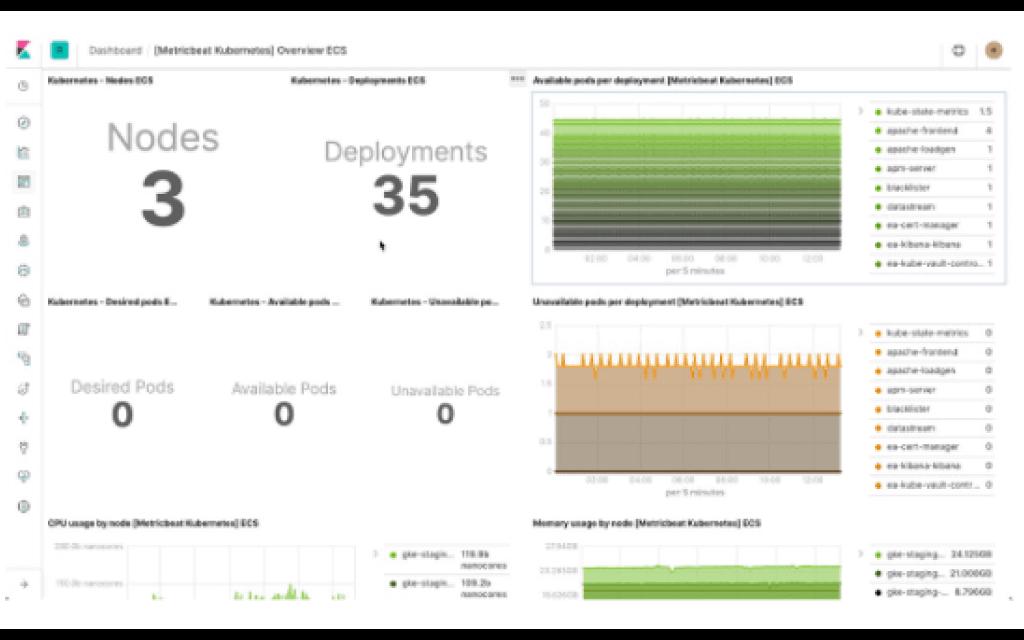
27. How do I visualize the data in Kibana?
Ans: Data can be transformed using a number of tables, maps, charts and other tools in Kibana's Visualize app. How to add visuals to a dashboard is detailed in the Kibana documentation.
The Visualize, map apps and Canvas in the Kibana left navigating side panel all enable users to view data from Elasticsearch. Standard graphs and charts, as well as Kibana Lens, are available in the Visualize app. Users can utilize Canvas to generate visual content reports and presentations using live data, as well as additional fine-grained formatting choices like custom CSS components. Users may map their spatial information using Elasticsearch indices as distinct layers in a complete view using Elastic Maps.
28. Explain about Elastic Machine learning features?
Ans: Elastic machine learning features simulate the behavior of your Elasticsearch information in real-time, including periodicity, trends, and more, to spot vulnerabilities quickly, accelerate root cause investigation, and eliminate false alarms. Following are the Elastic Machine Learning Features:
Alerting on anomalies: Combine monitoring with unsupervised machine learning characteristics to detect unusual activity that is difficult to characterize using guidelines and regulations. Then, when difficulties arise, use the anomalies values in the monitoring framework to be warned.
Population/Entity Analysis: This feature allows you to create a profile of what a "standard" client, device, or other entity performs over a set period, and then discover exceptions when their behavior deviates from the norm.
Log Message Categorization: The data in application log events are frequently fragmented and changeable. The static sections of the message are observed by elastic machine learning characteristics, which cluster consistent messages together and categorize them into message segments.
Root cause Indication: Elastic machine learning characteristics make it simple to determine the properties that greatly influenced an anomalous once it has been recognized. For example, if there's a sudden decline in operations, you can rapidly pinpoint the cause to a defective server or a mismatched switch that is causing the issue.
Data Visualizer: Data Visualizer analyzes the statistics and attributes in a file system or an existing database helps you to explain the Elasticsearch data and discover new areas for machine learning study.
Inference: Inference allows you to employ guided machine learning methods like classification or regression continuously rather than just as a batch analysis. Inference enables the application of developed machine learning methods to data received.
Language identification: A classification model for identifying the language of textual content. In an inference processor, you can use the language systems that are classified as a reference.
Model snapshots Management: In the event of an unanticipated disruptive event or other incidents that cause false anomalous detection results, quickly revert a prototype to the intended snapshot.
Anomaly detection on time series: Create reliable frameworks of acceptable behavior in the data to discover deviant anomalies in that data to automate the evaluation of time series data. Using innovative machine learning techniques, inconsistencies are recognized, rated, and linked to highly significant variables in the data.
-
- Anomalies in statistics, numbers, or frequencies occur over time.
- Rarity in statistics
- Unusual activity in a population member
29. Explain about Kibana Security?
Ans: The Elastic Stack's security measures provide appropriate access to the relevant individuals. This feature helps application, IT, Operation teams monitor well-intentioned people and keep malicious activity away, while administrators and consumers can rest assured knowing their data is kept secure and safe in the Elastic Stack.
30. Tell us about Index life management?
Ans: Index lifecycle management (ILM) allows users to design and implement a framework for deciding how long an index should survive in each of four stages, as well as the activities that should be conducted on the index throughout each phase. Because data may be placed in multiple resource tiers, this provides for greater cost control.
Hot: Updated and queried regularly.
Warm: the data hasn't been updated in a while, but it's still being queried.
Cold/Frozen: hasn't been updated in a long time and is rarely queried (search is possible, but slower)
Delete: this item is no longer required.
31. Explain about the term Snapshot lifecycle Management?
Ans: Snapshot lifecycle management (SLM) APIs act as a background snapshot manager, allowing operators to set the cycles at which an Elasticsearch network is snapshotted. SLM provides a specialized interface that enables users to configure persistence for SLM rules as well as create, schedule, and remove snapshots periodically, ensuring that adequate snapshots of a particular cluster are generated on a regular adequate time to restore under client SLAs.
Conclusion:
We tried to cover all the concepts and we hope the above Kibana interview questions and answers will help to crack your interview. If you’ve any queries or suggestions, comment below.
 On-Job Support Service
Online Work Support for your on-job roles.

Our work-support plans provide precise options as per your project tasks. Whether you are a newbie or an experienced professional seeking assistance in completing project tasks, we are here with the following plans to meet your custom needs:
- Pay Per Hour
- Pay Per Week
- Monthly
| Name | Dates | |
|---|---|---|
| Kibana Training | Aug 04 to Aug 19 | View Details |
| Kibana Training | Aug 08 to Aug 23 | View Details |
| Kibana Training | Aug 11 to Aug 26 | View Details |
| Kibana Training | Aug 15 to Aug 30 | View Details |

Viswanath is a passionate content writer of Mindmajix. He has expertise in Trending Domains like Data Science, Artificial Intelligence, Machine Learning, Blockchain, etc. His articles help the learners to get insights about the Domain. You can reach him on Linkedin


