- Home
- Blog
- Performance Testing
- LoadRunner Interview Questions

One of the best-licensed Performance Testing programmes on the market is LoadRunner. Because of the large range of protocols supported, it is best suited for most forthcoming technologies. Because there are hundreds of vacancies for Loadrunner developers, professionals must be familiar with all aspects of the Loadrunner technology. This is vital for pupils to have a thorough understanding of the subject in order to have better job chances in the future. Knowing everything there is to know about Loadrunner is the greatest way to solve the problems that come with it.
This comprehensive list of the greatest LoadRunner interview questions and answers 2024 will guide you through the subject and themes such as Performance Testing, Virtual User Generator, Controller, and Analysis. This list of LoadRunner interview questions and answers could lead to your next job as a Loadrunner specialist.
We have categorized LoadRunner Interview Questions - 2024 (Updated) into 3 levels they are:
Top 10 LoadRunner Interview Questions and Answers
- Which protocols are supported by LoadRunner?
- What is Performance Testing?
- Explain the Load Testing process?
- Explain various components of LoadRunner?
- What is the Rendezvous point?
- What are the Parameters considered for Performance Testing?
- What is Data Volume Testing?
- What is the difference between correlation and parameterization?
- How can we debug a LoadRunner script?
- How is Automated Correlation configured?
| If you want to enrich your career and become a professional in Software Automation Testing, then enroll in "Performance Testing Training". This course will help you to achieve excellence in this domain. |
Basic Load Runner Interview Questions
1. What is Load Runner?

Before going into production, LoadRunner is often used to test apps and websites to see how they react when subjected to varying amounts of demand. This is a crucial part of the process of developing new apps, as bad performance can result in big financial losses once they are online.
To run load tests, LoadRunner users must first create a load testing script with the VuGen component of the software and then specify how the test should be run using the system's controller. Load generators within LoadRunner will then simulate the behaviour of hundreds or even thousands of virtual users connecting to the app, behaving exactly as real users would for reliable testing, based on the app's set parameters.
2. What is the difference between Performance Testing and Performance Engineering?
Performance Testing involves specific processes and actions to uncover flaws, whereas performance engineering looks at the entire system to see where and how individual components may be improved.
3. Which protocols are supported by LoadRunner?
Many significant firms use Loadrunner because it supports a large number of protocols and is the sole tool that supports many of the Loadrunner communication protocols. Loadrunner is the only tool on the market that supports such a large number of protocols.
Complex communication protocols such as Citrix, Siebel, Flex, SMTP, and others are supported. The protocols that Loadrunner supports are listed below:
| C Vuser | It's a general-purpose virtual user that makes use of the C standard library. |
| .NET | It allows you to record Microsoft.Net applications. |
| Citrix ICA | Citrix ICA is a technology that allows you to execute specific applications from a distant computer. This protocol is used to record applications of this nature. |
| Ajax (Click & Script) | Ajax refers to a combination of asynchronous JavaScript and XML. This protocol makes use of asynchronous HTTP requests, thus instead of altering the entire web page, the graphs you're watching will change automatically. |
| Flex | Flex is an SDK that allows you to create rich online applications. The Action Message Format (AMF) protocol is used to send flash data via HTTP between a flash application and a server. |
| COM/DCOM | Developers utilise the Component Object Model (COM)/Distributed Component Object Model (DCOM) technologies to construct reusable software. |
| FTP(File Transfer Protocol) | FTP is a network protocol for transferring files from one computer to another. This protocol mimics the actions carried out on an FTP server. |
| Java over HTTP | Designed to record Java applets and programmes. Using web functions, it generates a Java language script. The fact that it can record and replay Java remote calls over HTTP sets it apart from other Java protocols. |
| Domain Name Resolution (DNS) | The DNS servers are tested using this protocol. It converts hostnames into IP addresses. You don't have any recording options, thus you'll have to manually enter each function in VuGen. |
| IMAP (Internet Messaging) | Client machines utilise this protocol to read emails from a mail server. |
| MMS(Media Player) | This protocol is used to record data from an MMS media player that uses the MMS protocol to access data from a media server. |
| Mobile Application | Allows native mobile applications to be recorded. |
| Java Record Replay | It is a general-purpose Java recorder that may be used to record and replay Java applications. |
| MAPI(Microsoft Exchange) | Messaging Application Programming Interface (MAPI) is an acronym for Messaging Application Programming Interface. It is a Microsoft programme designed for sending and receiving email messages. |
| LDAP(Listing Directory Service) | Email programmes that request contact information from servers use this protocol. |
| Java Vuser | Java is a programming language that includes protocol support. |
| MMS (Multimedia Messaging Service) | MMS (Multimedia Messaging Service) is a mobile messaging service that allows users to communicate photos and videos via a mobile network |
| SAP GUI | This protocol can be used to record applications that are integrated into critical business processes through the use of the SAP GUI client for Windows. |
| Silverlight | This protocol can be used to capture applications created with Microsoft Silverlight |
| ODBC | Open Database Connectivity, or ODBC, is a database access middleware API. |
| POP3(Post Office Protocol) | This protocol is used by applications that retrieve email messages from a mail server utilising the POP3 protocol. |
| Oracle – 2 Tier | This protocol can be used to record Oracle database applications that use a two-tier client-server architecture. |
| SAP – Web | This protocol can be used to track applications that connect to SAP servers through HTTP using SAP web clients. |
| Oracle – Web | This protocol can be used to capture web-based application activity. The activities performed on the Loadrunner API and Javascript levels are detected by this protocol. |
| Oracle NCA | This protocol is used to capture 3-tier applications that include a java client, a web server, and a database. |
| Siebel – Web | This protocol can be used to document Oracle Siebel Customer Relationship Management-based applications. |
| SAP (Click & Script) | This protocol can be used to keep track of applications that exchange data between a browser and an SAP server. |
| RDP(Remote Desktop Protocol) | This protocol can be used to capture applications running on distant PCs, such as those connected using Microsoft Remote Desktop. |
| TruClient – Firefox / IE | This protocol can be used to record applications written in modern javascript and used to perform user activities within the browser. |
| RTE (Remote Terminal Emulator) | This protocol can be used to record programmes that send and receive data from the server via terminals. |
| TruClient – Mobile Web | This protocol can be used to record applications created for mobile browsers that support javascript |
| Windows Sockets | For the Windows platform, there is a standard protocol for recording network programming interfaces. |
| SMTP(Simple Mail Protocol) | This protocol would be used to track programmes that connect to a mail server via the SMTP protocol. |
| Web Services | This protocol would be used to record web service applications that communicate over HTTP between two different applications. |
| Web (HTTP/HTML) | This protocol allows a web browser to communicate with a web server. |
| SMP (SAP Mobile Platform) | This protocol is often used to keep track of SAP Mobile Platform applications that have been created. |
4. What is Performance Testing?
Performance Testing is a type of non-functional software testing that evaluates how well an application's speed, stability, scalability, and responsiveness perform under varying loads. It's a critical step in guaranteeing software quality, but it's usually treated as an afterthought, to be completed after functional testing and, in most of the cases, after the code is ready for release.
Processing speed, application output, network bandwidth usage, data transfer velocity, maximum concurrent users, workload efficiency, memory utilization, and command response times are all evaluated during performance testing.
5. What are the types of Performance Testing in LoadRunner?
Performance testing is used to assess the performance of an application under various load and stress conditions. It's usually measured in terms of the time it takes for a user to respond to an action. It's made to put the system's entire performance to the test under severe load and stress.
Below are some of the different types of performance testing.
- Load: similar to volume testing, but for determining how an application handles enormous tasks.
- Stress: look at how the application behaves during spurts of high activity.
- Capacity: identify when response times become unsatisfactory by measuring total capacity.
6. What can I monitor with LoadRunner?
During a test run, keep an eye on system bottlenecks and collect and present performance metrics from each server and component.
7. Explain the Load Testing process?
Load testing is a type of performance testing in which any software, application, or website is subjected to a real-world load. Your app could fail terribly in real-world scenarios if you don't have it. That's why we create tools like Retrace to help you track application performance and identify errors before your code goes live. Load testing establishes if a system, piece of software, or computing equipment can manage high loads given a high demand from end-users by examining how the system responds under normal and high loads. When a software development project is nearing conclusion, this tool is frequently used.
End-to-end IT systems, as well as smaller components such as database servers and firewalls, can be subjected to a load test. Transaction reaction time is used to determine the system's or component's speed or capacity. The system is likely to have reached its full working capacity when system components drastically prolong reaction times or become unstable. When this occurs, bottlenecks must be identified and solutions offered.
8. What sort of transactions would you put into vuser_init and vuser_end?
vuser init() only includes transactions that are at the start of the user flow and only need to be run once during the test. For instance, a home page, a login page, and so on. At the start of the test, the vuser init() function is only called once.
vuser end() only includes transactions that are at the end of the user flow and only need to be run once throughout the test. Logout Page, for example. At the end of the test, the vuser end() method is only called once.

9. Explain Performance Testing Life Cycle.
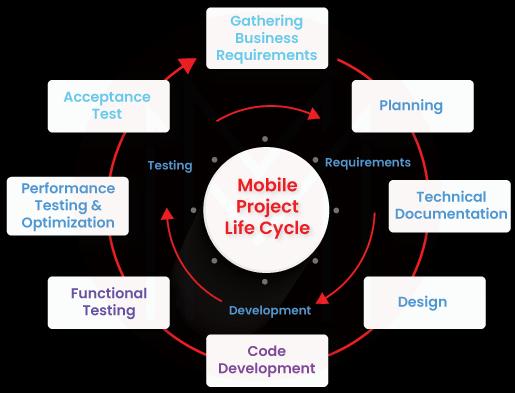
The Performance Testing Life Cycle is a method for performing non-functional testing on a software system or application in a systematic manner. This approach is used by almost all software businesses to schedule performance testing activities and identify performance bottlenecks in software systems.
The Requirement for a Life Cycle of Performance Testing
Performance testing was not as crucial a decade ago, which could explain why only a small portion of the world was using the technology and existing gear and software were satisfying their needs. There has been a shift in the situation. When a startup develops or launches a website or mobile application, one of the first things that come to mind is whether the application can manage X number of people. whether or not the application is responsive?
End customers, too, demand a speedy reaction to their mouse clicks. Day-by-day company and consumer requirements push down the developer to think of a more tuned programme that can handle multiple user loads with quick response. Now the question is, how can they assess an application's performance? What would the performance indicators be? Which components, and on what basis, should be included in performance testing?
To address all of these concerns, a process was devised in which performance testing operations were divided into a number of phases. The goal was to create a smooth and organized method for achieving the performance testing objective. This procedure is divided into phases, each of which has its own set of actions. All the steps are connected to a cycle termed “Performance Testing Life Cycle or PTLC”.
Performance Testing Life Cycle Phases
From risk assessment to test result analysis, PTLC defines the various stages of performance testing. It helps produce a responsive application with better performance by bridging the gap between the expected and actual results (only relevant to performance testing).
A concise rundown of the PTLC stages:
1. Risk Assessment
The goal is to see if the components are eligible for performance testing based on a risk assessment.
- Accountability: Manager/Leader of Performance Testing.
- Deliverable: Risk Assessment Document for Performance Testing.
2. Requirement Gathering & Analysis
Understanding the client's expectations and completing the requirements is the goal.
- Accountability: Manager/Leader of Performance Testing.
- Deliverable: Non-Functional Requirement Document is a deliverable (Performance Testing Requirement Document).
3. Performance Test Planning
The goal is to provide a test strategy that meets the Non-Functional Requirement.
- Accountability: Lead/Manager of Performance Testing.
- Deliverable: Documentation for the Performance Test Plan.
4. Performance Test Design (Scripting)
The goal is to write test scripts in accordance with the Performance Test Plan that has been authorized.
- Accountability: Engineer (Create)/Lead (Create/Review)/Analyst (Create)/Manager (Review) Members of the Performance Test Team.
- Deliverable: Scripts for Performance Testing.
5. Workload Modelling
Using test scripts, establish a workload scenario in accordance with the authorized Performance Test Plan.
- Accountability: Members of the Performance Test Team (Engineer/Analyst).
- Deliverable: Scenarios for Performance Testing.
6. Performance Test Execution & Result Analysis
The goal is to conduct performance tests in accordance with the authorized Performance Test Plan's schedules and to analyze the test findings.
- Accountability: Members of the Performance Test Team (Engineer/Analyst).
- Deliverable: Individual Test Results are a deliverable.
7. Reporting and Recommendation
The goal of this project is to compile and publish a test report as well as to make recommendations.
- Accountability: Lead/Manager of Performance Testing.
- Deliverable: Final Performance Test Report.
10. Explain various components of LoadRunner?
The following are some of the LoadRunner's essential components:
- Load Generator - It's used to run the script and generate the load against the application.
- VuGen - This programme is used to create and alter scripts.
- Controller - The Load Generator's instance is controlled, launched, and sequenced using the Controller.
- Agent Process - The Agent Process is used to handle the connection between the Load Generator and Controller instances.
- Analysis - It compiles logs from various load sources and generates reports for results visualization and data monitoring.
11. What are the advantages of LoadRunner?
Here are a few of the more notable perks.
- A system, end-user, and code-level bottlenecks are accurately identified.
- Determines the source of app performance issues.
- Reduces the expense of application downtime caused by performance problems.
- Allows new technologies to be used to test the performance of existing legacy applications.
- Testers can now test mobile applications.
- By anticipating software capacity and scalability, it is possible to reduce software and hardware expenses.
- Allows software teams to create intelligent service-level agreements before their product is live, allowing for faster application delivery.
- Allows you to keep track of how well your tools are being used.
- Access to global test materials using a web browser.
- The most efficient use of the load generator farm.
12. When Loadrunner Is Used?
Micro Focus developed LoadRunner, a software testing tool. It's used to test programmes and when a system is under load, it's important to monitor its behaviour and performance. LoadRunner can simulate thousands of users running application software at the same time, capturing and assessing key component performance.
| Check out Best Software Testing Tools |
13. How to Configure LoadRunner Monitors?
In LoadRunner Controller, monitors are set up to check the behaviour of various parameters during the load test. Run-time, Transaction, Web Resource, System Resource, Network, Firewall, Web Application Server, Database Server Resource, and more monitors are available in LoadRunner Controller. Some of these monitors are configured automatically, and their statistics are displayed while you run your test, but the majority of them require configuration. In this blog post, I'll show you how to configure Windows Resources monitors step by step (the method is quite similar to configuring any other monitor as well).
Configuring Windows Resource Monitors in Controller involves the following two basic steps:
- Adding the server machine that will be monitored.
- Including Measurement of Resources.
14. What is Correlation and why do we need correlating statements?
When dealing with dynamic numbers in a test script, correlation is used. The dynamic values may change for different users or depending on each user's action (value changes when the same user repeats the action) (value changes when action is replayed with different users). In all cases, these values are kept by correlation, ensuring that they do not degrade during execution.
There are two approaches, to begin we can seek correlations and evaluate a list of possible values. From this, we can choose a value to correlate. Second, we can compare two texts by recording them. We may find which values need to be associated in the difference file.
15. What is Stress Testing?
Stress testing is a type of non-functional testing that is used in performance testing. The system is monitored after it has been overloaded during stress testing to determine that it can withstand the stress.
The system's recovery from such a state (after stress) is crucial, as it is quite likely to occur in a production setting.
16. What is an Agent in Loadrunner?
The LoadRunner agent facilitates communication between the Controller and the load generator. The Controller informs the Remote Agent Dispatcher (Process) to activate the LoadRunner agent when you execute a scenario. The agent receives commands from the Controller to start, stop, and pause Vusers.
17. How many users can I emulate with LoadRunner on a PC?
There are no dead ends. It is dependent on the system's response. That, in turn, is dependent on a variety of factors such as the overall system configuration. If a system bottleneck is discovered early on or with a small number of Vusers, no more Vusers will be considered until the bottleneck is remedied.
18. What are Vusers and Vuser scripts?
LoadRunner replaces real users with virtual users, or Vusers, in this instance. While a workstation can only handle one human user, a single workstation can accommodate several Vusers. In reality, tens, hundreds, or even thousands of Vusers can be found in a single scenario.
A Vuser script describes the actions that a Vuser takes during the scenario. Each Vuser runs a Vuser script when a scenario is run. Functions in the Vuser scripts measure and record the performance of your application's components.
19. List out some common Performance bottlenecks.
Monitoring the application against load and stress conditions helps detect bottlenecks. We utilize Load Runner to discover bottlenecks in performance testing since it has a variety of monitors, including run-time monitors, web resource monitors, network delay monitors, firewall monitors, database server monitors, ERP server resources monitors, and Java performance monitors. These monitors can assist us to figure out what's causing the application's slow response time.
Response time, throughput, hits per second, network latency graphs, and other metrics are used to evaluate the app's performance.
20. When would you run a script in VuGen and when would you run it in Controller?
VuGen is an abbreviation for Virtual User Generator, and it is where the actual scripting takes place. Running in VuGen is useful for writing or debugging scripts because it allows you to quickly see where a script fails, what the response is, and what needs to be changed. You can also step through the code line by line (F10) to see how variable values change throughout your script more precisely. It's really only useful for testing scripts with a single user. Running in VuGen is also limited to your local machine. When you're ready to run a load test, go to Controller.
The Controller functions similarly to the command centre in LoadRunner: from the Controller, you can ramp up the number of users and select from various scenario configuration settings to tailor your workload model to the scenario you're attempting to test. The controller also runs the scripts headlessly; it does not launch a separate instance of VuGen for each user, so it consumes far more resources. You can also configure remote load generators and run scripts on them using Controller.
21. What is Hit Per Seconds?
The number of HTTP requests sent by the user(s) to the Web server in a second is referred to as 'hits per second.' There is a significant difference in Transactions per second and Hits per second when it comes to performance testing. A single transaction can result in multiple server hits. In web testing terminology, a transaction is nothing more than a collection of requests. A LoadRunner script of a web-based application has some transactions that encapsulate requests into a group, for example, a login operation that involves 5 HTTP requests can be grouped together into a single transaction, so when you read a 'Transactions per second' graph and only 1 dot appears, you can see 5 dots in the 'Hits per second' graph.
22. What is the Rendezvous point?
The rendezvous point is used in LoadRunner to force Vusers to perform simultaneous tasks during test execution. It places a heavy user load on the server for a specific functionality/page and instructs LoadRunner to measure server performance in such a case. Rendezvous point instructs Vusers to wait for multiple Vusers to arrive at a specific point during test execution so that they can perform a task at the same time.
Advanced Load Runner Interview Questions
23. What is the process for developing a Vuser Script?
Creating a vuser script consists of the following four steps:
- Capture the Vuser Script.
- Enhance the recorded vuser script by playing it back.
- Define and test the various run-time settings.
- Use the script in a LoadRunner scenario.
24. What LoadRunner component would you use to run the script in multi-user mode?
To make the server feel like it's under a lot of loads, Rendezvous points can be included in Vuser scripts. Rendezvous points tell Vusers to wait for numerous Vusers to arrive at a specific point during test execution so that they can accomplish a job at the same time. You can, for example, To mimic peak stress on the bank server, and implement a rendezvous point directing 100 Vusers to make simultaneous deposits into their accounts.
| Check out Automation Testing vs Manual Testing |
25. Why VUGen is used in LR?
VuGen can be used to create test scripts that replicate app connections, as well as to create a specific search, product comparison, purchase, or payment type.
VuGen has the ability to record client-server communications and generate Vuser scripts, which are test scripts written in code.
26. What is the think of time? How do you change the threshold?
The amount of time a genuine user spends thinking between actions is called think time. When a user receives data from a server, for example, the user may take a few seconds to analyze the information before reacting. The think time is the name given to this period of time. Changing the Barrel: The threshold level is the point at which the recorded think time is disregarded. Five (5) seconds is the default value. In the Vugen's Recording options, we can alter the thought time threshold.
27. What is Spike Testing?
Spike testing is a kind of performance testing in which the demand on an application is suddenly increased or decreased. Spike testing is used to see how a software programme reacts when it is subjected to large fluctuations in traffic. Spike testing confirms the application's recovery time between activity spikes as well as the application's maximum load. The term "spike" refers to a quick change in traffic volume.
28. How does LoadRunner execute a performance scenario?
The load test scenario is simple to build and perform. The procedure includes the stages below:
- Preparing for the test: Successful load testing necessitates a well-thought-out test strategy.
- Vuser Script should be prepared.: Each Vuser or several Vusers complete tasks in the script.
- Create a scenario: A scenario is a description of what happens during a testing session. It contains a list of machines on which the Vuser will run, a list of scripts that the Vuser will run, and the count of Vusers.
- Carry out the scenario: Simulate server load by using numerous Vusers to complete the task.
- Keep an eye on your results: Database resources, transaction resources, and firewall resources can all be monitored using the LR online run-time.
- Analyze the outcomes: It generates graphs as well as reports. They can be used to assess an application's performance.
29. Which LoadRunner component would you use to record a script?
The Virtual User Generator (VuGen) component is generally used to create Vuser scripts for a number of application kinds and protocols of communication.
30. What are the Parameters considered for Performance Testing?
During performance testing, the following basic parameters are monitored:
- Processor Usage: It is the amount of time a processor spends running threads that aren't idle.
- Memory usage: The amount of physical memory available to computer operations.
- Disk time: The length of time a read or write request takes the disc to complete.
- Bandwidth: Displays how many bits per second a network interface uses.
- Private bytes: Private bytes are the bytes that a process has set aside that cannot be shared with other processes. These are used to track memory leaks and consumption.
- Committed memory: Committed memory refers to the quantity of virtual memory that has been used.
- Memory pages/second: The number of pages written to or read from the disc to fix hard page faults. When code from outside the current working set is called up and fetched from a disc, a hard page fault occurs.
- Page faults per second: The processor's overall rate of processing fault pages. When a process requests code from outside its working set, this happens again.
- CPU interrupts per second: The average number of hardware interrupts a processor receives and processes each second is measured in CPU interrupts per second.
- Disk queue length: The average number of read and write requests queued for the given disc during a sample interval is known as disc queue length.
- Network output queue length: The number of packets in the output packet queue. If there are more than two, there will be a delay, and bottlenecking must be avoided.
- Network bytes total per second: Total bytes sent and received on the network per second - rate of bytes sent and received on the interface, including framing characters.
- Response time: Response time is the time it takes for a user to enter a request and receive the first character of the response.
- Throughput: The rate at which a computer or network receives requests per second is known as throughput.
- Amount of connection pooling: Connection pooling capacity - the number of users requests that pooled connections can handle. The performance will improve as more requests are served by connections in the pool.
- Maximum active sessions: The maximum number of active sessions is the number of sessions that can be active at the same time.
- Hit ratios: It refer to the number of SQL statements that are processed by cached data rather than costly I/O operations. If you're having trouble with bottlenecking, this is a fantastic place to start.
- Hits per second: the number of requests sent to a web server per second during a load test.
- Rollback segment: The quantity of data that can be rolled back at any moment in time is known as the rollback segment.
- Database locks: Table and database locking must be closely maintained and fine-tuned.
- Top delays: Top delays are tracked to see what wait times can be reduced when dealing with how quickly data can be recovered from memory.
- Thread counts: The number of running and active threads can be used to assess the health of a programme.
- Garbage collection: Garbage collection refers to the process of returning unneeded memory to the system. Garbage collection must be closely checked for effectiveness.
31. How is LoadRunner pacing different from how it’s implemented in other tools?
Many test tools allow users to set fixed or variable pacing that adds to the length of time it takes to complete one iteration.
LoadRunner has a pacing functionality that allows you to set a time and then add a variable amount of time to your test based on the response times for the included transactions. So, if you set pacing to 5 minutes and one iteration takes 3 minutes to complete, LoadRunner will wait 2 minutes before starting the next one. If it takes 6 minutes, it will not add any additional wait time and will instead proceed to the next iteration. This is useful because it allows you to more accurately predict how many transactions the script will perform in a given amount of time.
32. What are the different sections of the script? In what sequence do these sections run?
Vuser init, Action, and Vuser end is the three portions of the LoadRunner script.
- Vuser init contains login requests/actions for the application/server.
- The action contains actual code that is used to test the application's operation. Iterations of this game can be played several times.
- Requests/actions in Vuser end are used to log out of the application/server.
These sections are executed in the following order: Vuser init at the beginning, Vuser end at the end. Between the two, the action is carried out.
33. How many VUsers are required for load testing?
The count of VUsers required for a performance test is determined by the system under test, network setups, hardware settings, RAM, operating system, and software applications. Vuser can't possibly have a generic value.
34. What is Loadrunner API Function?
Source of the information Client programme is not controlled by vuser. Database vusers can access data from the server using the LoadRunner API function.
35. What is the need of Checkpoints in LR?
When performing a test, we may need to check if a specific piece of content is present on the returned page. While the script is running, a content check confirms the expected information displayed on the Web page.
There are two kinds of content checks:
- Text Check: Verifies the presence of a text string on a web page.
- Image Checks: examines a web page for an image.
36. What are the different types of goals in the goal-oriented scenario?
In the Goal-Oriented Scenario, LoadRunner has five different sorts of goals. These are the following:
- The number of Vusers who are online at the same time.
- The number of hits per second is a measure of how busy a website is.
- The rate at which transactions are processed per second.
- The rate at which pages are produced every minute.
- The reaction time for a transaction.
37. What is Data Volume Testing?
Non-functional testing is a sort of volume testing. This testing is done to see how well the database handles large amounts of data. Non-functional testing, also known as volume testing or flood testing, is used to evaluate a software or app's performance against large amounts of data in a database.
The database is pushed to its limit by loading it with a significant amount of data, and then the system is put to the test.
This was the theoretical aspect; now let me explain the 'when' element of volume testing with a few practical examples.
38. Which LoadRunner Component does the recording of the performance test scenario?
During scenario execution, LoadRunner logs the application's performance under various loads. The test execution statistics are saved, and a detailed analysis is carried out. The 'HP Analysis' application generates a variety of graphs that aid in determining the root reasons of system performance lags and system failures.
39. How do you identify which protocol to use for any application?
Previously, Performance testers had to rely heavily on the development team for information about the protocol that the application uses to communicate with the server. It used to be speculative at times as well.
From version 9.5 onwards, however, LoadRunner provides invaluable assistance in the shape of Protocol Advisor. The protocol advisor recognizes the application's protocols and proposes possible protocols for which a script might be written to emulate a real user.
40. What's the difference between running the Vuser as in a process versus running it as a thread? Which method of operating Vuser is more advantageous?
The identical driver programme is generally loaded into memory for each of the Vuser when Vuser is run as a process. This will demand a lot of memory, and You will be limited in the number of Vusers on a single generator, you can run.
Only one instance of the driver programme is shared by a specified number of Vusers when Vuser is run as a thread. On a single generator, the multi-threading option permits you to run many Vusers.
41. In LoadRunner, how many different sorts of VUsers are there?
RTE (terminal emulator), Vuser, SAP Vuser, PeopleSoft, GUI Vuser, Web Vuser, Java, and other Vuser types exist in LoadRunner.
42. How To Create A Scenario?
On the host, we'll need to install a LoadRunner controller. Then we add a list of hosts (where the vuser script runs), vuser scripts (where vuser executes), and a list of vusers who run during the scenario.
43. What does the recording mode for the web Vuser script mean?
By recording a user doing common business procedures on a client application, we use VuGen to create a Vuser script. The script is created by VuGen by recording the behaviour between the client and the server. VuGen, for example, watches the database client end and tracks all requests received and sent to the database server in web-based applications. We utilize VuGen to: Monitor the application's and server's communication; Created function calls are inserted into a Vuser script after generating the required function calls.
44. What is Parameterizion?
Parameterization is a technique for replacing a hardcoded variable, such as an application URL, User Name, or Password, with a parameter that accepts multiple input values.
45. What is Endurance Testing?
Endurance is defined as "the ability of something to last or withstand wear and damage." Simply put, durability, enduring power, or longevity are all terms that can be used to describe it.
Endurance testing is a type of non-functional testing performed to see if a software system can tolerate a big expected load for a long time.
46. What is filtering and sorting?
We can filter the data to show just the things that fit the criteria we specify (filter box). You can filter vusers to only show those who are ready. Sorting - All of the vusers in the vuser list can be sorted. In order to find out what their vuser ID is (1,2,3,4,5,6,7,8,9).
47. What Is a Host?
The host is the machine that runs the vuser script.
48. What is the advantage of running the Vuser as a thread?
VuGen has the ability to employ many threads. This makes it possible to execute per generator on a larger number of Vusers. When the Vuser is executed as a process, Each Vuser has the identical driver programme put into memory, which consumes a significant memory capacity. There is a limit to the number of Vusers that can be run on a single generator as a result of this. Only one instance in the driver programme is loaded into the memory for the stated number of Vusers when the Vuser is run as a thread (say 100). More Vusers can be launched per generator because each thread shares the memory of the parent driver programme.
49. What is Load Generator and how to test the load generator connection?
The Load Generator is used to increase the application's load by launching more Vusers. A large number of load generators, each housing a large number of Vusers, can be employed.
- Check the connection between the Load Generator and the computer.
- When we execute a scenario, the controller immediately connects to the load generators. Before we execute the scenario, we can test the connection.
- SELECT LOCALHOST and press the CONNECT button.
- The controller tries to connect to the machines that generate the load.
50. What methods do you use to discover performance bottlenecks?
Monitoring the application's performance can help identify performance bottlenecks. Run-time monitors, transaction monitors, web resource monitors, network delay monitors, firewall monitors, database server monitors, streaming media monitors, ERP server resources monitors, and Java performance monitors are all available in Load Runner. This will allow us to pinpoint the problematic section of the application, which could be the source of the longer response time. Performance response time, hits/sec, throughput, network latency graphs, and other metrics are commonly used.
| Related Article, Performance Testing Interview Questions and Answers that help you grab high-paying jobs |
51. How to run a scenario?
To run a scenario, open one of the scenarios which already exists → Set up the situation → Run the scenario after setting the result directory.
Load Runner Interview Questions For Experienced
52. Where do you set the options for Automated Correlation?
In the correlation tab and recording options, you can enable automatic correlation from a web perspective. We can select to enable correlation for the entire script and choose whether to send online messages or perform offline actions, as well as create correlation rules. Automatic database correlation may be done by selecting the correlate query tab and selecting whatever query value we want to correlate from the show output window and scanning for correlation. We just construct a correlation for the value and define how the value will be formed if we know the precise value to be connected.
53. Explain the difference between Automatic Correlation and Manual Correlation?
Manual correlation includes figuring out the initial occurrence of the dynamic value, defining the unique bounds for capturing dynamic value, and writing the correlation function web reg save param before the request with the response's initial occurrence of a dynamic value in its response are all part of the correlation process.
Automated correlation follows a set of predetermined rules. When the script fails, it is replayed and examined for autocorrelation. Vugen locates the location where the correlation rules are in effect and correlates the value upon approval.
54. What is the difference between Correlation and Parameterization?
The following are the distinctions between correlation and parameterization:
- Dynamically created values or data are used throughout the script in correlation, whereas user-specified or user-provided values are used in parameterization.
- In correlation, the server provides the values automatically, but in parameterization, the database provides the values manually.
- In correlation, the tester is unaware of these values, whereas, in parameterization, the tester is aware of these values.
- Correlation is sometimes required, but parameterization is not.
55. What is the significance of Vuser-init?
Before the real programme is executed, Vuser-init records the pre-operations, also known as initialization operations.
56. What are reports provided by the analysis window?
We can view reports that describe the system's performance after running a scenario. The following reports are included in the analysis:
- SUMMARY Report: It gives a high-level overview of the scenario executed. The summary report can be viewed at any time from the analysis window.
- HTML Report: For each open graph, the analysis generates an HTML report.
- TRANSACTION Report: offers information on the performance of the transaction defined in the Vuser scripts. These reports include a statistical breakdown of the results as well as the ability to print and export the data.
57. What is an extended log?
The output log receives comprehensive script execution messages from the extended log. When troubleshooting the script, you can use the enhanced log. It records the log at three levels: parameter, server data, and advanced.
58. Why do you create parameters?
You'll need to change the hard-coded value in the script with a parameter to create a parameter. This enables a single Vuser to be run multiple times with different data each time. It stops a server from caching results, which helps to stimulate more real-world server demand.
59. What is a Simultaneous user in load runner?
The term "simultaneous" refers to occurrences that occur at the same moment. When all users are instructed to conduct the same transaction at the same time during performance testing, those users are referred to as "Simultaneous Users."
60. Define throughput and how it relates to response time?
The volume of transactions produced over time during a test is referred to as throughput, which is the number of transactions per second that an application can manage. There are many users doing many different requests for each application.
Throughput and response time are linked. As you raise total throughput, the response time for an average transaction tends to drop.
However, by directing a disproportionate amount of resources to a given query, you can reduce response time for that query at the price of overall throughput. On the other hand, you can maintain overall throughput by limiting the resources allocated by the database to a large query.
When trying to reconcile the ongoing demand for high transaction throughput with an immediate need to run a large decision-support query, the trade-off between throughput and response time becomes apparent.
The more resources you devote to a query, the fewer resources you have to execute transactions, and the greater the impact your query will have on transaction throughput. On the other hand, the fewer resources you give the query, the longer it will take.
61. In LoadRunner, what is the difference between a transaction and a transaction instance?
A LoadRunner transaction is utilized to track how long it takes for particular statements to execute.
A LoadRunner transaction instance is utilized to analyze the performance of a previously defined Transaction in your script. You save the Transaction's name in a variable that can be used to investigate its status later: Get the current duration, status, and other information about it.
62. In Load Runner, what is the elapsed time?
Elapsed time refers to the amount of time that has passed since the start of the present event, and it is calculated differently for each screen, as seen below —
In the Scenario Status Window, the elapsed time begins when you press the "Initialize/Run Vuser?" or "Start Scenario" button.
The elapsed time in the "Vuser" window is calculated from the time Vuser enters the "running" state.
63. Is it true that caching has a detrimental impact on load testing results?
Yes. The practice of caching has a detrimental impact. Your surfing history is saved in a cache, which is a temporary memory. Because the majority of the information required to load the page is retrieved from the cache rather than the server, the time it takes to load a page for the second time will be shorter than the time it takes to load the page for the first time. The reaction times in your test will be affected as a result of this. As a result, caching should be disabled.
64. What's the difference between a Correlate graph and an Overlay graph?
Graph with an overlay:
- One X-axis and two Y axes make up the overlay graph.
- On the merged graph, the left Y-axis displays the current graph's value, while the right Y-axis displays the value of the graph's Y-axis that was merged.
Graph of Correlation:
- There are two graphs, and the Y-axis of the active graph becomes the X-axis of the merged graph.
- The Y-axis of the combined graph becomes the Y-axis of the merged graph.
65. How can we debug a LoadRunner script?
The options dialogue box's Debug settings allow you to choose the extent to which you want to track performance throughout scenario running. The debugging information is written to the output window. Using the 'lr set debut message' method, the message class can be explicitly set within the script.
66. How will you handle the situation in scripting where for your mailbox you have to select any one mail randomly to read?
We'll do this by recording the script for reading the first email. Look for information in the request to read the first mail, such as mail ids or row numbers.
We'll try to capture all the email ids row numbers with the correlation function and keep the Ordinal as All, i.e. ORD=All, from the post where a list of emails is reflected. Replace any of the randomly picked email ids from the list of captured email ids in the read post with the specified email id.
67. How is Automated Correlation configured?
General Options → Correlation can be used to change any Automated Correlation settings. Recording options → Correlations is where you establish the correlation rules.
68. How do concurrent users are differing from simultaneous users?
- Simultaneous: Each user will be on the system at the same time, but will be completing distinct tasks.
- Concurrent: Each user is present in the system and performing the same task at the same time.
69. How does caching affect performance testing results?
When data is cached in the server's memory, there is no need for the server to fetch the result, and there is no server activity. The test results do not reflect the performance of real users that used the app with varied data.
70. How will you stop the execution of the script on error?
The lr_abort function can be used to accomplish this. The function tells the Vuser to skip the Action part and go straight to the vuser end section to finish the job. This function comes in handy when dealing with a specific problem.
This can also be used to handle a circumstance when execution is not possible, rather than an error. The function set the status of the Vuser that has halted owing to the lr abort function to "Stopped." "Continue on error" should be unchecked in the Run-Time setting.
72. What is Protocol Advisor?
Protocol Advisor will be utilised to determine which call should be used to record a Vuser Script.
73. What is Recording Report?
It's a new feature in Virtual User Generator that was introduced in V12.56. It includes the Recording Summary Report, which includes a number of statistics for your web protocol recording.
It displays the response codes we receive in the shape of a pie chart, the time it took to record the response, and all-important details such as requests and connections in one location.
Conclusion
It doesn't matter how much information you collect to learn a topic; what counts is how concise you make it. We've tried to condense LoadRunner's top interview questions and answers in this blog. I hope that all of these questions and answers have helped you better understand and appreciate the various Performance Testing using Load Runner. If you come across any related questions that aren't answered here, please let us know in the comments section and we'll add them as soon as possible.
 On-Job Support Service
Online Work Support for your on-job roles.

Our work-support plans provide precise options as per your project tasks. Whether you are a newbie or an experienced professional seeking assistance in completing project tasks, we are here with the following plans to meet your custom needs:
- Pay Per Hour
- Pay Per Week
- Monthly
| Name | Dates | |
|---|---|---|
| Performance Testing Training | Aug 01 to Aug 16 | View Details |
| Performance Testing Training | Aug 04 to Aug 19 | View Details |
| Performance Testing Training | Aug 08 to Aug 23 | View Details |
| Performance Testing Training | Aug 11 to Aug 26 | View Details |

Viswanath is a passionate content writer of Mindmajix. He has expertise in Trending Domains like Data Science, Artificial Intelligence, Machine Learning, Blockchain, etc. His articles help the learners to get insights about the Domain. You can reach him on Linkedin