- Dataflow Programming and Data Types in LabVIEW
- LabVIEW Interview Questions
- LabVIEW Programming
- LabVIEW Tutorial
- LabVIEW Graphs and Charts
- Initializing Arrays In Labview
- Introduction of Repetition And Loops in LabVIEW
- Local and Global Variables in LabVIEW Tutorial
- Overview Of Clusters In Labview
- Shift Registers in LabVIEW
- Labview Structures
- LabVIEW Projects and Use Cases
- How to install LabVIEW on Windows
LabVIEW, or Laboratory Virtual Instrument Engineering Workbench, is a graphical programming environment used in industries for system design, instrument control, data acquisition, and automation.
In LabVIEW, you will create Virtual Instruments similar to programs used in text-based programming languages. A LabVIEW block diagram is a part of virtual programming.
This blog post explains the LabVIEW block diagram and provides a step-by-step procedure to create a block diagram.
Table of Contents:
- Block Diagram in LabVIEW
- Key components
- Using SubVIs in LabVIEW block diagrams
- LabVIEW block diagram example
- Hardware interface
- SubVI debugging and error handling
- Advantages
- Frequently Asked Questions
Block Diagram in LabVIEW:
LabVIEW block diagram consists of various graphical components representing I/O operations, functions, and data flow.
You will simply use LabVIEW block diagrams to separate the graphical source code from the user interface. The front panel in LabVIEW has a user interface where you can enter inputs and get output.
The LabVIEW block diagram lets you see how data flows between various LabVIEW components.
| If you're looking to deepen your understanding of LabVIEW, explore comprehensive LabVIEW training that covers all key concepts. Enhance your skills further by visiting this LabVIEW Course Online. |
Key components of a LabVIEW Block Diagram:
A LabVIEW block diagram can be constructed with many components, including functions, controls, wires, indicators, etc. These are instrumental in developing LabVIEW Virtual Instruments.
Let’s take a deep look at the components in this section.
1. Functions
Functions are the heart of any LabVIEW block diagram. The icon of all LabVIEW functions will have a pale yellow background. Functions include mathematical operations, signal processing, data analysis and manipulation, and more.
In LabVIEW, functions are grouped into many categories, as outlined below.
- Mathematics: This group includes the functions for arithmetic, trigonometric and logarithmic operations.
- Programming: It has functions for logic, Boolean, array, loops, synchronisation, and more.
- Instrument I/O: This group contains interface functions such as instrument drivers, GPIB, NI-VISA, etc.
- Data communication: It has functions to enable communication, including protocols, network streams, variables, data sockets, synchronisation, and more.

2. Wires
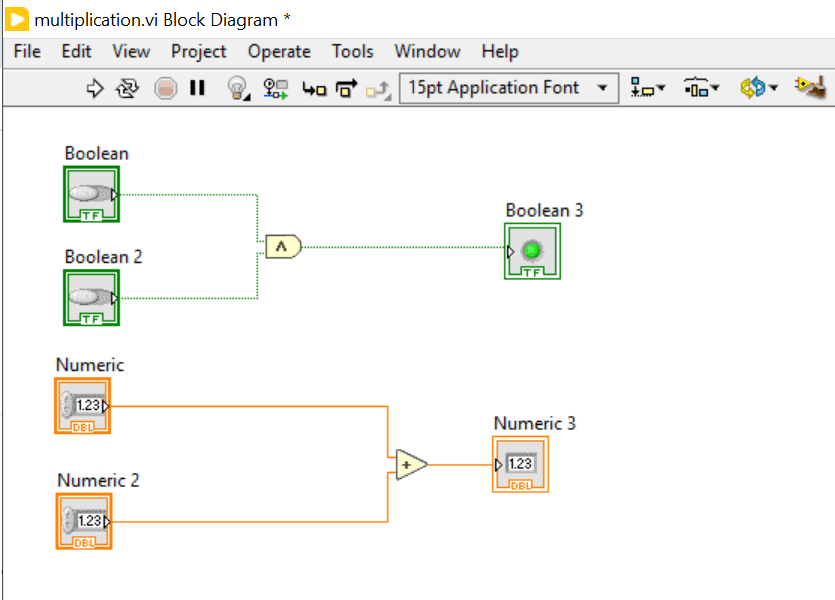
In LabVIEW, you will use wires to connect controls, indicators, and functions. Wires show the data flow between different components in a block diagram, allowing you to track data flow closely and troubleshoot it if necessary.
Depending on their data types, you can find wires in different styles, colours, and thicknesses. Here are more details:
- Orange or Blue wire – It shows the numeric data flow
- Pink wire – It shows the string data flow
- Green wire – It shows the Boolean data flow
Wire Features
-
- Data in a block diagram flows in the directions of wires
- A broken wire appears as a dashed black line with an X in the middle of the wire.
- Broken wires occur when you try to wire two objects with incompatible data types. For example, you cannot wire between numeric and array data types.
- The direction of the wires must be correct. A wire must connect one input and one output to the least.
- You cannot wire two indicators together.
- You can right-click on wires and select ‘Clean Up Wire’ to remove broken wires.
SubVIs
3. Terminals
- Terminals are entry and exit ports in LabVIEW. They interchange information between the front panel and the block diagram.
- They are similar to parameters and constants used in text-based programming.
- Below are the types of terminals:
- Control
- Node terminal
- Indicator terminal
4. Controls
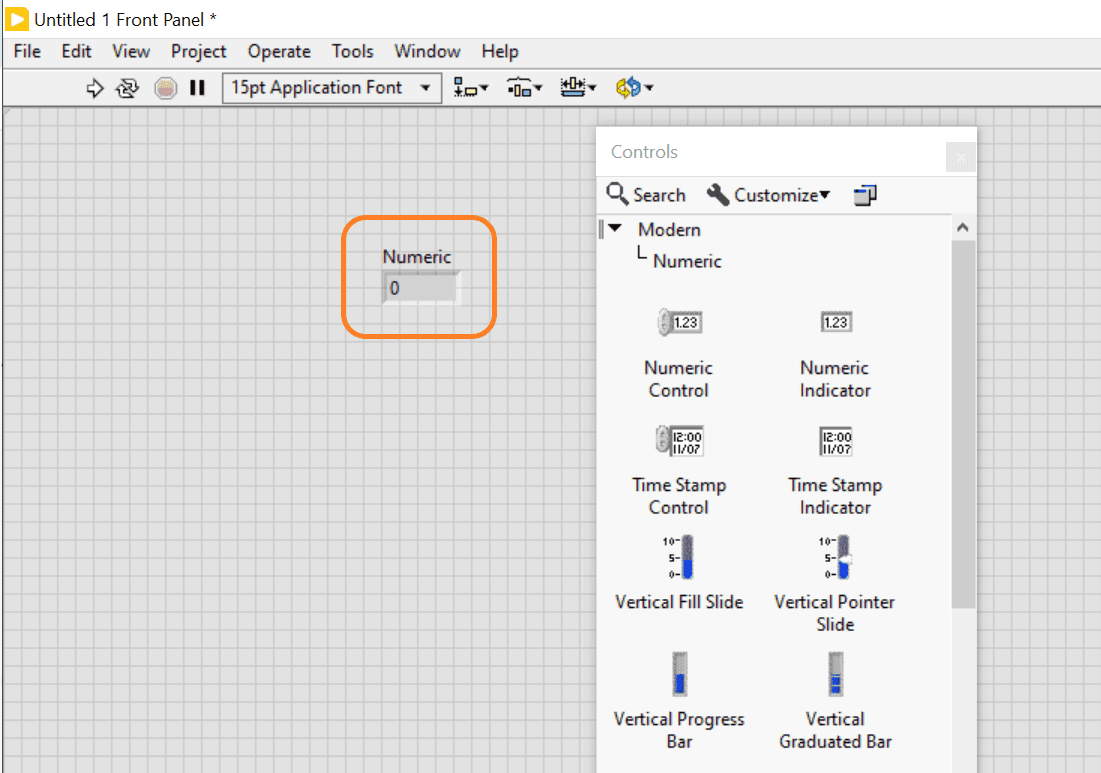
- Controls are located on the front panel
- They are represented as terminals and send inputs to VIs
- Some control examples are numeric input boxes, sliders, buttons, and dials.
5. Indicators
- Indicators are the outputs of VI and display results.
- There are also terminals on the block diagram to get output data.
- LEDs, Graphs, and numeric displays are some of the indicators.
6. Structures
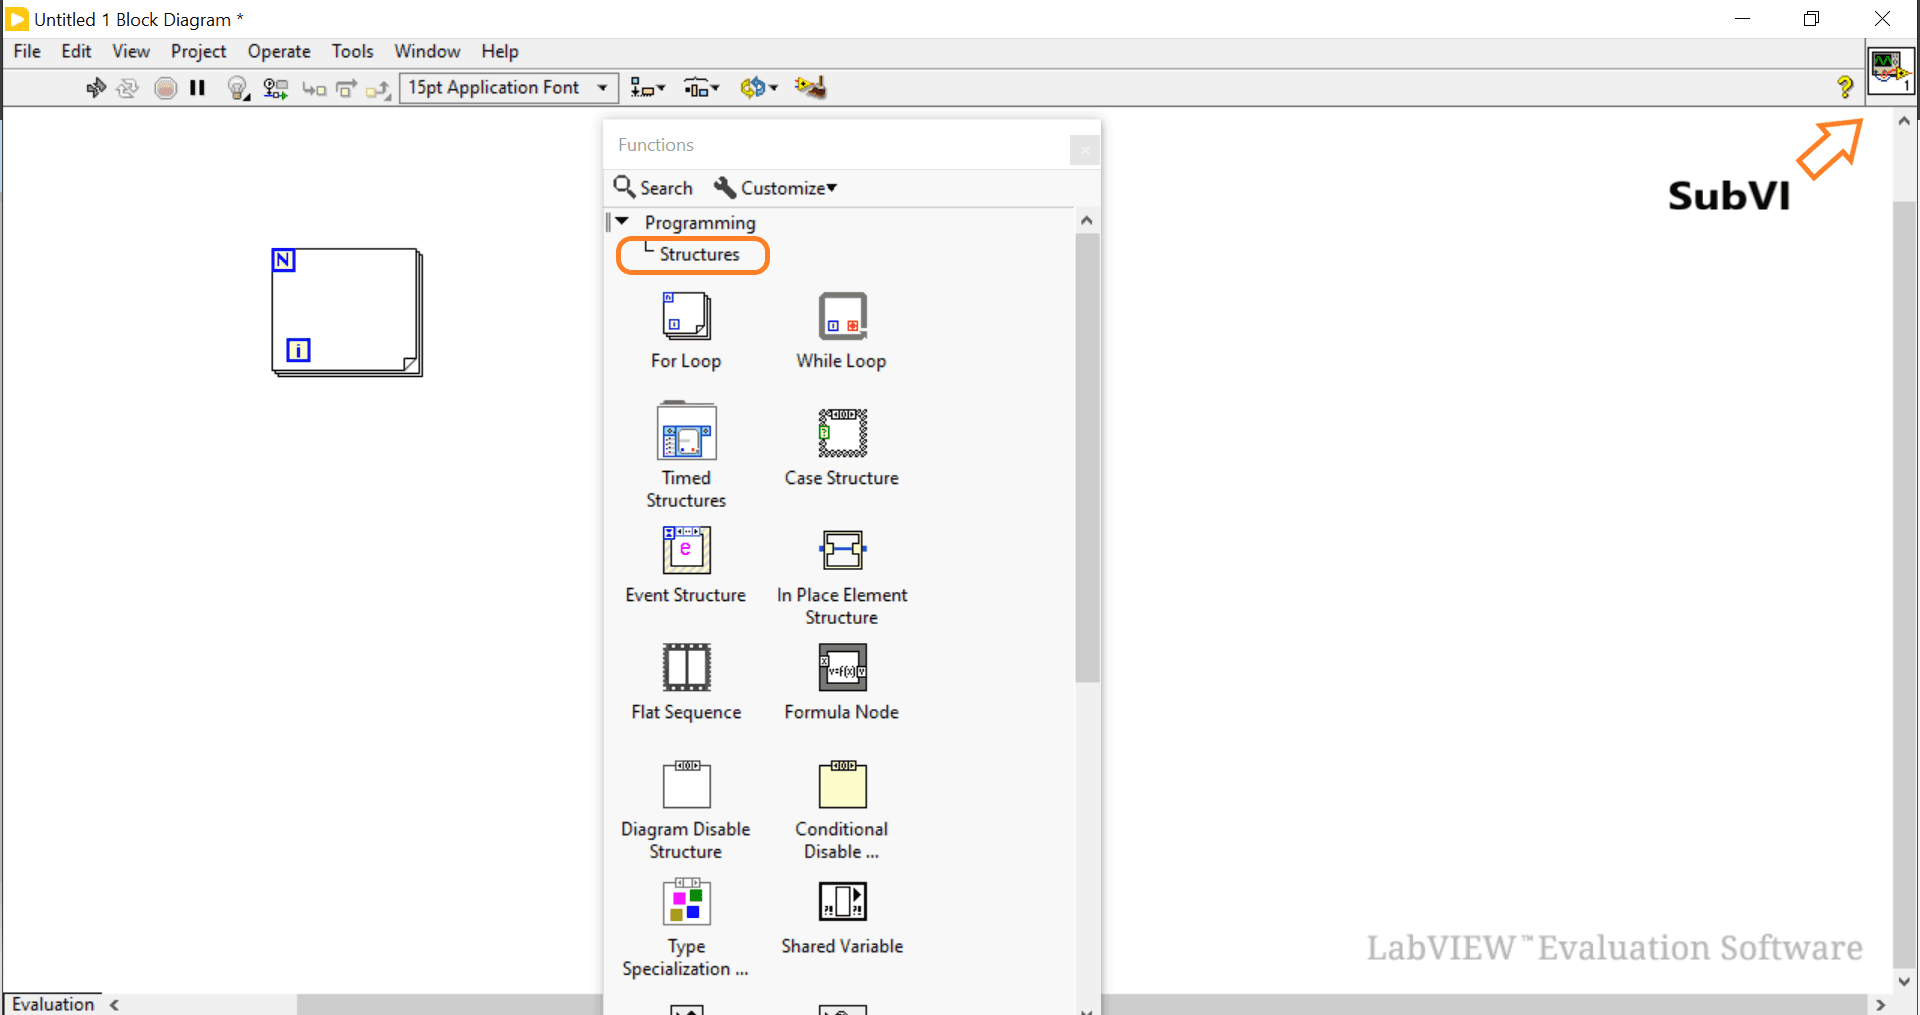
Structures in LabVIEW support organising programs, processing functions, and controlling program execution flow. Below are the typical structures used in a block diagram in LabVIEW.
- For loop – This loop executes a set of codes a specific number of times.
- While loop – This loop runs codes until the set condition is met. It is ideal for monitoring sensor data.
- Case structure – It executes codes based on an input value. It is similar to the if-else statement in conventional programming.
- Sequence Structure – This structure is ideal for applications that include sequential processing.
7. SubVIs
- A subVI is essentially a part of a VI. Sometimes, a VI is considered as SubVI.
- A SubVI is analogous to subroutines or functions used in text-based programming.
- SubVIs encourage code modularity and reuse. You can reuse a subVI in multiple parts of a program.
- You can even use a subVI in another VI.
- You can create a subVI by selecting a part of the block diagram.
- When you double-click a subVI on the block diagram, its front panel and block diagram will pop up.
- The upper-right corner of the front panel displays the icon for a VI. You can also find the icon in a block diagram. This icon will appear when you place the VI on a block diagram as a subVI.
8. Nodes
- Nodes are objects with inputs and/or outputs on a LabVIEW block diagram.
- They can be subVIs, functions, or structures.
- They are similar to statements, functions, operators, and subroutines that you use in text-based programming.
- The ‘Add’ and ‘Subtract’ functions are examples of nodes.
9. Express VIs
- Express VIs are nodes that use minimum wiring in block diagrams.
- They are interactive VIs with configurable dialog pages
- SubVIs also can be Express VIs. You can save the configuration of an Express VI as a subVI.
- You can use Express VIs for measurement tasks.
- LabVIEW uses coloured icons to distinguish between Express VIs, VIs, and functions on the block diagram.
- Icons for Express VIs have blue colour borders, whereas icons for VIs have white borders.
10. Error handling
LabVIEW includes error handling functions for errors such as invalid inputs, hardware failure, etc. These functions enable actions based on needs, such as halting the program or logging the error.
| For those preparing for a career in LabVIEW, it's essential to review common LabVIEW Interview Questions that can help you succeed in your job search. |
LabVIEW Block Diagram Example:
Consider a scenario where you must create a block diagram in LabVIEW to add two numbers.
Solution:
Here is the step-by-step procedure to create a VI that adds two numbers.
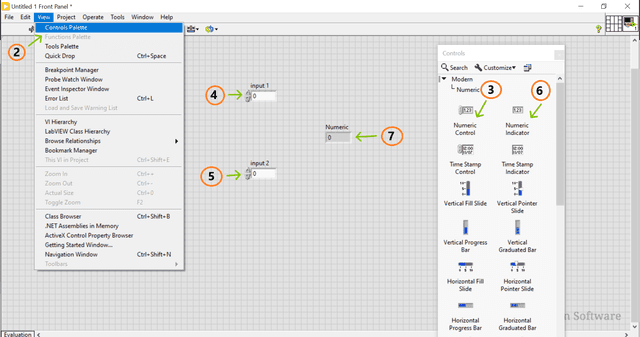
- Design the front panel
- Open a VI in LabVIEW
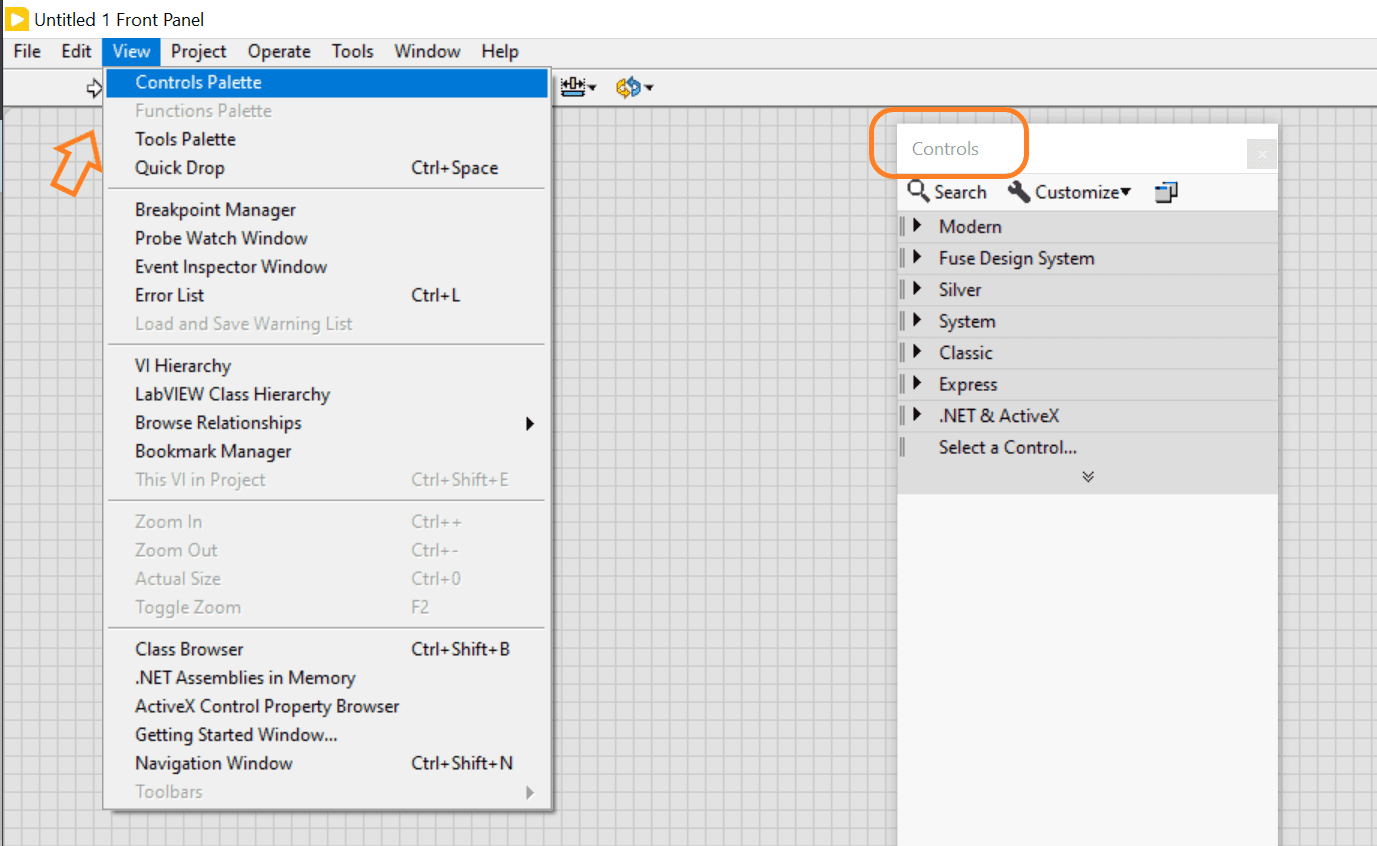
- Click View → Controls palette
- Navigate to the controls pane and select numeric controls
- Drag it into the front panel, where you can enter an input
- Drag one more numeric control in the front panel to enter another input
- Select a numeric indicator from the controls pane
- Drag it into the block diagram
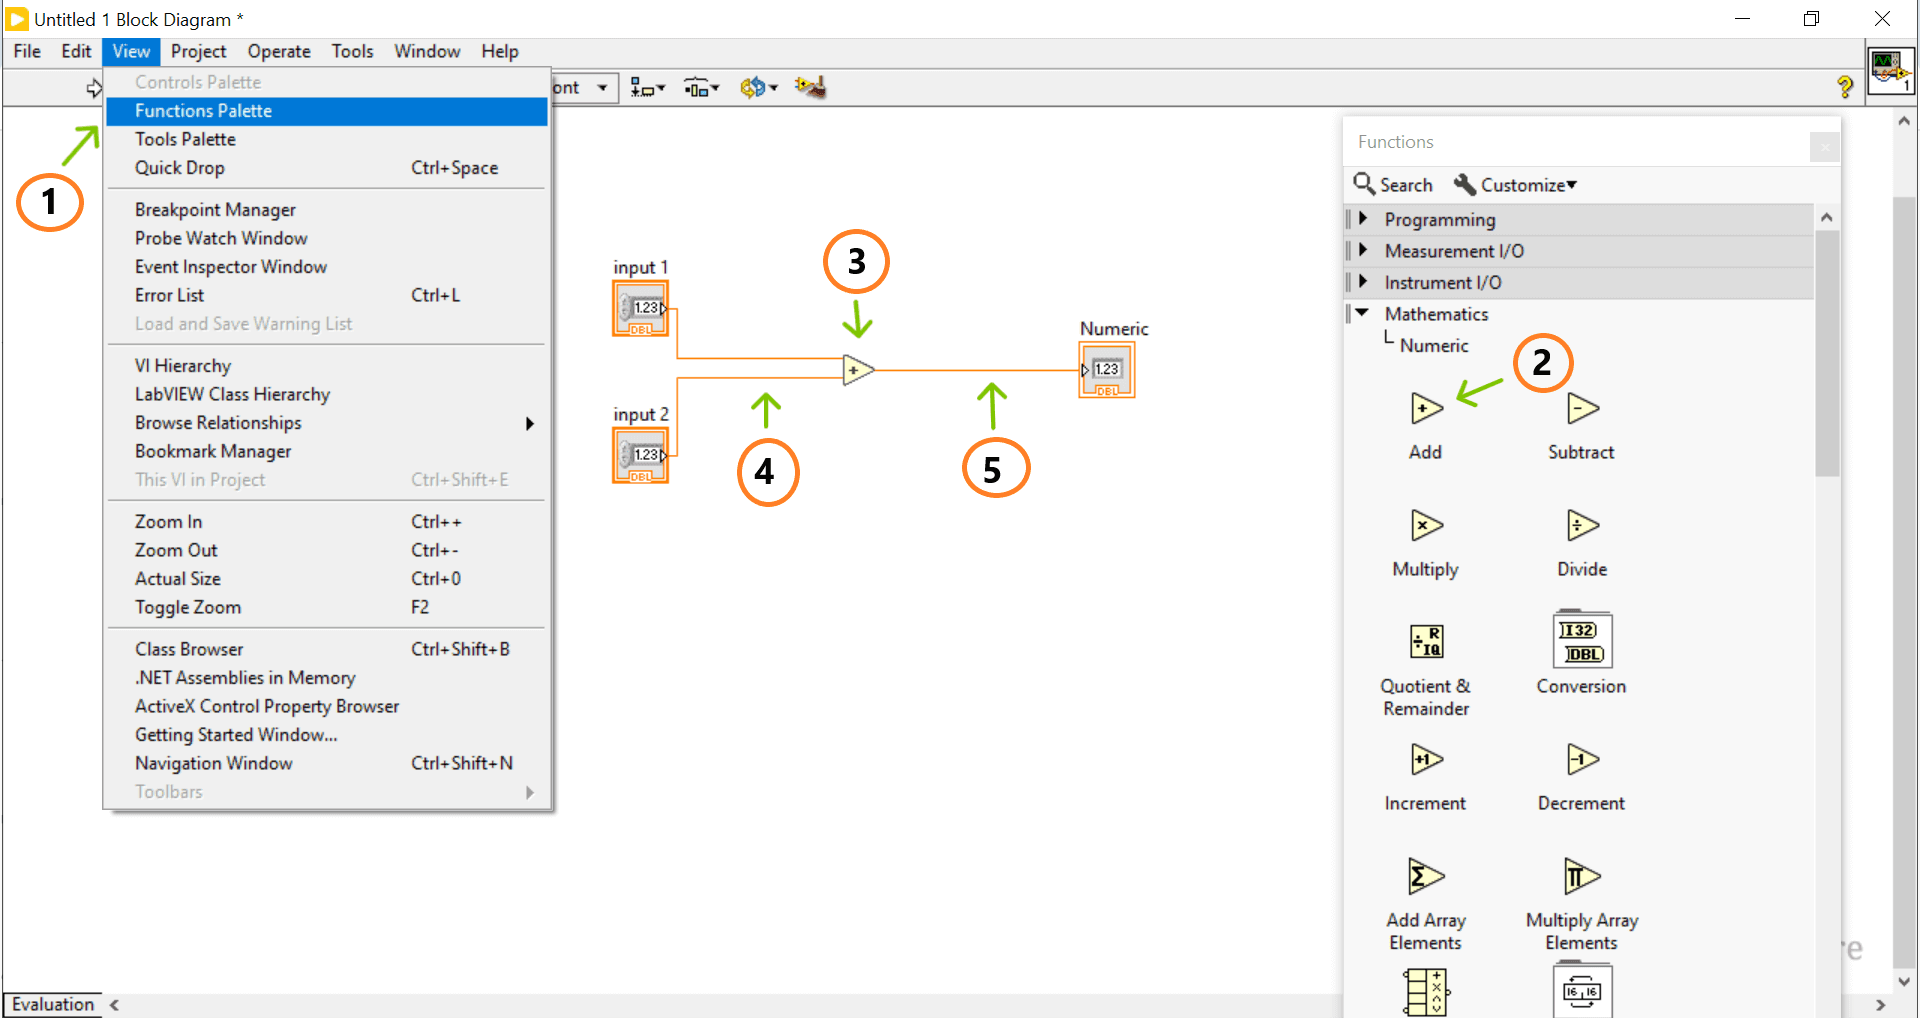
- Create the block diagram
- Go to View → Functions Palette
- Select Mathematics → Numeric → Add object
- Drag the ‘Add’ function into the block diagram
- Make wiring between Controls and Add function.
- Make wiring between the indicator and the add function.
- Run and Test the VI
- Run the VI
- View the output in the indicator in the front panel.
- Monitor the data flow and check for errors or unexpected results
- If there is any error, you can use debugging tools like highlight execution, probes, etc.
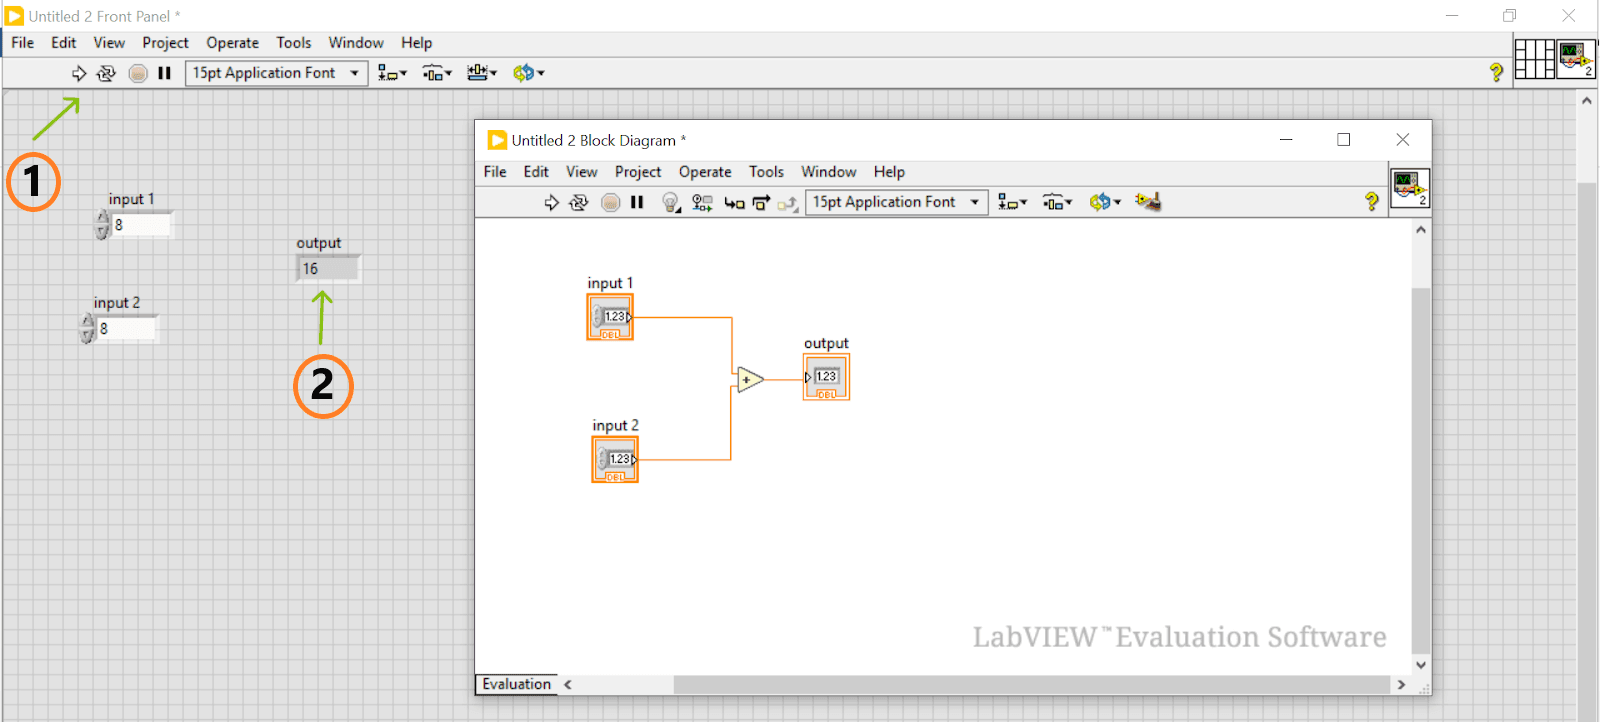
In this example, the input data flows from numeric controls to the add function, where the input data is processed. Then, the output data flows from the add function to the numeric indicator.
Using SubVIs in LabVIEW Block Diagrams:
This section explains creating, opening, editing, and placing subVI in a LabVIEW block diagram.
Let’s go ahead!
A. Creating a subVI
You can create a subVI in two ways.
- Creating a VI in LabVIEW block diagram and using it as a SubVI.
- Selecting a part of a mainVI as subVI.
B. Opening a subVI
You can open a subVI using two methods.
- Method-1: In this method, you can open a subVI saved in your file systems
- Navigate to the folder where you saved your subVI
- Double-click the subVI. Its front panel and block diagram will appear.
- Method -2: In this method, you can open a SubVI within a MainVI.
- You can right-click the SubVI icon that exists in the MainVI.
- Select ‘open’ to open the SubVI.
C. Editing a SubVI
You can edit a subVI in the following way.
- Open the SubVI
- Double-click the subVI on the block diagram.
- LabVIEW displays the subVI front panel.
- add or change controls, indicators and nodes in the subVI as you need to
- Add or change the functions in the block diagram
- Change the wiring connections in the block diagram if you want to modify the program logic
D. Saving SubVIs
- Before saving a subVI, ensure all controls, indicators and nodes are correctly connected.
- Then, select File → Save to save the SubVI. Alternatively, you can press Ctrl+S on your keyboard.
- Save the File in your desired folder with the .vi extension
- Provide meaningful names to your SubVIs. It helps users access and manage the SubVIs easily.
E. Placing a SubVI into a MainVI
Using the method below, you can place a subVI in a block diagram in LabVIEW.
Complete the below steps to place a subVI on the block diagram.
- Open the block diagram of the SubVI.
- Select the subVI icon located in the right-most corner of the block diagram.
- Place the icon in the MainVI
- Right-click the icon and modify the settings as you wish
- Use wires to connect the components of the MainVI with the subVI.
- Save the mainVI by pressing Ctrl +S or selecting File → Menu.
Well! The procedures mentioned above will help you open, edit, save, and place subVIs in a block diagram.
Related Article : LabVIEW Tutorial
LabVIEW Hardware Interface:
LabVIEW VIs can communicate with hardware devices using APIs, libraries, and drivers. These tools support connecting LabVIEW with hardware used in instrument control, data acquisition, and many more.
Let’s take a look at the interfacing tools in this section.
- NIDAQmx – It is NI’s software framework that supports connecting with DAQ hardware. It streamlines the Analog and digital signals used in data acquisition and processing.
- GPIB (General Purpose Interface Bus) – It is a hardware interface that helps connect older devices.
- VISA (Virtual Instrument Software Architecture) – It is a standard API that you can use to control instruments through USB or Ethernet.
- Instrument Drivers – These drivers help to control power supplies, oscilloscopes, and signal generators. NI’s library system has all these drivers. You can access them through the NI instrument driver network.
SubVI Debugging and Error Handling:
Let’s discuss the debugging and error handling practices you adopt to optimise subVI in a block diagram in LabVIEW.
- Debugging SubVIs
- The highlight execution method tracks the data flow in SubVI visually. Besides, using this method can ensure the subVI is working as expected.
- Breakpoints are used to examine variables at specific points in a subVI.
- Using probes to investigate the flow of data at specific points in a subVI
- Error Handling
- Managing errors efficiently by using error clusters, which are used to pass error information from one subVI to another.
- Using an error handler to manage errors in subVIs.
Advantages of LabVIEW Block Diagram:
Here is the list of the benefits of the LabVIEW block diagram.
- LabVIEW block diagram is a robust platform for developing graphical programs.
- Anyone without much expertise can easily understand the program logic from the block diagram.
- You can reuse subVIs so complex programs can be built quickly.
- You can visualise data flow and errors in wires.
Super! You have walked through the key aspects of block diagrams in LabVIEW under various topics. We will summarise them in the following section.
Summary:
- A block diagram is where you will graphically construct the logic and flow of programs.
- Nodes, terminals, wires, and structures are the different components of the LabVIEW block diagram.
- Nodes are a program's functional elements. They include data manipulation, mathematical computations, signal processing, and more.
- Terminals are the input and output points of LabVIEW nodes. They allow you to connect with other nodes or front-panel objects.
- Wires connect nodes. The colour and size of wires vary depending on the data type.
- Structures control the flow of execution in LabVIEW programs.
Frequently Asked Questions
1. What is a LabVIEW block diagram?
Ans:
- It is a graphical source code for LabVIEW programs
- It shows the program logic and flow of program execution
- It consists of nodes and wires to visually represent the program logic
2. How long does it take to learn LabVIEW?
Ans: MindMajix offers 30 hours of LabVIEW training with highly skilled trainers. We offer training in two modes: instructor-led live online training and self-paced on-demand videos. The live online training takes two weeks, while the self-paced training can be completed at your own pace.
3. What are the common mistakes that may occur while creating LabVIEW diagrams?
Ans:
- Data type Mismatches – You must ensure that wires connect compatible data types.
- Memory Leaks – poor memory management will trigger performance issues.
- Unwired Terminals – All the terminals must be wired; otherwise, they will lead to unexpected behaviour
4. Can you describe the error handling procedure in the LabVIEW block diagram?
Ans:
- First off, start the VI
- Check for errors in the VI
- If there is no error, continue processing the VI
- If there is any error, pass the error cluster using an error handler
- Clear the error cluster once the errors are handled
- Exit the VI.
Conclusion:
It’s a wrap! You can create block diagrams for various applications using nodes, wires, controls, and indicators, from simple mathematical calculations to complex data acquisition and control systems.
Well! You might have gained a comprehensive knowledge of block diagrams in LabVIEW. If you want to learn the LabVIEW block diagram in-depth and work on real-time examples, you can reach out to MindMajix. We offer skill-based LabVIEW training for beginners and experienced with an extensive course curriculum.
Upon completing the training, you will acquire the in-demand skills required for a competent LabVIEW professional and be ready to apply for multiple job roles.
| Explore - LabVIEW Sample Resumes! Download & Edit, Get Noticed by Top Employers!. |
 On-Job Support Service
Online Work Support for your on-job roles.

Our work-support plans provide precise options as per your project tasks. Whether you are a newbie or an experienced professional seeking assistance in completing project tasks, we are here with the following plans to meet your custom needs:
- Pay Per Hour
- Pay Per Week
- Monthly
| Name | Dates | |
|---|---|---|
| LabVIEW Training | Feb 24 to Mar 11 | View Details |
| LabVIEW Training | Feb 28 to Mar 15 | View Details |
| LabVIEW Training | Mar 03 to Mar 18 | View Details |
| LabVIEW Training | Mar 07 to Mar 22 | View Details |

I am Ruchitha, working as a content writer for MindMajix technologies. My writings focus on the latest technical software, tutorials, and innovations. I am also into research about AI and Neuromarketing. I am a media post-graduate from BCU – Birmingham, UK. Before, my writings focused on business articles on digital marketing and social media. You can connect with me on LinkedIn.


