
- Dataflow Programming and Data Types in LabVIEW
- LabVIEW Interview Questions
- LabVIEW Programming
- LabVIEW Tutorial
- Block Diagram in LabVIEW
- LabVIEW Graphs and Charts
- Initializing Arrays In Labview
- Introduction of Repetition And Loops in LabVIEW
- Local and Global Variables in LabVIEW Tutorial
- Overview Of Clusters In Labview
- Shift Registers in LabVIEW
- Labview Structures
- LabVIEW Projects and Use Cases
- How to install LabVIEW on Windows
- LabVIEW VI and Modular Programming
Graphical System Design
Introduction
The term “scientific computing,” or “computational science”, has been used for many years to define the use of computers (software and hardware) for solving problems related to science and engineering, usually involving experimental or applied research, modeling, and simulation. In a simplistic definition, it refers to the use of computers in solving scientific problems. Scientific computing applications usually follow a three-step process: data acquisition, data analysis and data visualization/presentation.
If you would like to Enrich your career with an Android certified professional, then visit Mindmajix - A Global online training platform: “LabVIEW training” Course.This course will help you to achieve excellence in this domain.
This three-step approach has been one of the pillars of the NI (National Instruments) virtual instrumentation model as shown in Figure 1.1 since its original conceptualization in the early 1980s and has been expanded into a more comprehensive model known as graphical system design shown in Figure 1.2. In this new model, the focus is to accelerate the research and development cycle, delivering mathematical models to embedded real-time computers faster and easier. This design-flow acceleration is achieved by using NI LabVIEW software and its G programming language as a common system-level design tool for all the different phases in the design-to-deployment flow.

Figure: Virtual instrumentation model.

Figure: Graphical system design model.

Graphical System Design (GSD) Model
In reality, the virtual instrumentation model is applied in each of the three phases of the graphical system design model as shown in Figure 1.3, because data acquisition, analysis and presentation functions are used in the design, prototyping and deployment phases.
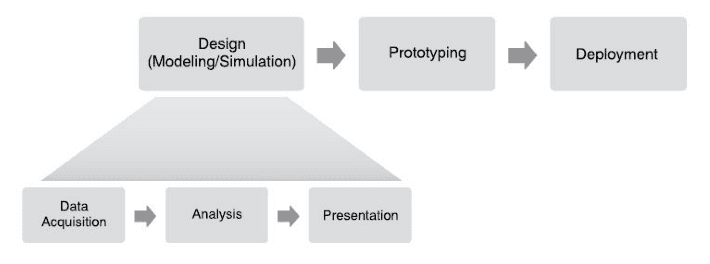 Figure: Graphical system design and virtual instrumentation.
Design (Model)
In the design phase as shown in Figure 1.4, the researcher develops a mathematical model of the system, including sensors, actuators, plants and controllers, and simulates them under a variety of initial conditions and constraints. The researcher uses different numerical methods with the objective of validating the performance of the model and optimizing it.
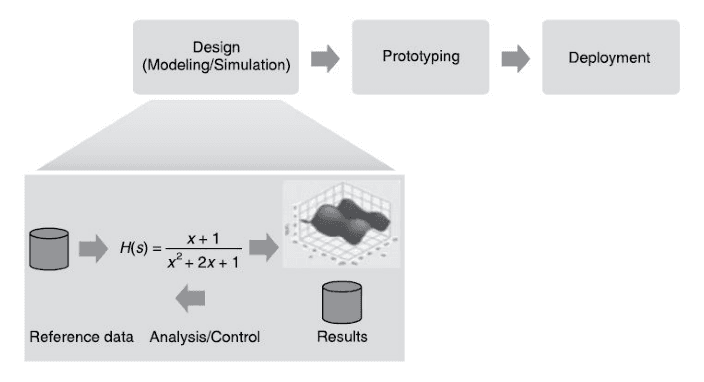 Figure: The design phase of the graphical system design model.
In this phase, researchers can acquire reference data from files or databases and incorporate it into the model. A “virtual plant/process” is created, which can be used later for hardware-in-the-loop (HIL) tests. Results from the simulation process are saved for post-analysis and visualization and can be used to introduce changes into the model. This is usually a software-centric process with a strong focus on numerical methods/analysis and mathematics. However, for complex or computationally intensive models, high-performance computing (HPC) using grid computers, standard computers with graphical processing units (GPUs), and multicore based computers is a key factor. In those cases, the hardware has an important impact on the performance of the model solution and simulation. Multicore-ready software tools are scarce, but LabVIEW is multicore-aware. It provides the user with a powerful yet easy-to-use programming language that can take advantage of multicore processors and parallel programming.
Prototype (Lab)
If experimental validation of the model is required, researchers develop and test a prototype in the laboratory. Signal processing and analysis, as well as visualization, can be implemented online while data is being measured and acquired, or while the process is being controlled. The “virtual plant/process” defined in the previous phase can be used for HIL tests. The experimental results obtained in this phase can be used to modify and optimize the original model, which in turn may require additional experiments. Data captured can also be used for system identification and parameter estimation. Usually, this experimental (prototyping) phase is executed on standard PCs or PXI computers, using PCI/PXI data acquisition devices or external measuring devices connected to a PC via USB, Ethernet, GPIB, or serial ports.
Frequently Asked LabVIEW Interview Questions & Answers
This process as shown in Figure 1.5 is usually more software/hardware-centric because sensors, actuators, data acquisition devices, controllers, and the controlled/analyzed plant itself are all key
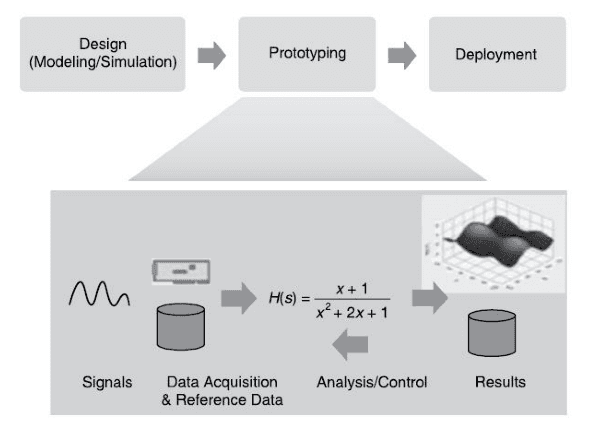
Figure: The prototyping phase of the graphical system design model.
elements in the experimental setup. Real-time operating systems (RTOSs) can be used when deterministic performance or higher reliability is required. Also, multicore-based computers can be used when higher computational performance is needed. Field-programmable gate arrays (FPGAs), digital signal processors (DSPs), and GPU processors can be used with the multicore main CPU, allowing LabVIEW to execute critical computations in specialized processors. For example, sets of 2D or 3D differential equations can be solved in real time, or large sets of matrices can be processed at high speed and in real time using parallel programming in multicore computers while sharing part of the signal processing load with an FPGA or a GPU. Data is shared between the multicore processors and an FPGA via DMA first-in-first-out memory buffers (FIFOs). Finally, technical data mining algorithms can be implemented by combining LabVIEW with NI DIAdem, an excellent tool for managing, analyzing, and reporting technical data collected during data acquisition and/or generated during the modelling, simulation or analysis phases.
Deployment (Field)
Finally, the model (controller, analyzer or both) is deployed in the field or lab using either a PC (desktop, server or industrial) or PXI, or it can be downloaded to a dedicated embedded controller such as CompactRIO, which usually operates in stand-alone mode and in real-time (deterministic) mode as shown in Figure 1.6. When using the LabVIEW Real-Time Module, symmetric multiprocessing (SMP) techniques can be easily applied. For large systems, with high-channel counts or involving modular instruments such as scopes, digital multimeters (DMMs), RF vector signal analyzers, and dynamic signal acquisition (DSA) devices, the PXI platform is more appropriate. The transition from the prototyping phase to the deployment phase can be very fast and efficient because the same set of tools used for prototyping can, in most cases, be applied to the final deployment of the system in the field.
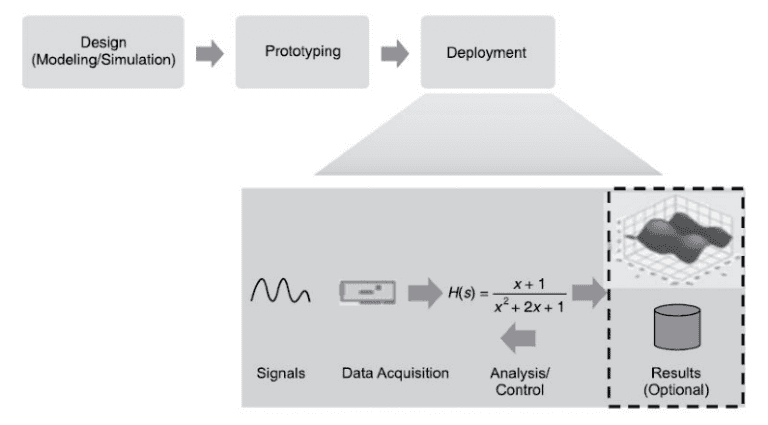 Figure: The deployment phase of the graphical system design model.
In many cases, the system is deployed as a headless system (no monitors or interfaces to the user), executing the analysis/control algorithms in real time as a dedicated device. If on-the-field graphical user interfaces (GUIs) or operator interfaces (OIs) are needed, the LabVIEW Touch-Panel Module and industrial-grade monitors with touch-sensitive screens can be used locally. Remotely, data can be shared and visualized via Ethernet with applications developed using LabVIEW and the LabVIEW Datalogging and Supervisory Control Module running on one or more PCs distributed in a network.
Design Flow With GSD
Typical embedded system software and hardware design flows is shown in Figure 1.7.

Figure: Typical embedded system software and hardware design flow.
If you are creating custom hardware for final deployment, it is difficult to have the software and hardware developed in parallel as the software is never tested on representative hardware until the process reaches the system integration step. Additionally, you do not want the software development to be purely theoretical, because waiting until the system integration test to include I/O and test the design with real signals may mean that you discover problems too late to meet design deadlines. Most designers currently use a solution like an evaluation board to prototype their systems. However, these boards often only include a few analogs and digital I/O channels and rarely include vision, motion, or ability to synchronize I/O. Additionally, designers often have to waste time developing custom boards for sensors or specialized I/O, just to complete a proof of concept.
Using flexible Commercial-off-the-shelf (COTS) prototyping platforms instead can truly streamline this process, as shown in Figure 1.8, and eliminates much of the work required for hardware verification and board design. Much like PCs today, in which case anyone can go to an
 Figure: Stream-lined development flow with graphical system design.
electronics store and plug components such as memory, motherboards and peripheral together to create a PC, graphical system design strives to achieve the same standardization for prototyping platforms. The time has come for a new approach to electronic system design.
For most systems, a prototyping platform must incorporate the same components of the final deployed system. These components are often a real-time processor for executing algorithms deterministically, programmable digital logic for high-speed processing or interfacing the real-time processor to other components, and varied types of I/O and peripherals as shown in Figure 1.9. Finally, as with any system, if the off-the-shelf I/O doesn’t serve all of your needs, the platform should also be extensible and customizable when needed.

 On-Job Support Service
Online Work Support for your on-job roles.

Our work-support plans provide precise options as per your project tasks. Whether you are a newbie or an experienced professional seeking assistance in completing project tasks, we are here with the following plans to meet your custom needs:
- Pay Per Hour
- Pay Per Week
- Monthly
| Name | Dates | |
|---|---|---|
| LabVIEW Training | Jul 21 to Aug 05 | View Details |
| LabVIEW Training | Jul 25 to Aug 09 | View Details |
| LabVIEW Training | Jul 28 to Aug 12 | View Details |
| LabVIEW Training | Aug 01 to Aug 16 | View Details |

I am Ruchitha, working as a content writer for MindMajix technologies. My writings focus on the latest technical software, tutorials, and innovations. I am also into research about AI and Neuromarketing. I am a media post-graduate from BCU – Birmingham, UK. Before, my writings focused on business articles on digital marketing and social media. You can connect with me on LinkedIn.


