- Home
- Blog
- ServiceNow
- ServiceNow Reporting

- ServiceNow Interview Questions and Answers
- What is ServiceNow Ticketing Tool
- ServiceNow Tutorial
- Top 10 IT Management Tools
- What is Servicenow Workflow
- ServiceNow Admin Interview Questions and Answers
- What is ServiceNow - A Complete Guide for Beginners
- What is ServiceNow GRC
- ServiceNow Data Model
- What is ServiceNow Orchestration
- What is ServiceNow ITIL - A Complete Overview
- ServiceNow vs Jira Service Management
- ServiceNow Architecture
- SLA ServiceNow
- ServiceNow Webassessor
- ServiceNow Integration With Jira
- ServiceNow Scripting Interview Questions
ServiceNow Reporting is meant to empower you to create and disseminate reports that display the current status of instance information. Reporting execution is quite accessible as a matter of course for all of the tables apart from the framework tables. Moreover, ServiceNow reports are the display of your information that you could provide to clients on administration portals and the dashboards. In this post, let’s find out more about how to create ServiceNow reporting along with its other aspects.
Create a Report in ServiceNow
To create a report in ServiceNow, follow the below-mentioned steps:
- Go to Reports
- Click Create New
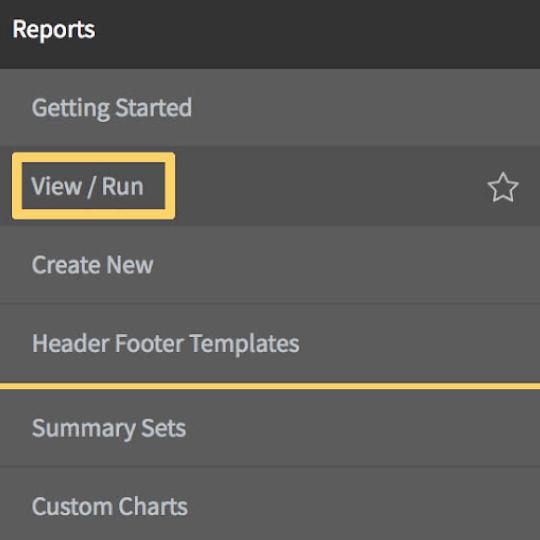
- Visit Reports
- Click View / Run and choose to Create a Report option
- From the displayed list, click on the down arrow available next to any column header
- Choose the type of report you wish to create, whether bar chart or pie chart
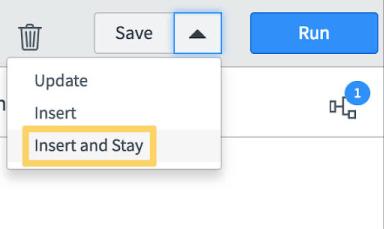
- From an existing report, click the down arrow available next to the Save option and choose Insert and Stay
This is the same as the Save As feature that helps you insert a copy of the report into the database without any alterations that would have been made. Also, keep in mind that if you don’t save an existing report before inserting it, any changes and alterations will only be saved to the new copy of that report and not the existing one.
In addition to this, it is also recommended to name your reports descriptively so as to communicate the data clearly that is being showcased.
Using the List Report Type Features
A-List Report Type lets you select the columns that will be displayed in the report. If, after a field name, you see a plus sign (+) on the list of fields, this means that there are more fields in the relevant table that you can try including in your report. To do so, you can:
- Choose the field
- Click + option between the Available and Selected Field lists
And then, the available fields list will include the fields from the relevant table. If you wish to hide the related field list, you can:
- Click the fields list item available above the related field list

Viewing an Existing Report
If you wish to view an existing report, follow the below-mentioned steps:
- Open the Application Navigator menu
- Under Reports, click on View / Run
A list of all the available reports in ServiceNow will be displayed based on your access privileges.
- To run a report, click on its link
- A report could be a pivot table, list, graph, or a specific type
- You can make changes to a global report and save its customized copy for either yourself or the entire group, based on your role
Copy and Modify an Existing Report
If you wish to copy and modify an existing report, follow these steps:
- In the Application Navigator menu, under Reports, click View / Run
A list of all the available reports in ServiceNow will be displayed based on your access privileges.
- Choose a report that you wish to copy and click on its link
- Click on the down arrow available on the right of the Save option and choose Insert and Stay
Now, a copy of this report will open with options to modify on the top of the page.
Now, you can modify and alter the report according to your requirements. Once done, you can then rename that report and click Save.
| Preparing for ServiceNow Interview? Here’s ServiceNow Interview Questions and Answers |
Exporting and Downloading Reports
As long as you have enough criteria to split bar charts or pie charts into pie slices, you can save them as .png or .jpg files. You can export list reports into Microsoft excel .xlsx, PDF and .csv files. To do so, follow these steps:
- Run a report
- Export the data from the report
If you want a bar/pie chart, you can:
- Click the Chart context menu option available above and towards the right of the chart.
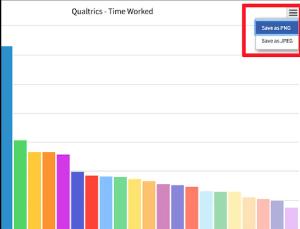
- Choose the preferable image type
If you wish to export in the form of a list or a table, you can:
- Click the three-line menu option that is available next to a column of the report
- Click Export
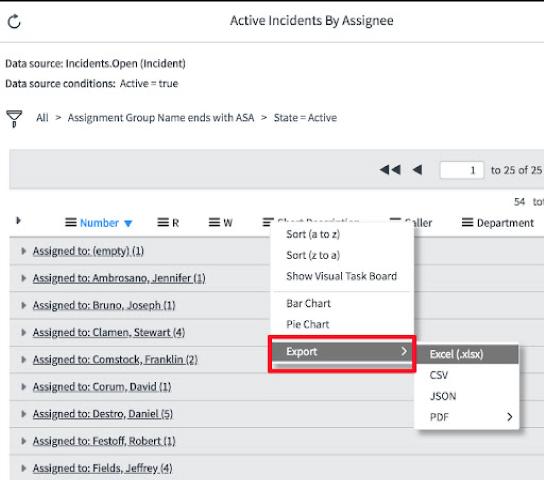
You don’t have to choose a specific column in the list report as all of them will be exported.
- Now, you can choose the preferable report type
- Click Download once the data export has finished downloading the file
Bar/Pie Charts
In terms of bars and pie charts, you can display information in a variety of ways, such as:
- Bar Chart
- Histogram Chart
- Horizontal Bar Chart
- Pareto Chart
- Donut Chart
- Pie Chart
- Semi Donut Chart
List/Table
Some of the most common list/table options available in ServiceNow Reporting are:
- Change Request (change_request)
- Task (task)
- Enhancement (rm_enhancement)
- Requested Item (sc_req_item)
- Incident (incident)
- Request (sc_request)
- Project (pm_project)
Some of the others include:
- Catalog Task (sc_task)
- Time Worked (task_time_worked)
- Change Task (change_task)
- Private Task (vtb_task)
- Knowledge (kb_knowledge)
- Problem (problem)
- Expense Line (fm_expense_line)
- Release Task (rm_task)
- Contract (ast_contract)
- Asset (alm_asset)
- Configuration Item (cmdb_ci)
Conclusion
Almost every other business, these days, depends upon correct data to help individuals settle on better choices. However, unbendable reporting capabilities and decentralized information can make this process more difficult. With ServiceNow Reporting, you can consolidate the intensity of its establishment with a single information model to create and spread data to clients, whenever they would want it.
 On-Job Support Service
Online Work Support for your on-job roles.

Our work-support plans provide precise options as per your project tasks. Whether you are a newbie or an experienced professional seeking assistance in completing project tasks, we are here with the following plans to meet your custom needs:
- Pay Per Hour
- Pay Per Week
- Monthly

Madhuri is a Senior Content Creator at MindMajix. She has written about a range of different topics on various technologies, which include, Splunk, Tensorflow, Selenium, and CEH. She spends most of her time researching on technology, and startups. Connect with her via LinkedIn and Twitter .