
- SSRS Interview Questions
- SSRS Tutorial
- Adding Charts to a SSRS Report (Report Builder)
- Adding Totals and Subtotals to Reporting Services Reports - SSRS
- Data Sources and Data Sets in Reporting Services - SSRS
- Different Parts of Creating Drill Down Reports in SSRS
- How to Format a Table Report In SSRS
- Getting Started with Sparklines in SQL Server Reporting Services
- SSRS Grouping data for multi-level reports
- How To Create A Report Dataset Reporting Services - SSRS
- SSRS – How to Create a Report With a Shared Data Source
- SSRS - How to Create Dynamic Reports using Parameters
- How to Deploy SSRS Report in Server
- Reporting Services Number Formatting Expressions In SSRS
- Installing SQL Server Data Tools for SQL Server 2012
- SQL Server Reporting Services SSRS Indicators
- What is SSRS?
- Matrix Reports in SSRS
- How to Install SSRS on Windows
Types of SSRS Reports
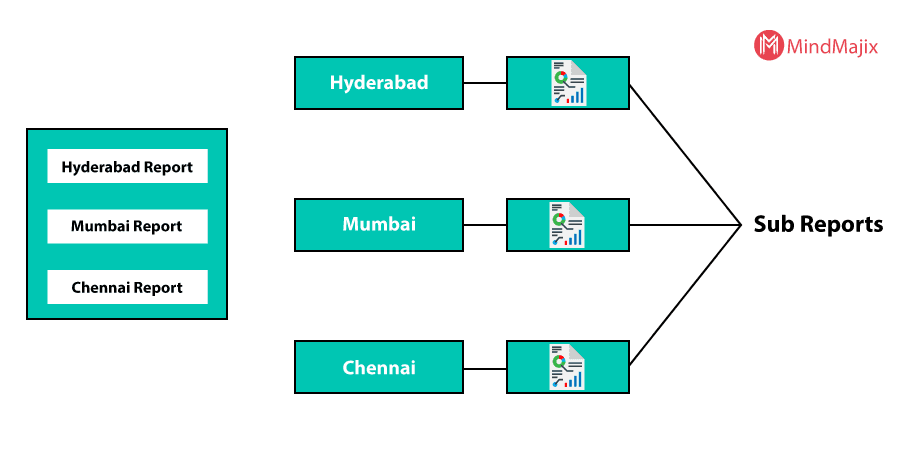
Taking Sub Reports
- Sub Report displays the content in the main report or is the report in the main report.
- It can take parameters.
- Generally, subreports are taken in real-time to display particular information for every row (or) set of rows in the main report
Eg:- Display every branch and its report in the main report.
If you want to become a SSRS certified professional, then visit Mindmajix - A Global online training platform: “SSRS Certification Course”. This course will help you to achieve excellence in this domain.
Main Report
- Create a report (report2) and take a parameter to the report
- Take a new column in the main Report and Drag and Drop sub-report from the toolbox to the column and specify the below subreport properties:
General:
Name Location _ SUB_Reprt
Use this report as subreport: party2
Visibility: Select SHOW
Parameters: Click ADD
Name Value
VARLOC [PARTYLOC]
Border: Style: Solid
Width : 2pt
Working with Chart Report
To display the data in a more analytical way chart reports are useful.
These display data in the required chart type the chart report contains 3 sections.
a) Data Section → Have actual data presented
b) Category sections → here group-wise in-formation displayed
c) Series section → It displays the information related to the series of data presented in the report.
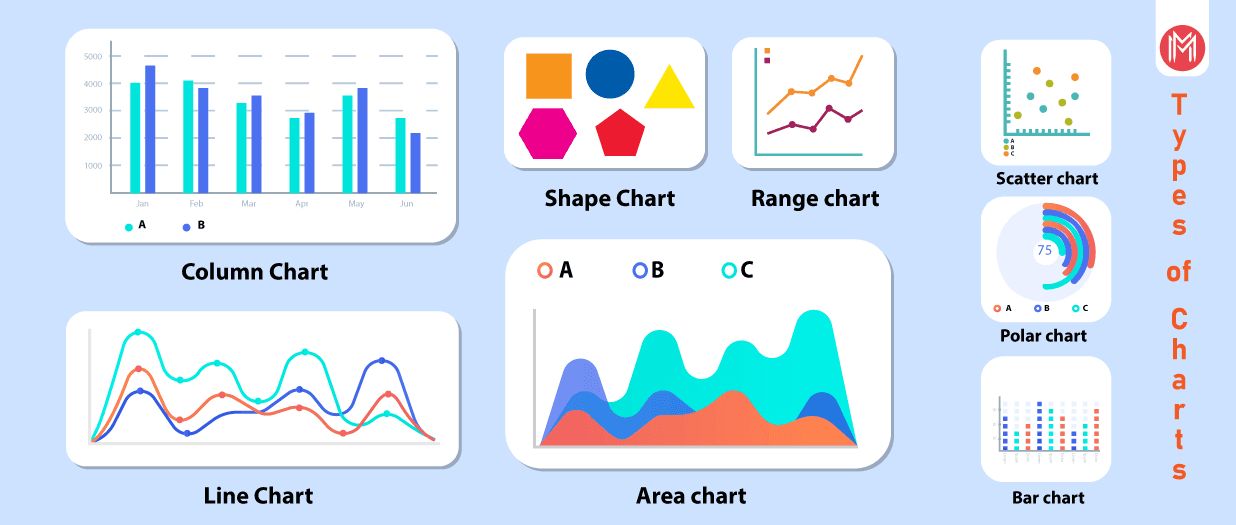
Types of Charts:
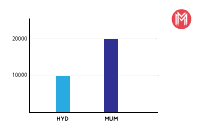
1) Display locations and their total incomes
Sol:- Take income on data section and location in the category section
2) Display party code wise income in a very location
Sol:- Take income on data section and location in category section & code in the series section
Frequently Asked SSRS Interview Questions & Answers
Changing Chart Type:
Chart → rt click → shape → select shape.
Taking Labels on chart:
On the chart → rt click-click show data labels
1) Chart properties
- General
- Visibility
- Filter
- Fill
- Border
2) Chart Area properties
→ 3D options, visibility, fill, border, shadow
3) Series properties
→ Series Data:
Value field:
[Sum [Party Income]]
-
Visibility, Axes & chart Area, Fill …..etc.Series properties

4) Legend properties
- General:
Name: Location –Code
Layout: auto table
→ Visibility, font, fill, Border, shadow ……..etc
Note:- Chart report takes parameters and it supports action implementation.
→ For changing the default dataset values go to series properties and change the value field
---- Related Page: SSRS – How To Create Dynamic Reports Using Parameters ----
Matrix Reports:
This is useful to display cross tab reports. Generally, it displays data in the form of matrix-like rows against columns. It contains 3 sections.
-
Row Section → Row wise information displays.
-
Column section → It displays column-wise information
-
Data section → It many have summarized (or) aggregated (or) Normal data against row and column section. It also supports parameters, actions, etc..
→ Take (drag & Drop) Matrix on the layout
→ Take location in the row section, code in column section, Income in the data section
LOC*Code Party code
Party Loc [sum[prtyinc]]
→ To change color, font ..etc press F4 (or) go to generic method & change it

-
we can add groups in the row-wise (or) column-wise report → rt click → Insert row
-
The matrix report supports tablix properties.
-
Taking subtotal within the matrix report
a) Go to row section → rt click-click insert row → Outside group below
b) Go to column section → rt Click → click insert row → outside group right.
---- For more info: Matrix Reports in SSRS ----
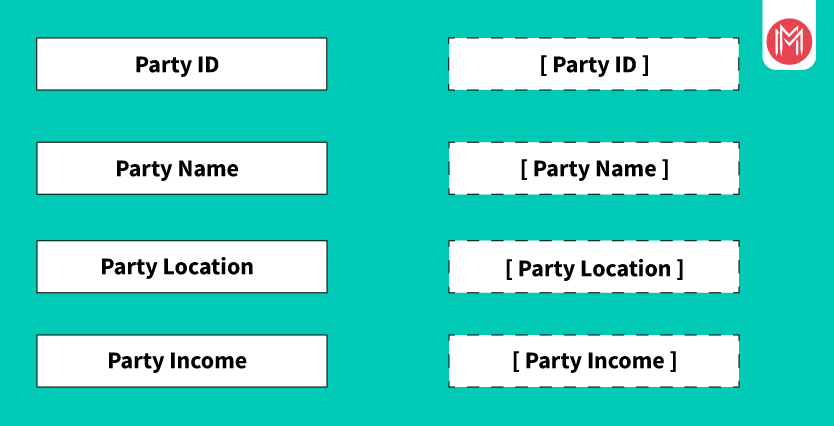
List Report:
It displays a list of contents
-
It uses tablix properties
-
This is used to display columnar reports (or) table reports
List box properties are rectangle properties
- Drag and drop text boxes and design like below
To change the font, color … etc go to properties (or) press F4
-
Take a line from the toolbox of report items and take before (or) after (or) where ever you require in the list report.
-
Displaying each row content in separate Go to rectangle properties à Generalà Name: Rectangle 1
-
Page break options à select 1st & b2nd options.
---- Related Page: Different Parts Of Creating Drill Down Reports In SSRS ----
Rectangle properties:- Change name and page break option
General → Name: [Rectangle 1]
Page break Options:
Add a page break before
Add a page break after
[] Omit border o the page break
-
Visibility
-
Fill
-
Border
Guage Report
Newly added in 2008.
→ It displays information like industrial meters, bike speedometers
→ 2 types of gauges
1. Radial Guage

2. Linear Guage

-
Take a guage in one of the columns in the existing report
-
Specify a radial pointer (or) linear pointer as party code
-
To change the pointer values (or) work with pointers go to properties
Pointer Options:
Value: = fields! Party code. Value
Expression: =Fields! Party code.value
Pointer type: Needle
Needle
Marker
Bar
Needle style:
Tapered
Tapered with style
Placement and size options:
Placement (relative to scale) distance
Inside 0
Width
15
-
Action
-
pointer fill
-
pointer border.
-
cap options
-
cap fill
-
shadow → click ok
Guage panel properties:
a) General
Name:
Tooltip: MSBI Guage
Data set Name:
DB_MSBI
Page break options:
b) Visibility
c) Filter
d) Fill
e)Borders

Scale Properties:

List of Related Microsoft Certification Courses:
| SSIS | Power BI |
| SSAS | SQL Server |
| SCCM | SQL Server DBA |
| SharePoint | BizTalk Server |
| Team Foundation Server | BizTalk Server Administrator |
 On-Job Support Service
Online Work Support for your on-job roles.

Our work-support plans provide precise options as per your project tasks. Whether you are a newbie or an experienced professional seeking assistance in completing project tasks, we are here with the following plans to meet your custom needs:
- Pay Per Hour
- Pay Per Week
- Monthly
| Name | Dates | |
|---|---|---|
| SSRS Training | Jul 21 to Aug 05 | View Details |
| SSRS Training | Jul 25 to Aug 09 | View Details |
| SSRS Training | Jul 28 to Aug 12 | View Details |
| SSRS Training | Aug 01 to Aug 16 | View Details |

Ravindra Savaram is a Technical Lead at Mindmajix.com. His passion lies in writing articles on the most popular IT platforms including Machine learning, DevOps, Data Science, Artificial Intelligence, RPA, Deep Learning, and so on. You can stay up to date on all these technologies by following him on LinkedIn and Twitter.


