- Home
- Blog
- Kubernetes
- Fluentd Kubernetes

- Kubernetes Architecture
- Kubernetes Deployment Vs Kubernetes Services
- Kubernetes Ingress
- Kubernetes Interview Questions
- Kubernetes Load Balancer Services
- Kubernetes Tutorial
- Kubernetes Vs Docker swarm
- Kubernetes Vs Openshift
- Kubernetes Overview
- Detailed Study On Kubernetes Dashboard
- What is Kubernetes?
- Cloud Deployment Models
- Kubernetes Tools
- Kubernetes Projects and Use Cases
- How To Install Kubernetes on Ubuntu?
- Installing Kubeadm
- Kubernetes Secrets
- Kubernetes Storage Class
- Kubernetes Deployment YAML
- Install Kubernetes on Windows
- Kubernetes VS Openstack
- Kubectl Connect to Cluster
- Kubernetes Vs Terraform
- ECS Vs Kubernetes
- Kubernetes Pod Vs Node
Kubernetes is currently the industry’s de-facto standard for container orchestration. It provides the essential abstraction for efficiently managing large-scale containerized applications with declarative configurations, a deployment procedure, scaling, and self-healing features.
The Kubernetes ecosystem has grown thanks to additional integrations created by the community, such as logging and monitoring. Kubernetes' logging mechanism is an essential tool for managing and monitoring infrastructure and services. The ability to monitor faults and even fine-tune the performance of the containers that host the apps makes logs useful in Kubernetes. Fluentd, a logging agent, handles log collecting, parsing, and distribution in the background.
Fluentd Kubernetes - Table of Content
What is Kubernetes?
The open-source Kubernetes container orchestration engine automates the setup, expansion, and management of containerized applications. The organisation behind the open-source project is the Cloud Native Computing Foundation.
Before getting started, it’s better to have a basic understanding of the following Kubernetes concepts:
- Node
A Node is a worker machine in Kubernetes, and depending on the cluster, it may be virtual or physical. Each Node is under the control of the control plane. A Node may host several pods, and the Kubernetes control plane automatically distributes the pods throughout the Nodes in the cluster.
Every Kubernetes Node has the following running at all times:- The Kubelet process, which manages the pods and containers running on a system, enables the communication between the Kubernetes control plane and the Node.
- A runtime for containers, such as Docker, that is in charge of obtaining the container image from a registry, unpacking the container, and launching the application.
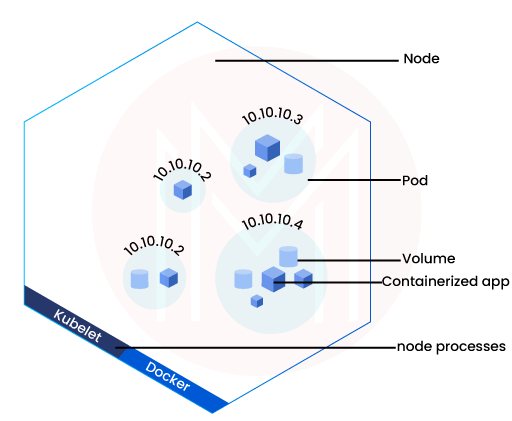
- Pods
A collection of one or more Docker-based application containers and some common resources for those containers are referred to as a pod by the Kubernetes abstraction.
These sources include:- A unique cluster IP address, networking for volumes, and shared storage
- Information about how to operate each container, including the version of the container image and the ports to useDaemonSet
- DaemonSet
A DaemonSet ensures that a running copy of a Pod is present on every eligible node. Usually, the Kubernetes scheduler chooses the host machine for each pod. The responsibility for planning and building DaemonSet pods lies with the DaemonSet controller.
We need a separate Fluentd-Pod to manage log collection on each node since apps operate in pods and different pods may exist across different nodes: DaemonSet FluentD
| Looking forward to becoming a master in Containerization Courses? Check out the "Kubernetes Training" and get certified today. |
Kubernetes logging structure
Tracking cluster activity and fixing problems are made much easier by the logs. In Kubernetes, there are three main logging levels: basic, node-level, and cluster-level.
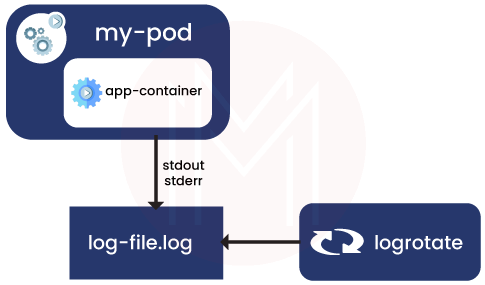
- Logging at the node level
A container engine manages and redirects the stderr and stdout streams of a containerized application. When a container restarts, the kubelet by default retains a terminated container along with its logs. When a pod is removed from a node, its associated containers and their logs are also taken away.
One of the most important aspects of node-level logging is the implementation of log rotation to avoid logs from taking up all of the node's storage space. Kubernetes shouldn't be in charge of rotating logs; that is the job of a deployment tool. - Cluster-level logging architectures
Although Kubernetes does not come with a native solution for cluster-level logging, there are a number of widely used strategies you can take into account. Here are some alternatives:
- Use an agent for node-level logging that runs on each node.
- Using a sidecar container with the logging agent
- From within an application, push logs directly to a backend.
- Use an agent for node-level logging that runs on each node.

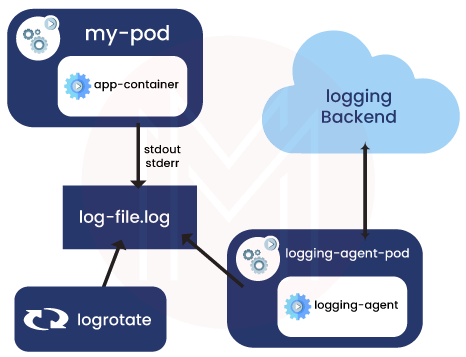
i. Using a node logging agent:
To implement cluster-level logging, a node-level logging agent can be installed on each node. To expose logs or push logs to a backend, a specialized tool called a logging agent is employed. The logging agent is often a container that has access to a directory holding log files from all of the application containers on that node.
Because the logging agent must be running on every node, it is recommended that you run the agent as a DaemonSet.
Node-level logging only creates one agent, and the programs already executing on the node do not need to be changed.
Although there is no set format, containers can write to stderr and stdout. A gathers and sends these logs for aggregate.
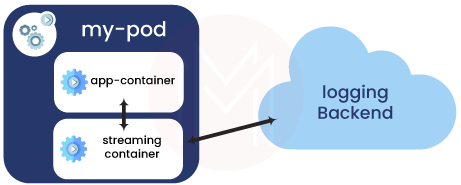
ii. Using a sidecar container with the logging agent
You can use a sidecar container in any of the following ways:
The sidecar container streams application logs to its own stdout.
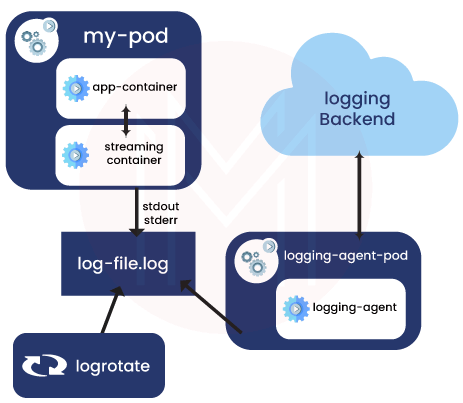
Make use of the logging agent and kubelet that are already active on each node by instructing your sidecar containers to write to their own stdout and stderr streams. The sidecar containers read the logs from the journal, socket, or files. Each sidecar container outputs a log to its own stderr or stdout stream.
This approach lets you separate the log streams coming from different application parts, some of which might not support writing to stderr or stdout.
A logging agent, running in the sidecar container, is set up to collect logs from an application container.
You can create a sidecar container with a different logging agent that is specifically configured to operate alongside your application if the node-level logging agent is not sufficiently versatile for your needs.
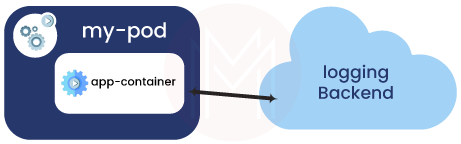
ii. From within an application, push logs directly to a backend.
The cluster-logging feature of Kubernetes does not expose or push logs directly from every application.
Now that we covered the fundamentals of logging, let’s explore the crucial component that can make logging tasks easier: Fluentd
| Would you like to ace Kubernetes job interviews? Top Kubernetes Interview Questions from MindMajix are exclusively for you! |
What is Fluentd?
Fluentd is a free and open-source data collector, which lets you unify the data. For better data utilization and interpretation, you can integrate data collection and consumption with Fluentd.
The Kubernetes container log files will be put up on Fluentd nodes, which will then filter and change the log data before sending it to the Elasticsearch cluster for indexing and storage.
Fluentd is a useful log aggregator. It was made in Ruby and is extremely scalable. For the vast majority of small- to medium-sized installations, Fluentd is speedy and only needs a little number of resources.

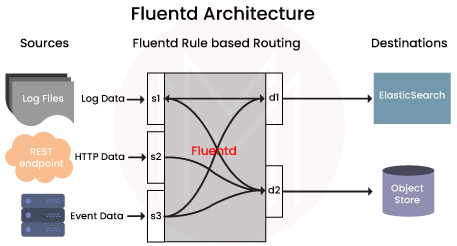
How does Fluentd Work?
Fluentd gathers logs from a predetermined set of sources, processes them (converting them into a structured data format), and then passes them on to other services like Elasticsearch, object storage, etc. in order to send logs to these other services. Fluentd supports more than 300 log storage and analysis services, which makes it incredibly flexible when it comes to integrations.
Fluentd receives data from a variety of sources.
- Data is tagged and structured.
- It disperses the data to different locations in accordance with matching tags.
Fluentd Daemon
For Kubernetes, a DaemonSet ensures that all (or a portion of) nodes are running a copy of a pod. To address the issue of log collection, we'll employ a Fluentd DaemonSet.
Step 1: Grant Permissions to Fluentd
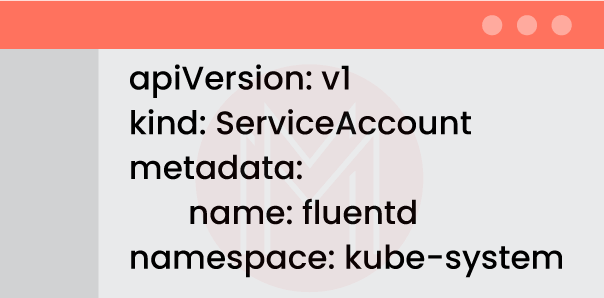
Since Fluentd will be collecting logs from user apps as well as cluster components like kube-apiserver and kube-scheduler, we must grant it some access.
Giving the future Fluentd DaemonSet a name is the first thing we must do. Let's build a new ServiceAccount in the Kube-system namespace to deploy Fluentd.
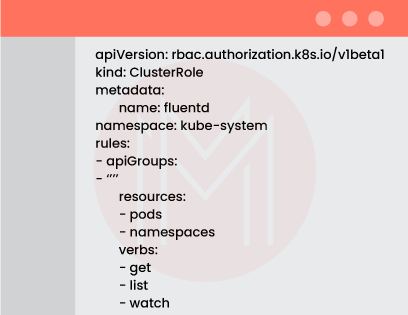
Next, let's grant Fluentd access to the namespaces and pods in your Kubernetes cluster so that it may read, list, and monitor them. This is how the ClusterRole manifest should look:
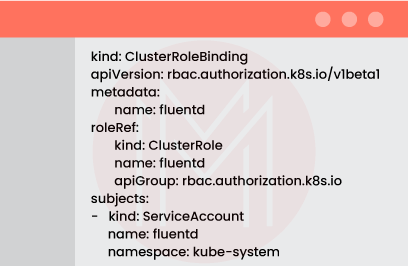
Finally, we must bind the Fluentd ServiceAccount to these permissions using the ClusterRoleBinding resource:
Using the —-delimiter, let's divide up these manifests and save them in the rbac.yml file before producing all resources at once:
kubectl create -f rbac.yml

serviceaccount "fluentd" created
clusterrole.rbac.authorization.k8s.io "fluentd" created
clusterrole binding.rbac.authorization.k8s.io "fluentd" created
Step 2: Deploy a DaemonSet
We can utilize the Fluentd Kubernetes Daemonset example available in the Fluentd repository after making a few modifications.
apiVersion: extensions/v1beta1
kind: DaemonSet
metadata:
  name: fluentd
  namespace: kube-system
  labels:
    k8s-app: fluentd-logging
    version: v1
    kubernetes.io/cluster-service: "true"
spec:
  template:
    metadata:
      labels:
        k8s-app: fluentd-logging
        version: v1
        kubernetes.io/cluster-service: "true"
    spec:
      serviceAccount: fluentd
      serviceAccountName: fluentd
      tolerations:
      - key: node-role.kubernetes.io/master
        effect: NoSchedule
      containers:
      - name: fluentd
        image: fluent/fluentd-kubernetes-daemonset:elasticsearch
        env:
        - name:  FLUENT_ELASTICSEARCH_HOST
          value: "f505e785.qb0x.com"
        - name:  FLUENT_ELASTICSEARCH_PORT
          value: "30216"
        - name: FLUENT_ELASTICSEARCH_SCHEME
          value: "https"
        - name: FLUENT_UID
          value: "0"
        # X-Pack Authentication
        # =====================
        - name: FLUENT_ELASTICSEARCH_USER
          value: "abf54990f0a286dc5d76"
        - name: FLUENT_ELASTICSEARCH_PASSWORD
          value: "75c4bd6f7b"
        resources:
          limits:
            memory: 200Mi
          requests:
            cpu: 100m
            memory: 200Mi
        volumeMounts:
        - name: varlog
          mountPath: /var/log
        - name: varlibdockercontainers
          mountPath: /var/lib/docker/containers
          readOnly: true
      terminationGracePeriodSeconds: 30
      volumes:
      - name: varlog
        hostPath:
          path: /var/log
      - name: varlibdockercontainers
        hostPath:
          path: /var/lib/docker/containers
There are several parts of this configuration to which you should pay attention:
- The
fluent/fluentd-kubernetes-daemonSet:elasticsearchDocker image is used by the DaemonSet to generate Fluentd output that is Elasticsearch. - A few environmental elements must be provided in order to connect to your Elasticsearch cluster. You can access Elasticsearch by using the following host, port, and credentials: (username, password).
- Fluentd requires root access in order to read the logs in
/var/logand write pos files to the directory. In your DaemonSet manifest, set theFLUENT_UIDenvironment variable to 0 to avoid permission issues.
Create a DaemonSet and store the manifest in the fluentd-elasticsearch.yml file.
kubectl create -f fluentd-elasticsearch.ymlIf you run a single-node cluster with Minikube, as we did, the DaemonSet will create one Fluentd pod in the kube-system namespace. You may check its logs using kubectl logs and find out its name with kubectl get pods —namespace=kube-system.
With the given host and credentials, Fluentd will connect to Elasticsearch right away.
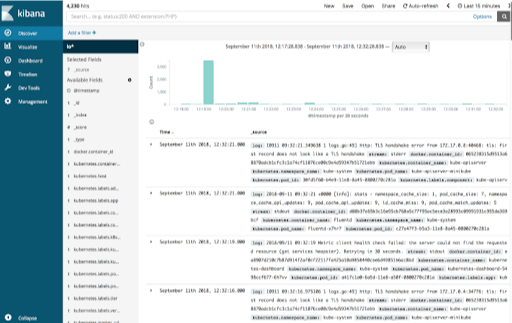
Let's view the logs that Fluentd has acquired by entering the Kibana dashboard. Under Management -> Index Patterns -> Create New Index Pattern, a new Logstash index produced by the Fluentd DaemonSet can be found. In order to transmit logs to Elasticsearch, Fluentd uses Logstash as an intermediary log shipper. After configuring a new index pattern, you may browse your app logs under the Discover tab.
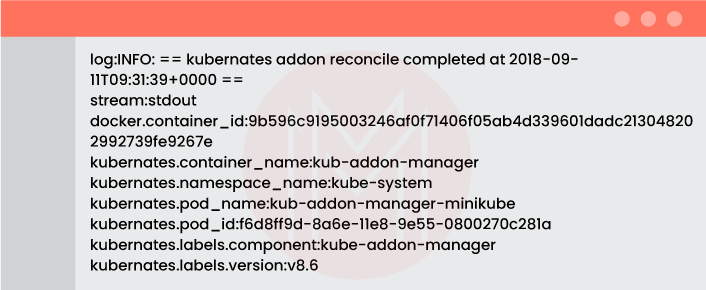
You may find here a variety of logs generated by your Kubernetes apps and Kubernetes system components. A shared log document created by Fluentd contains the name of the stream that generated the log, the log message, as well as Kubernetes-specific information like the namespace, the Docker container ID, pod ID, and labels (see the example below).
| Check Out: Kubernetes Vs Docker Swarm |
Understanding Fluentd Configuration Syntax
Typically, the Fluentd configuration file contains the following instructions:
- Source directives are used to define the input sources (e.g Docker, Ruby on Rails).
- Match directives are used to specify the output destinations.
- Filter directives determine the event processing pipelines.
- System configuration is done by system directives.
- Label routing instructions organize the output and filters.
- Through the use of @include directives, other files are included.
Let's examine some of the most widely used Kubernetes Fluentd configuration options. The official GitHub repository's Kubernetes.conf file contains a complete example of the Kubernetes configuration.
<match **>
  @type stdout
</match>
<match fluent.**>
  @type null
</match>
<match docker>
  @type file
  path /var/log/fluent/docker.log
  time_slice_format %Y%m%d
  time_slice_wait 10m
  time_format %Y%m%dT%H%M%S%z
  compress gzip
  utc
</match>
<source>
  @type tail
  @id in_tail_container_logs
  path /var/log/containers/*.log
  pos_file /var/log/fluentd-containers.log.pos
  tag kubernetes.*
  read_from_head true
<% if is_v1 %>
  <parse>
    @type json
    time_format %Y-%m-%dT%H:%M:%S.%NZ
  </parse>
<% else %>
  format json
  time_format %Y-%m-%dT%H:%M:%S.%NZ
<% end %>
</source>
The three blocks of the above configuration are match directives. These directives filter logs by provider or name and determine the destination of the output using the @type variable for them.
As in the second match directive, @type null is used to ignore certain logs. In the third match directive, we filter Docker logs and write them to /var/log/fluent/docker.log
Conclusion
We have now reached the end of this blog. We hope that the comprehensive and practical explanation of how to implement Fluentd Kubernetes was useful.
However, if you think any crucial information is ignored? We request you to post your comments with your ideas.
 On-Job Support Service
Online Work Support for your on-job roles.

Our work-support plans provide precise options as per your project tasks. Whether you are a newbie or an experienced professional seeking assistance in completing project tasks, we are here with the following plans to meet your custom needs:
- Pay Per Hour
- Pay Per Week
- Monthly
| Name | Dates | |
|---|---|---|
| Kubernetes Training | Jul 28 to Aug 12 | View Details |
| Kubernetes Training | Aug 01 to Aug 16 | View Details |
| Kubernetes Training | Aug 04 to Aug 19 | View Details |
| Kubernetes Training | Aug 08 to Aug 23 | View Details |