
- Dataflow Programming and Data Types in LabVIEW
- LabVIEW Interview Questions
- LabVIEW Programming
- LabVIEW Tutorial
- Block Diagram in LabVIEW
- LabVIEW Graphs and Charts
- Initializing Arrays In Labview
- Introduction of Repetition And Loops in LabVIEW
- Local and Global Variables in LabVIEW Tutorial
- Overview Of Clusters In Labview
- Shift Registers in LabVIEW
- Labview Structures
- LabVIEW Projects and Use Cases
- How to install LabVIEW on Windows
- LabVIEW Graphs and Charts
LabVIEW stands for Laboratory Virtual Instrument Engineering Workbench. It is a graphical programming language called ‘G’. Developers use LabVIEW to create programs for automated test and measurement systems, including those for product testing and related applications.
A block diagram is the essential framework for any virtual instrument (VI) in LabVIEW. In this tutorial, we’ll learn how to build block diagrams in LabVIEW and use LabVIEW tools to connect to VIs representing test or measurement instruments effectively.
This article deals with virtual instruments and modular programming in detail.
Table of Contents:
- Block Diagram in LabVIEW
- Key Components of a LabVIEW Block Diagram
- VI Properties Dialog Box – LabVIEW
- LabVIEW Block Diagram Example
- Creating a Connector Pane in Modular Programming
- Opening, Editing, Saving, and Placing SubVIs
- Creating SubVIs from a VI in Modular Programming
- SubVI Debugging and Error Handling
- LabVIEW Hardware Interface
- Frequently Asked Questions
Block Diagram in LabVIEW:
In this part of the tutorial, we’ll discuss block diagrams in LabVIEW in detail and their components. We will also learn how to open, edit, save, and place subVIs.
A LabVIEW block diagram is a graphical representation of the source code for a LabVIEW program. That’s where you define the program logic for acquiring data, controlling devices, and more. In LabVIEW, you will create VIs similar to programs used in text-based programming languages.
LabVIEW block diagrams consist of visual components representing I/O operations, functions, and data flow. They allow you to separate program logic from the user interface. The front panel serves as the interface for input and output.
The LabVIEW block diagram lets you see how data flows between various LabVIEW components.
Front-panel objects appear as terminals in the block diagram. Terminals on the block diagram show the changes made to the front panel objects.
- Block Diagram Objects and Environment
Block diagram objects include terminals, subVIs, functions, constants, structures, and wires that transfer data among other block diagram objects.
You can use LabVIEW tools to create, modify, and debug a VI. A tool is a special operating mode of the mouse cursor, so the operating mode of the cursor corresponds to the icon of the selected tool.
LabVIEW selects the tool based on the mouse's current location. You can manually select the tool you need from the Tools palette. Now you can choose your desired tool, which remains selected until you choose another tool from the Tools palette.
- VI Toolbar
You can use the buttons on the VI toolbar to:
-
- Run, pause, abort, and debug VIs
- Configure fonts
- Align, group, and distribute objects
| If you want to enrich your career and become a professional in LabVIEW, then enrol in "LabVIEW Online Training". This course will help you to achieve excellence in this domain. |
Key Components of a LabVIEW Block Diagram:
A LabVIEW block diagram can be built using components like functions, controls, wires, and indicators. These components are the building blocks of LabVIEW Virtual Instruments.
Let’s take a deep look at the components in this section.
1) Functions
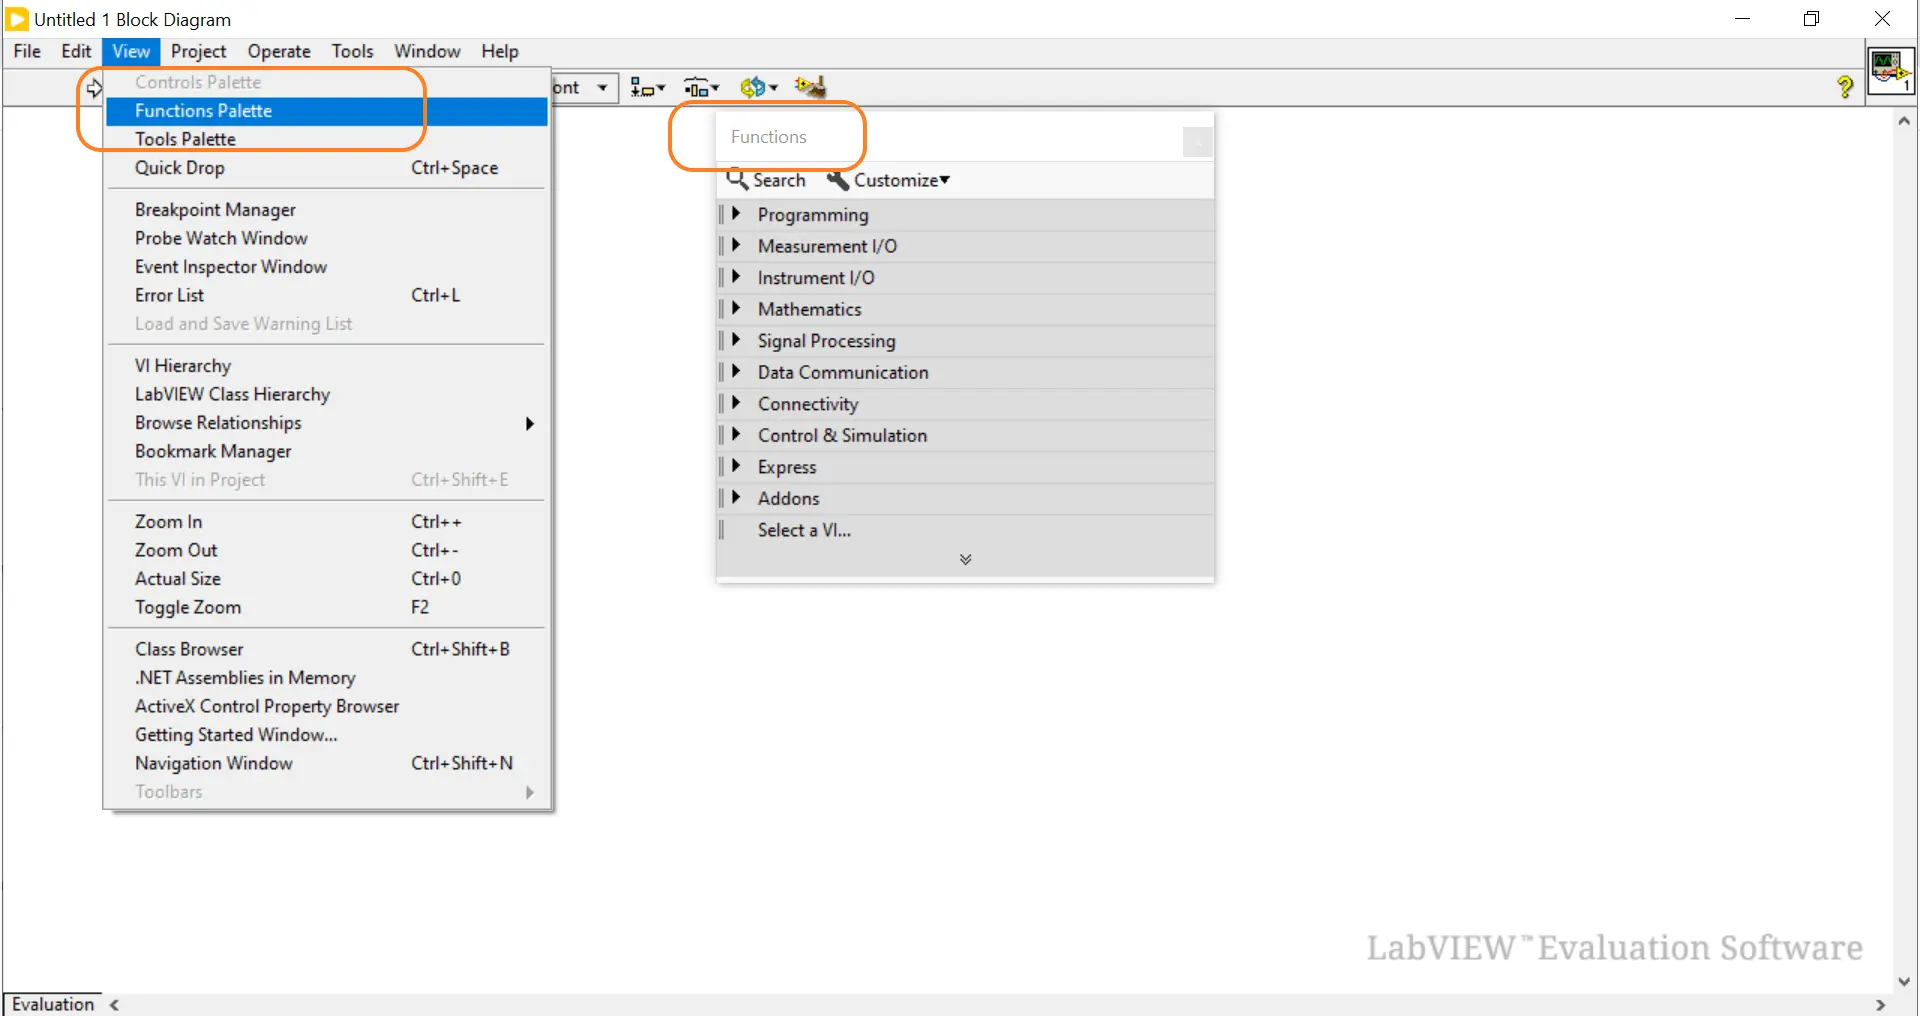
Functions are the core of any LabVIEW block diagram, and their icons have a pale yellow background. These include mathematical operations, signal processing, and data analysis.
In LabVIEW, functions are grouped into many categories, as outlined below.
- Mathematics: This group includes functions for arithmetic, trigonometric, and logarithmic operations.
- Programming: It includes functions for logic, Booleans, arrays, loops, synchronization, and more.
- Instrument I/O: This group contains interface functions such as instrument drivers, GPIB, NI-VISA, etc.
- Data communication: It provides functions for enabling communication, including protocols, network streams, variables, data sockets, synchronization, and more.
2) Wires
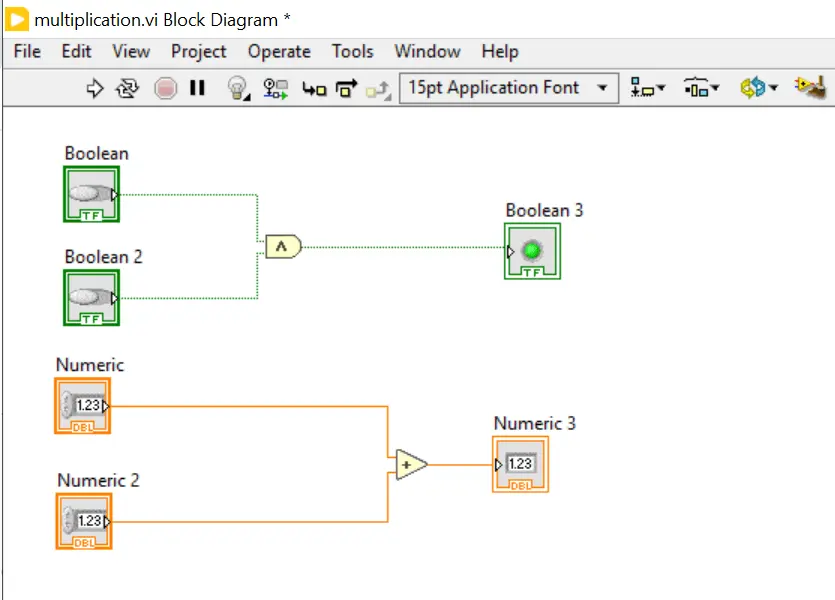
In LabVIEW, you use wires to connect controls, indicators, and functions. Wires in a block diagram represent data flow between components, allowing you to monitor and troubleshoot them when needed.
Depending on their data types, you can find wires in different styles, colors, and thicknesses as follows:
- Orange or Blue wire – This color shows the numeric data flow.
- Pink wire – It shows the string data flow.
- Green wire – It shows the Boolean data flow.
3) Wire Features
- Data in a block diagram flows along the wires.
- A broken wire appears as a dashed black line with an X in its center.
- Broken wires occur when you try to wire two objects with incompatible data types. For example, you cannot wire between numeric and array data types.
- The direction of the wires must be correct. A wire must connect at least one input to at least one output.
- You cannot wire two indicators together.
- You can right-click on wires and select ‘Clean Up Wire’ to remove broken wires.

4) Terminals
- Terminals are entry and exit ports in LabVIEW. They interchange information between the front panel and the block diagram.
- They are similar to parameters and constants used in text-based programming.
- Below are the types of terminals:
- Control
- Node terminal
- Indicator terminal
5) Controls
- Controls are located on the front panel.
- They are represented as terminals and send inputs to VIs.
- Examples of controls include numeric input boxes, sliders, buttons, and dials.
6) Indicators
- Indicators are the outputs of a VI and display results.
- LEDs, graphs, and numeric displays are examples of indicators.
7) Structures
Structures in LabVIEW support organizing programs, processing functions, and controlling the flow of program execution.
Below are the typical structures used in LabVIEW block diagrams.
- For loop – This loop executes a set of code for a specific number of times.
- While loop – This loop runs code until the set condition is met. It is ideal for monitoring sensor data.
- Case structure – It executes code based on an input value. It is similar to the if-else statement in conventional programming.
- Sequence Structure – This structure is ideal for applications that include sequential processing.
8) SubVIs
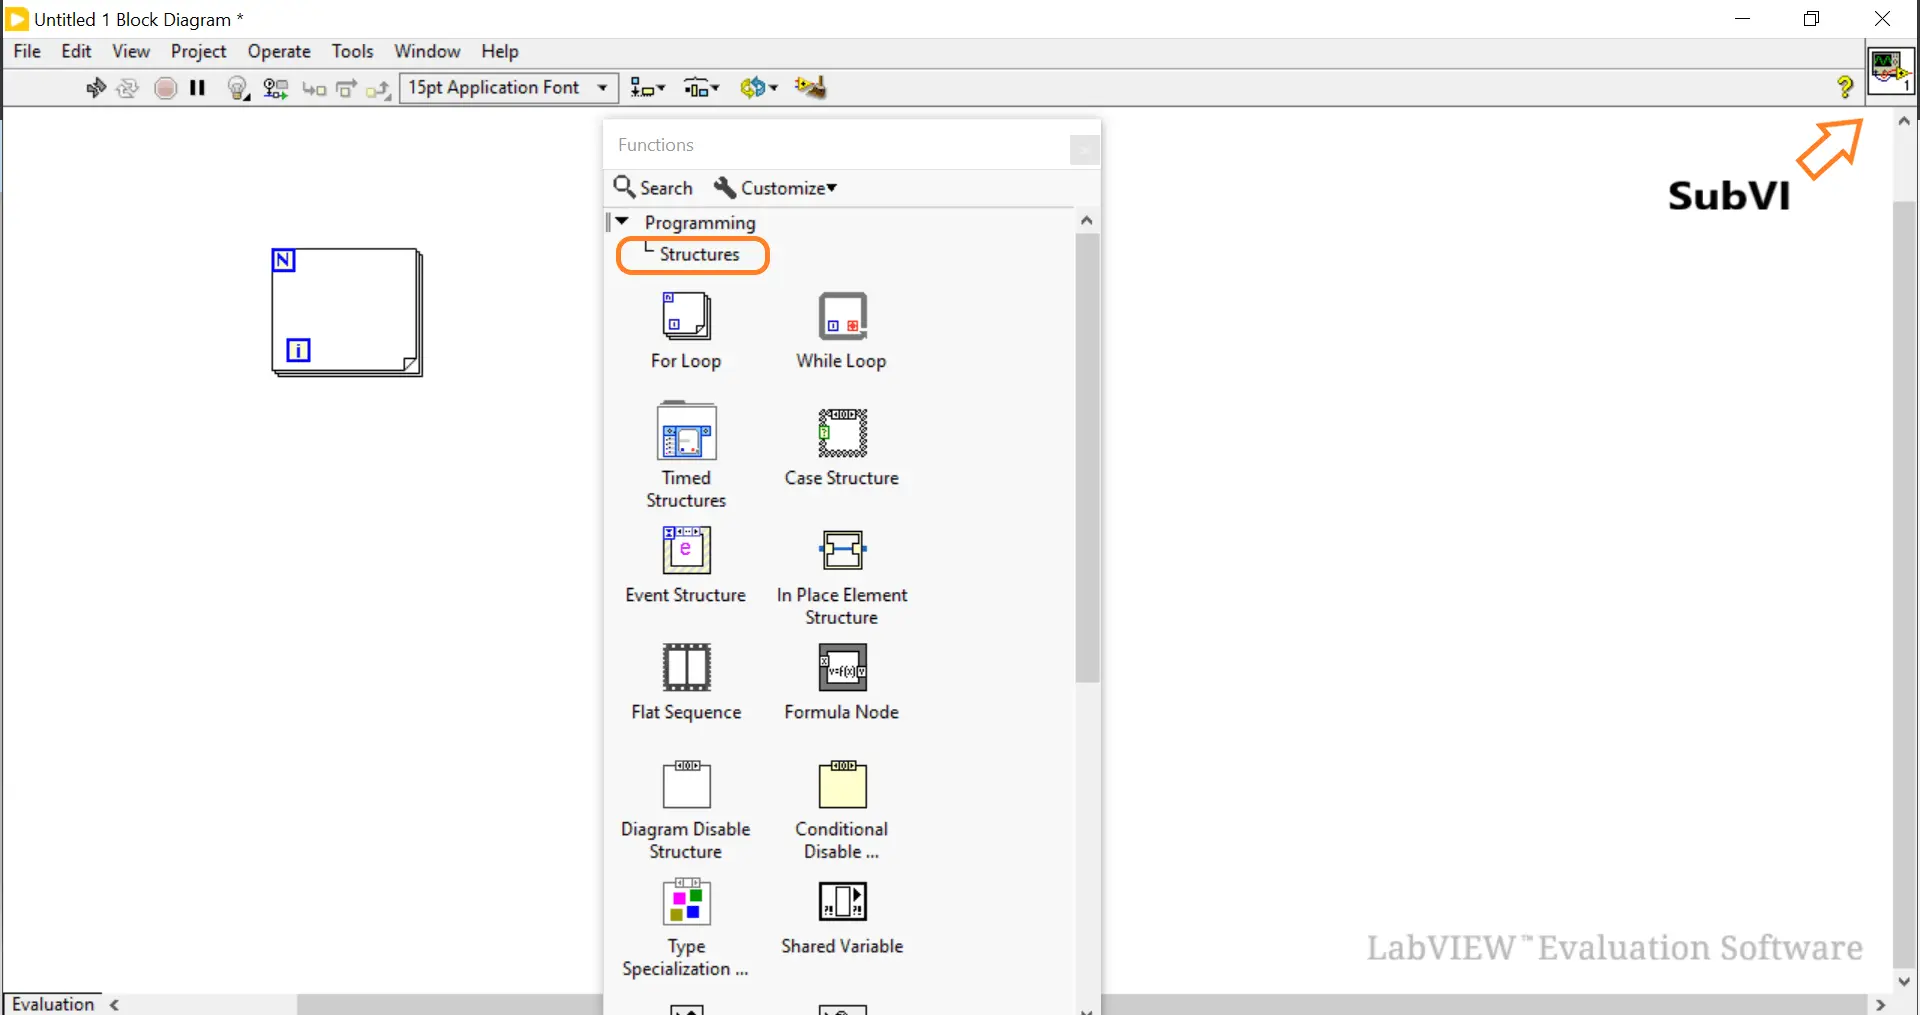
- A subVI is essentially a part of a VI. A VI is considered a subVI when it is used within another VI.
- A subVI is analogous to subroutines or functions used in text-based programming.
- SubVIs encourage code modularity and reuse. You can reuse a subVI in multiple parts of a program.
- You can even use a subVI in another VI.
- You can create a subVI by selecting a part of the block diagram.
- When you double-click a subVI on the block diagram, its front panel and block diagram will pop up.
- The upper-right corner of the front panel displays the VI icon. You can also find the icon in a block diagram. This icon will appear when you place the VI on a block diagram as a subVI.
9) Nodes
- Nodes are objects with inputs and outputs on a LabVIEW block diagram.
- They can be subVIs, functions, or structures.
- They are similar to statements, functions, operators, and subroutines that you use in text-based programming.
- The ‘Add’ and ‘Subtract’ functions are examples of nodes.
10) Express VIs
- Express VIs are nodes that use minimum wiring in block diagrams.
- They are interactive VIs with configurable dialog pages.
- SubVIs can also be Express VIs. You can save the configuration of an Express VI as a subVI.
- You can use Express VIs for measurement tasks.
- LabVIEW uses colored icons to distinguish between Express VIs, VIs, and functions on the block diagram.
- Icons for Express VIs have blue color borders, whereas icons for VIs have white borders.
11) Error handling
LabVIEW includes error-handling functions for issues such as invalid inputs and hardware failures. These functions enable actions based on needs, such as halting the program or logging the error.
Advantages of LabVIEW Block Diagram:
Here is a list of the benefits of LabVIEW block diagrams.
- LabVIEW block diagram is a robust platform for developing graphical programs.
- Anyone without much expertise can easily understand the program logic from the block diagram.
- You can reuse subVIs to build complex programs quickly.
- You can visualize data flow and errors in wires.
Related article: Local and Global Variables in LabVIEW
VI Properties Dialog Box – LabVIEW
Front panel objects also have property dialog boxes that you can use to change the look or behavior of front panel objects. You can right-click the front panel object. Then, you must select ‘Properties’ from the shortcut menu to access the property dialog box for an object.
The options available on the property dialog box for an object are similar to those of the shortcut menu for that object.
- Tools Palette in LabVIEW
You can create, change, and debug VIs using the tools located on the floating Tools palette. A tool is a special operating mode of the mouse cursor. The cursor corresponds to the icon of the tool selected in the Tools palette.
You can use the tools to operate on and modify front-panel and block-diagram objects. You can manually select the tool you need from the Tools palette.
LabVIEW Block Diagram Example:
Consider a scenario in which you must create a block diagram to add two numbers.
Solution:
Here is the step-by-step procedure to create a VI that adds two numbers.
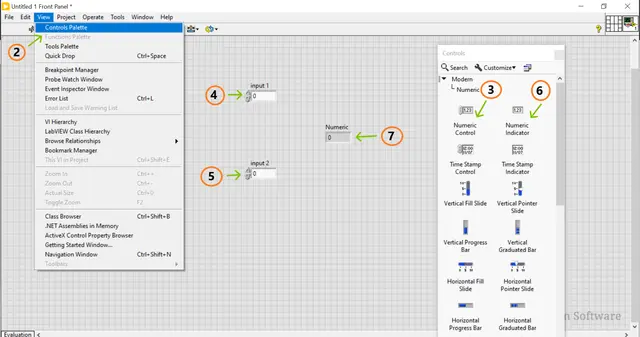
A. Design the front panel
- Step 1: Open a VI in LabVIEW
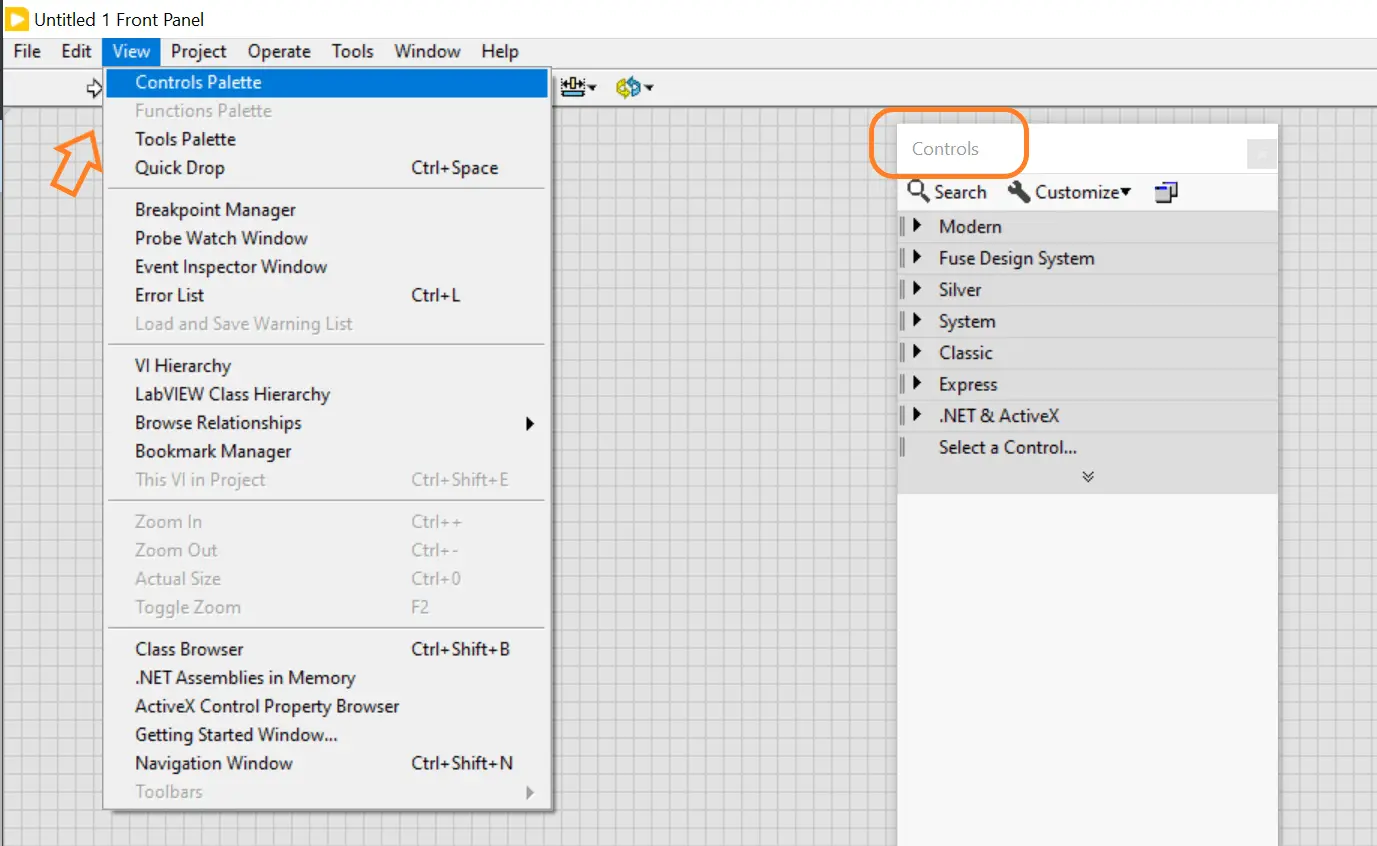
- Step 2: Click View → Controls palette.
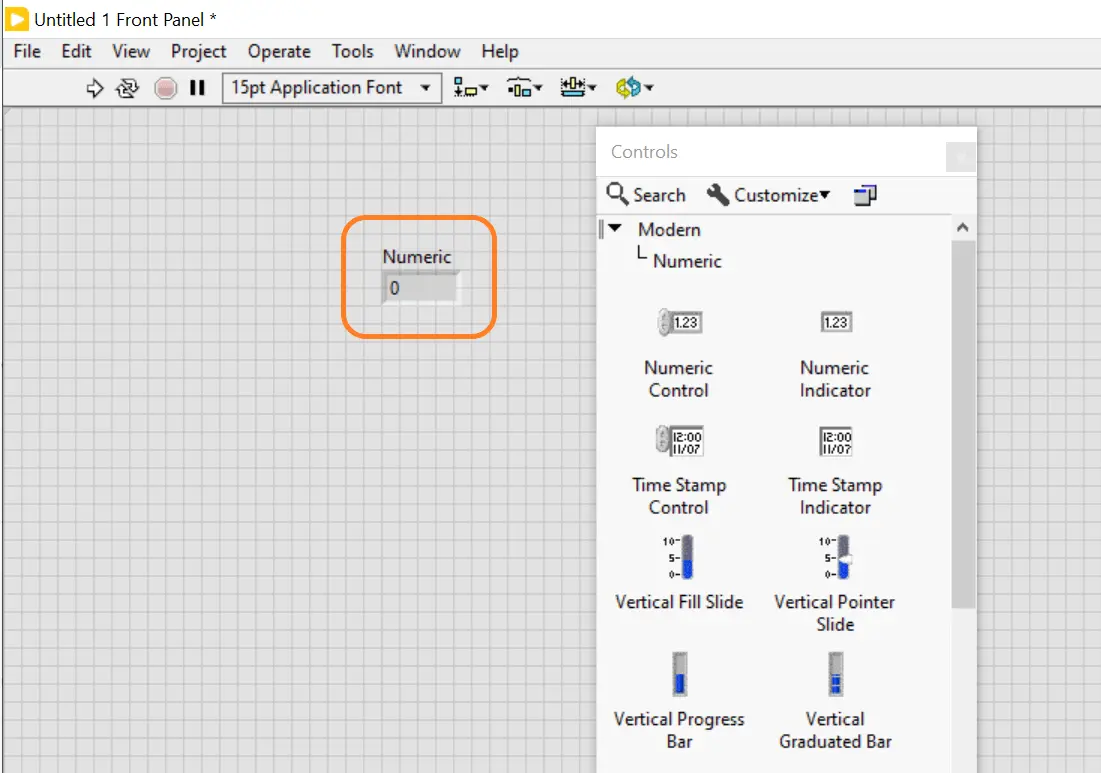
- Step 3: Navigate to the controls pane and select numeric controls.
- Step 4: Drag it onto the front panel to enter input.
- Step 5: Drag another numeric control onto the front panel to enter another input.
- Step 6: Select a numeric indicator from the controls pane.
- Step 7: Drag it into the block diagram.
B) Create the block diagram
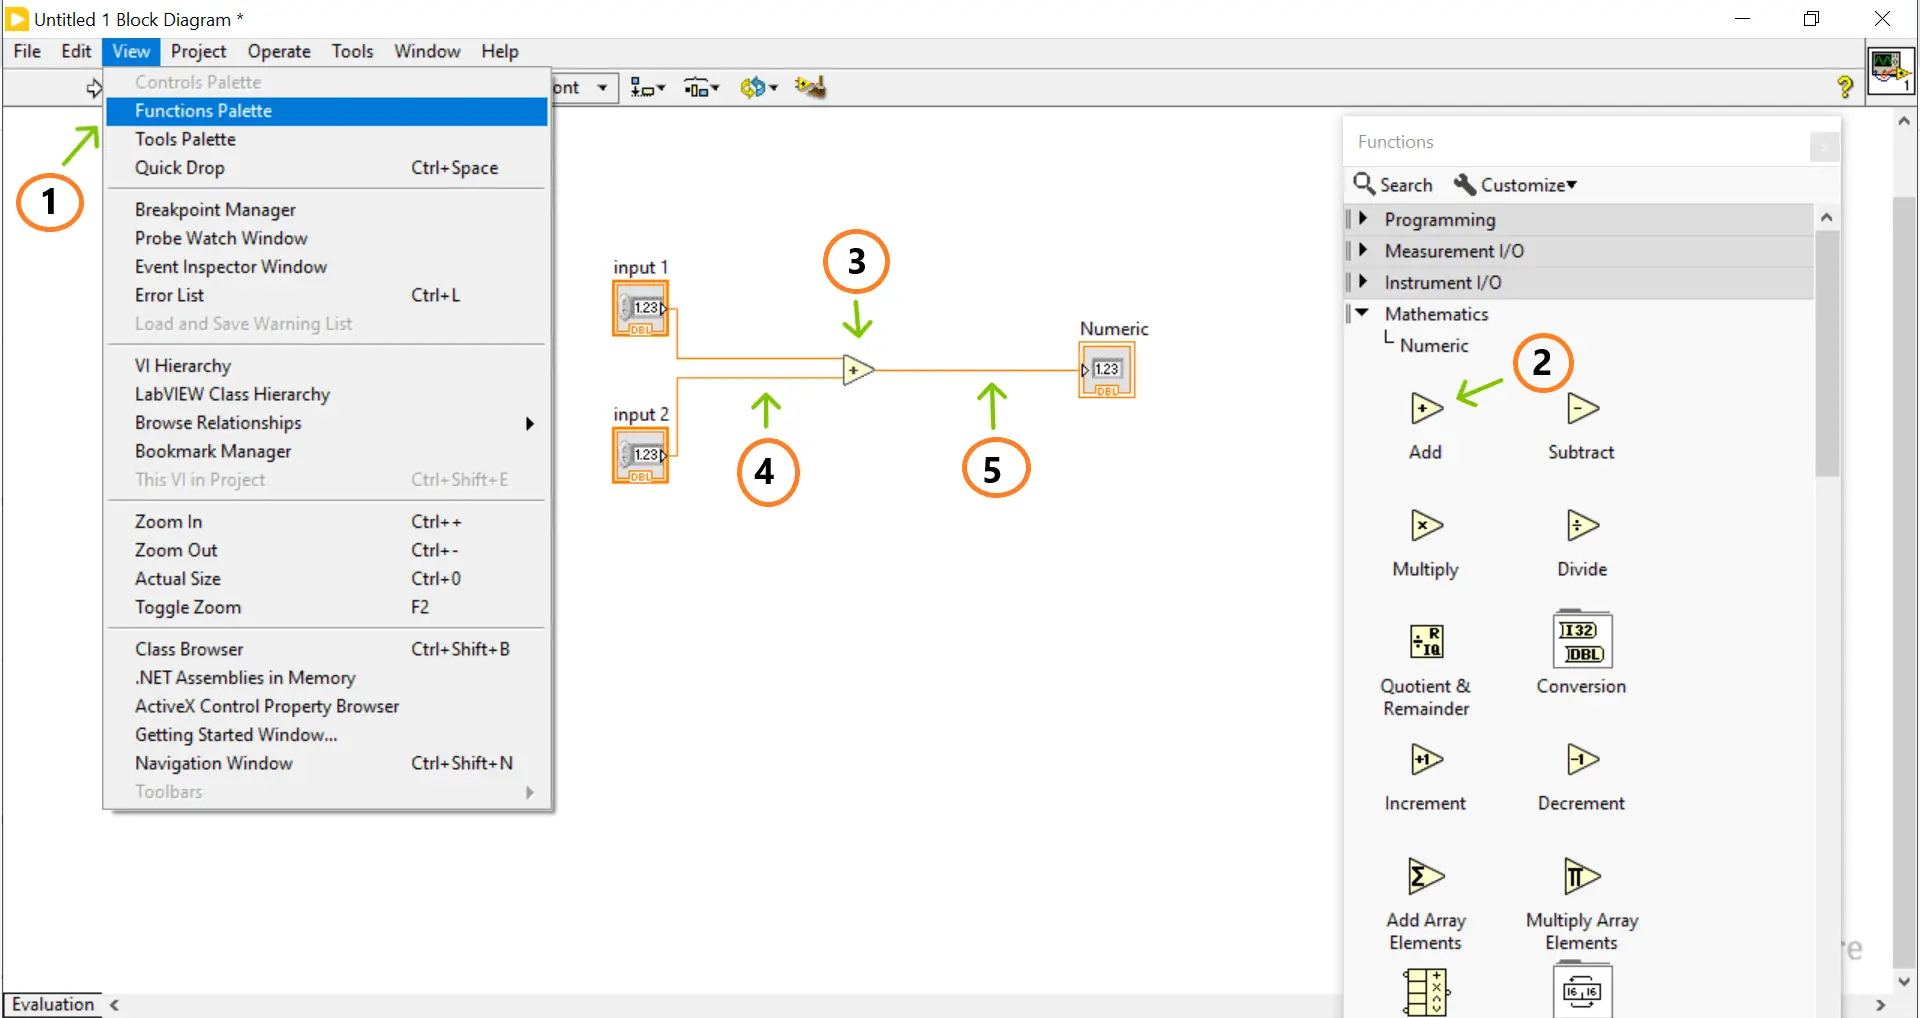
- Step 1: Go to View → Functions Palette
- Step 2: Select Mathematics → Numeric → Add object
- Step 3: Drag the ‘Add’ function into the block diagram.
- Step 4: Connect the controls to the ‘Add’ function.
- Step 5: Connect the indicator to the ‘Add’ function.
C) Run and Test the VI
- Step 1: Run the VI
- Step 2: View the output in the indicator in the front panel.
- Step 3: Monitor the data flow and check for errors or unexpected results.
- Step 4: If there is an error, you can use debugging tools such as execution highlighting, probes, and other features.
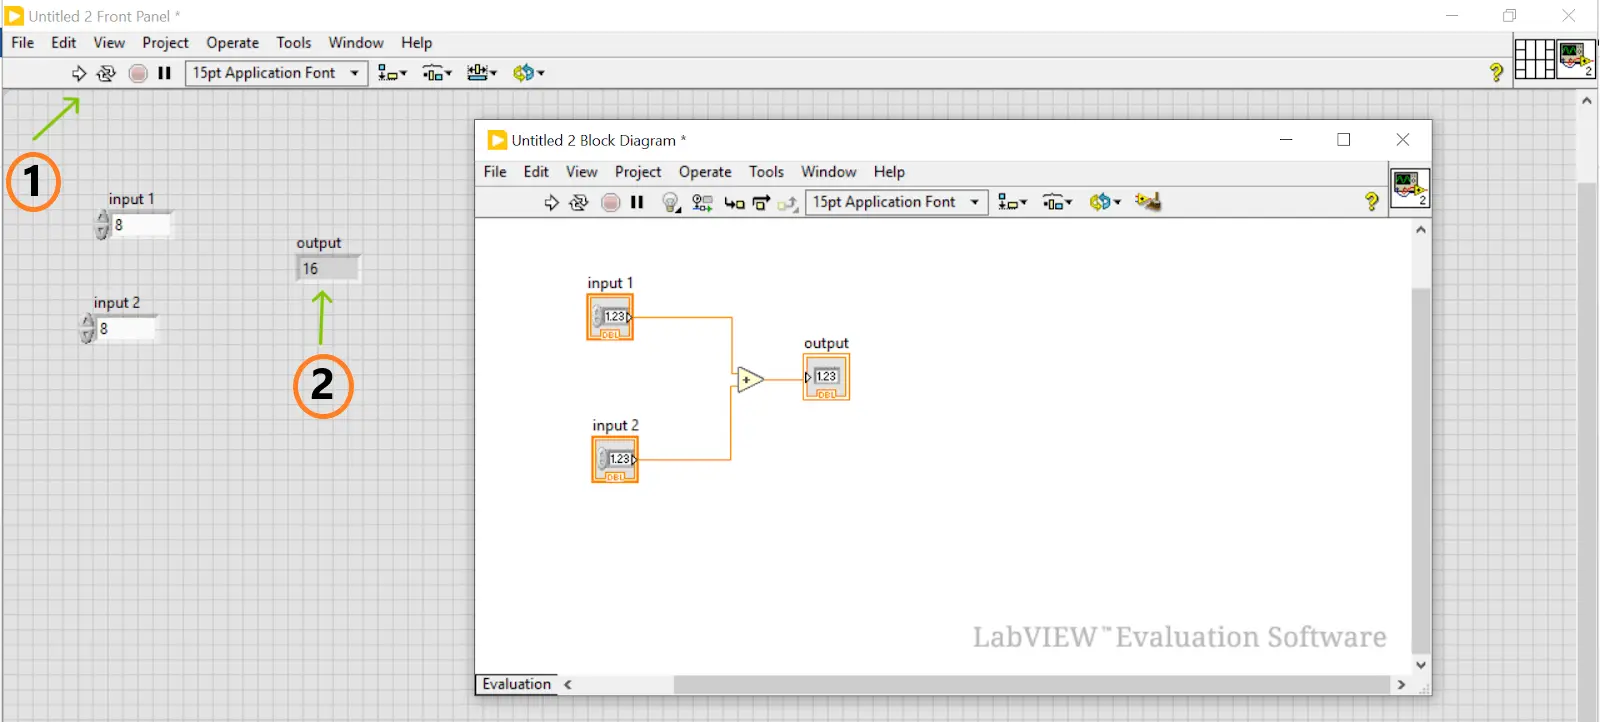
In this example, the input data flows from numeric controls to the add function, which processes it. Then, the output data flows from the add function to the numeric indicator.
Related article: LabVIEW Programming
Creating a Connector Pane in Modular Programming:
The connector pane is a group of terminals related to the controls and indicators of that VI. It is similar to the parameter list of a function call in text-based programming languages.
Let’s dig further into the connector pane in LabVIEW.
- It defines the inputs and outputs you can wire to the VI, enabling you to use it as a subVI.
- It receives data at its input terminals.
- It passes data to the block diagram code via the front panel controls.
- It receives results from the front panel indicators at its output terminals.
- When you view the connector pane for the first time, you see a default connector pattern.
- You can select an appropriate pattern by right-clicking the connector pane and selecting Patterns from the shortcut menu. After you select a connector pane pattern, you can customize it to suit the VI by adding, removing, or rotating the terminals.
- To add a terminal to the pattern, place the cursor where you want to add the terminal, right-click, and select Add Terminal from the shortcut menu.
- To remove an existing terminal from the pattern, right-click the terminal and select Remove Terminal from the shortcut menu.
- To change the spatial arrangement of the connector pane patterns, right-click the connector pane and select Flip Horizontal, Flip Vertical, or Rotate 90 Degrees from the shortcut menu.
Assigning Terminals to Controls and Indicators:
After you choose a pattern to use for the connector pane, you must assign a front panel control or indicator to each of the connector pane terminals. To link controls and indicators to the connector pane, place inputs on the left and outputs on the right to avoid complex or confusing wiring.
You need to complete the following steps to assign terminals to controls and indicators in a connector pane.
- Step 1: Ensure that you have selected a pattern sufficient for the number of controls and indicators you want to assign to the connector pane.
- Step 2: Right-click the icon in the upper-right corner of the front panel and select Show Connector from the shortcut menu to display the connector pane. The connector pane appears in place of the icon.
- Step 3: Click a terminal in the connector pane. The tool automatically changes to the wiring tool, and the terminal turns black.
- Step 4: Click the front panel control or indicator you want to assign to the terminal.
- Step 5: Click an open space on the front panel. The marquee disappears, and the terminal changes to the control's data type color to indicate that you connected the terminal. If the connector pane terminal turns white, a connection was not made. Repeat steps 1 through 3 until the connector pane terminal changes to the correct data-type color.
- Step 6: Repeat steps 3 through 5 for each control and indicator you wish to assign to a terminal. If you must change the control or indicator assigned to a terminal, you must delete the connection and repeat steps 3 through 5 to assign a different control or indicator to the terminal.
- Step 7: If necessary, confirm each terminal connection. You can specify which terminals are required, recommended, and optional. You can connect only one control or indicator to a terminal.
Image
Confirming Terminal Connections:
To confirm which control or indicator is assigned to a connector pane terminal, click the terminal in the connector pane. A marquee highlights the assigned object.
You can also use the wiring tool to click the control or indicator. The color of the assigned terminal in the connector pane darkens.
Deleting Terminal Connections:
You can delete connections between terminals and the corresponding controls or indicators individually or all at once. Follow these steps to delete a terminal connection.
- Step 1: Right-click the terminal you want to disconnect on the connector pane and select Disconnect This Terminal from the shortcut menu.
- Step 2: The terminal turns white, indicating that the connection no longer exists.
- Step 3: Disconnecting this terminal is different from removing the terminal.
- Step 4: To delete all connections on the connector pane, right-click anywhere on the connector pane. Then choose ‘Disconnect All Terminals’ from the shortcut menu.
Opening, Editing, Saving, and Placing SubVIs:
When you double-click a subVI, a front panel and a block diagram appear, instead of a dialog box to configure options. The subVI controls and indicators receive data from and return data to the block diagram of the calling VI.
You need to click the ‘Select a VI’ icon or text on the Functions palette, navigate to, and double-click a VI. Then, you can place the VI on a block diagram to call a created subVI.
Complete the following steps to open and edit a subVI.
- Step 1: You can use the operating or positioning tool to double-click the subVI on the block diagram. LabVIEW shows the subVI's front panel. You can also press the <Ctrl> key and use the operating or positioning tool to double-click the subVI on the block diagram to display its block diagram and front panel.
- Step 2: Edit the subVI.
Placing SubVIs On Block Diagrams:
Complete the following steps to place a subVI on the block diagram.
- Step 1: Display the block diagram of a new or existing VI by selecting Window → Show Block Diagram.
- Step 2: If necessary, display the Functions palette by selecting View → Functions Palette.
- Step 3: Click the Select a VI icon on the Functions palette.
- Step 4: Navigate to the VI you want to use as a subVI, then double-click it and place it on the block diagram.
- Step 5: Wire the subVI terminals to other nodes on the block diagram.
Saving SUBVIs:
Select File → Save to save a VI. You can save VIs as individual files or group several VIs into a LabVIEW Library (LLB). LLB files end with the extension .llb. National Instruments recommends saving VIs as individual files, organized in directories.
Creating SubVIs from a VI in Modular Programming:
Modularity is the use of smaller elements to accomplish a larger goal. Program modularity in LabVIEW refers to dividing code into smaller units called subVIs.
Let’s learn how to construct a subVI, customize its icon appearance, and build and configure the connection pane.
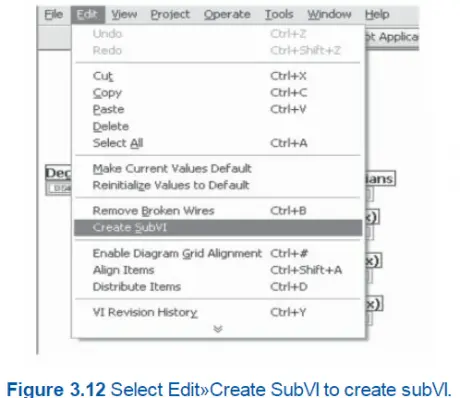
You can convert a section of a VI into a subVI by using the positioning tool to select the section of the block diagram you want to reuse. Then select Edit → Create SubVI from the menu to change the selected portion into a subVI. The SubVI is created with a default icon.
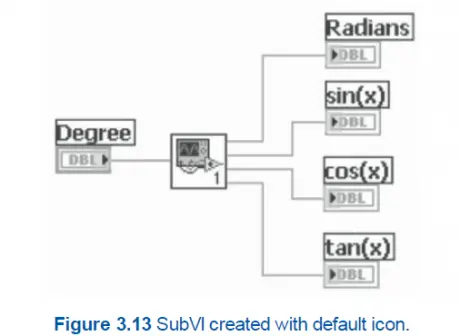
An icon for the new subVI replaces the selected section of the block diagram. LabVIEW builds controls and indicators for the new subVI. It automatically configures the connector pane based on the number of control and indicator terminals you selected, and wires the subVI to the existing wires.
You can select Edit → Create SubVI to create a subVI.
Creating a subVI from a selection is convenient, but it still requires careful planning to build a logical hierarchy of VIs.
SubVI Debugging and Error Handling:
Let’s discuss the debugging and error handling practices you adopt to optimize subVIs in a block diagram in LabVIEW.
- Debugging SubVIs:
- The highlight execution method visually tracks the data flow in a SubVI. Additionally, using this method ensures the subVI is working as expected.
- Breakpoints are used to examine variables at specific points in a subVI.
- Use probes to investigate data flow at specific points within a subVI.
- Error Handling:
- Managing errors efficiently by using error clusters, which are used to pass error information from one subVI to another.
- Using an error handler to manage errors in subVIs.
LabVIEW Hardware Interface:
LabVIEW VIs can communicate with hardware devices using APIs, libraries, and drivers. These tools support connecting LabVIEW with hardware used in instrument control, data acquisition, and many other applications.
Let’s take a look at the interfacing tools in this section.
- NI DAQmx – NI’s software framework for connecting to DAQ hardware. It streamlines the analog and digital signals used in data acquisition and processing.
- GPIB (General Purpose Interface Bus) – It is a hardware interface that enables the connection of older devices.
- VISA (Virtual Instrument Software Architecture) – It is a standard API for controlling instruments via USB or Ethernet.
- Instrument Drivers – These drivers help to control power supplies, oscilloscopes, and signal generators. NI’s library system contains all these drivers. You can access them via the NI Instrument Driver Network.
Frequently Asked Questions:
1) Is learning LabVIEW easy for beginners?
Yes, beginners can learn LabVIEW easily. If they have a basic understanding of testing systems, instrumentation, controls, and indicators, it will help them learn LabVIEW more quickly.
2) What is a LabVIEW block diagram?
- It is a graphical representation of source code for LabVIEW programs.
- It shows the program's logic and execution flow.
- It consists of nodes and wires to visually represent the program logic.
3) How long does it take to learn LabVIEW?
You can learn LabVIEW in four weeks. If you continue practicing hands-on exercises beyond the training, you will gain mastery of the LabVIEW programming language and develop testing systems.
4) What are the common mistakes that may occur while creating LabVIEW diagrams?
- Data type mismatches – You must ensure that wires connect compatible data types.
- Memory Leaks – Poor memory management will trigger performance issues.
- Unwired Terminals – All terminals must be wired; otherwise, they may cause unexpected behavior.
5) Can you describe the error handling procedure in the LabVIEW block diagram?
- First, start the VI.
- Check for errors in the VI.
- If there is no error, continue processing the VI.
- If any error occurs, pass the error cluster to an error handler.
- Clear the error cluster once the errors are handled.
- Exit the VI.
Conclusion:
It’s a wrap! You have understood that you can create block diagrams for various applications, from simple mathematical calculations to complex data-acquisition and control systems, using LabVIEW.
If you want to learn LabVIEW in-depth and work on real-time examples, you can reach out to MindMajix. By the end of the training, you will acquire the in-demand skills required for a competent LabVIEW professional and be ready to apply for multiple job roles.
 On-Job Support Service
Online Work Support for your on-job roles.

Our work-support plans provide precise options as per your project tasks. Whether you are a newbie or an experienced professional seeking assistance in completing project tasks, we are here with the following plans to meet your custom needs:
- Pay Per Hour
- Pay Per Week
- Monthly
| Name | Dates | |
|---|---|---|
| LabVIEW Training | Oct 24 to Nov 08 | View Details |
| LabVIEW Training | Oct 27 to Nov 11 | View Details |
| LabVIEW Training | Oct 31 to Nov 15 | View Details |
| LabVIEW Training | Nov 03 to Nov 18 | View Details |

Priyanka Vatsa is a Senior Content writer with more than five years’ worth of experience in writing for Mindmajix on various IT platforms such as Palo Alto Networks, Microsoft Dynamics 365, Siebel, CCNA, Git, and Nodejs. She was involved in projects on these technologies in the past, and now, she regularly produces content on them. Reach out to her via LinkedIn and Twitter.


