
- Splunk API
- Splunk Careers
- IBM QRadar vs Splunk
- Splunk Architecture
- Splunk Admin Interview Questions
- Splunk Alerts
- Splunk Alternatives
- Splunk CIM
- Splunk Cloud
- Splunk Dashboard
- Splunk Dedup
- Splunk Education
- Splunk Enterprise
- Splunk Enterprise Security
- Splunk Eval Commands With Examples
- Splunk Interview Questions
- Splunk Logging
- Splunk Regex Cheatsheet
- Splunk Rest API Overview
- Introduction to Splunk Rex
- Splunk Search Commands
- Splunk Software
- Splunk Stats
- Splunk Streamstats Command
- Splunk Timechart
- Splunk Tool
- What are Splunk Universal Forwarder and its Benefits
- Splunk vs ELK
- Splunk Alert and Report
- Monitor Windows Event Log Data – Splunk
- Splunk Universal Forwarder
- What are the Splunkbase Apps and Add-ons
- Splunk Join - Subsearch Commands & Examples
- What are Splunk Apps and Add-ons and its benefits?
- Top 10 OSINT Tools - Open Source Intelligence
- Splunk Connect For Kubernetes
- Grafana vs Splunk
- Elasticsearch vs Splunk
- Splunk vs Dynatrace
Splunk is a software that handles and provides in-depth knowledge about machine data and other kinds of big data. The machine data comes from mobile apps, IoT devices, etc. Splunk can read the semi-structured, unstructured data, and after reading the data, it enables us to tag, search, create dashboards and reports on that data. In this Splunk tutorial, you will learn how Splunk analyses and visualizes the machine data.
Splunk Tutorial for Beginners
What is Splunk
Splunk is a software that we use for analyzing and searching the machine data. The machine data can come from devices, web applications and sensors. It carries out indexing, correlating and capturing the live data in a queryable container and creates dashboards, graphs, alerts and visualizations. Splunk offers easily accessible data across the entire organization for diagnostics and solutions to different business problems.
| If you want to become a Splunk Certified Specialist, then Enrol “Splunk Online Training”. This course will help you to achieve excellence in this domain. |
Features of Splunk
Following are the essential features of Splunk:
Data Ingestion
Splunk ingests various data formats like XML, JSON and unorganized machine data like applications and weblogs. We can model the unorganized data into a data structure according to the requirement of the user.
Data Searching
In Splunk, we use indexed data for creating the metrics, identifying the patterns and predicting future trends in the data.
Data Indexing
In Splunk, we index the ingested data for quick querying and searching in various conditions.
Splunk Alerts
We use Splunk alerts for triggering the RSS feeds or emails when we find particular criteria in the data we analyse.
Data Model
We can model the data into multiple datasets that we establish on the particular domain. This results in easy navigation for users who analyze business cases.
Dashboards
Splunk Dashboards display the search results in the form of reports, pivots and charts, etc.
| Read these latest Splunk Interview Questions that help you grab high-paying jobs! |
Splunk Architecture
Following are the basic elements of Splunk Architecture:
Load Balancer:
It is the default load balancer of Splunk. Although it allows us to use our customized load balancer.
Universal Forward:
UF or Universal Forward is an entry-level element that loads the data to a heavy Splunk forwarder. We can install the universal forward at the application server or client-side. The job of this element is to forward the log data.
Indexer:
This element allows us to store and index the data. It enhances the Splunk search performance. Splunk carries out indexing automatically.
Heavy Forward:
It is a heavy element of Splunk architecture. This element allows us to filter the data.
License Manager:
The License is on the basis of usage & volume- for instance, 40GB per day. Splunk verifies the licensing details regularly.
Search Gain(SH):
We use this element for gaining performance and intelligence reporting.
Deployment Server:
It helps us to deploy the configuration. For Instance: Updating the configuration file.

Working of Splunk
- Indexer: It handles the incoming data in real-time. It indexes and stores the data on the index.
- Forwarder: Forwarder gathers the data from the remote machine and after that sends the data to index.
- Search Head: By using Search Head, users will interact with Splunk. It allows the users to do analysis, visualization and search.
Splunk Data Ingestion
In Splunk, we do data ingestion by using the “Add Data” feature that is present in the reporting and search app. After Signing in, the home screen of the Splunk interface displays the “Add Data” feature. After pressing that button, we can select the format and source of data.
Gathering the data
For analysis, we can get the data from the Splunk Official Website. We save this file and uncompress it in our local drive. After opening the folder, we can discover three files that have different formats. Those three files are log data. We can also collect another set of the data offered by Splunk. We use the data from those sets to understand the functioning of different features of the Splunk.
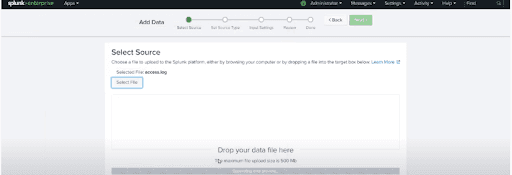
Uploading Data
After that, we select the file “access.log” from folder “mailsv” that we store in our local machine. After choosing the file, we shift to a later step through the green colour button that is present in the top right corner.
In the following screenshot, we can see how to select the “access.log” file.
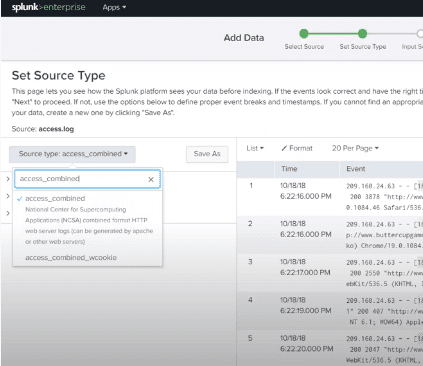
Selecting the source type
Splunk has a built-in feature to identify the data type we ingest. It provides users with a choice to select different data types than the data type selected by Splunk. After pressing the drop-down of the source type, we can see different data types that Splunk can ingest and allow to search.
In the following screenshot, we can see different source types.
Splunk Source Types
By using a built-in data processing unit, we judge the incoming data to Splunk and categorize into particular categories and data types. For instance, if it is the log from the apache web server, then Splunk can identify it and produce suitable fields from the data read. This feature of Splunk is known as source type detection, and it utilizes in-built source types that are known as “pretrained” source types.
Supported source types
We can see the endorsed support types by uploading the file through the “Add Data” feature, and after that, we choose the drop-down for the source type.
Basic Searching in Splunk
The search functionality of the Splunk allows us to search the complete data set that we ingest. We access this feature through the “Search & Reporting” app that is present in the left sidebar.
In the following screenshot, we can see the “Search & Reporting” feature.
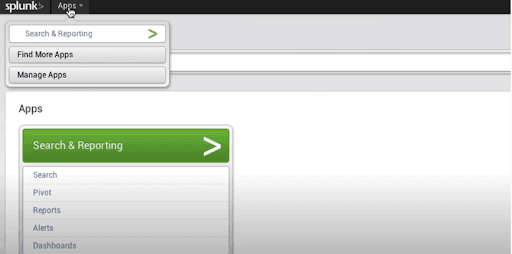
After pressing the “Search & Reporting” app, we can see a search bar through which we can search for our log data. We give the hostname in the pattern as displayed below and press the search icon that is present at the rightmost corner.
Combining the Search Terms
We combine the terms that we use to search by developing them sequentially, but we have to put user search settings beneath double-quotes.
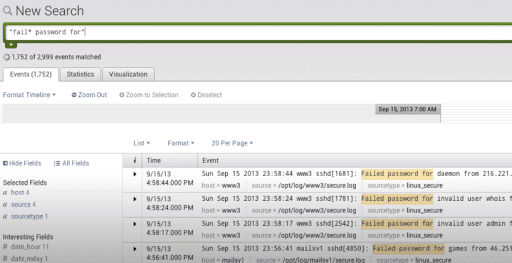
Use of Wildcards
We use wildcards in the search option blended with “OR/AND” operators. In the following search, we obtain the result where the log file contains the terms that have to fail, failure, failed, etc.
Filtering the Search Results
We can filter the search results by choosing a string and including it to the search.
Field Searching in Splunk
When Splunk scans the loaded machine data, it decodes the data and splits the data into various fields that depict logical facts about the complete data record. For Instance, one record may have a timestamp, server name of the event, event type, etc.
For unstructured data also, Splunk strives to split the fields into the key-value pairs or divide them according to the data types they contain the string, numeric, etc. After uploading the data, from “access.log” file, we can see fields by pressing the “show fields” link that opens the below screen.
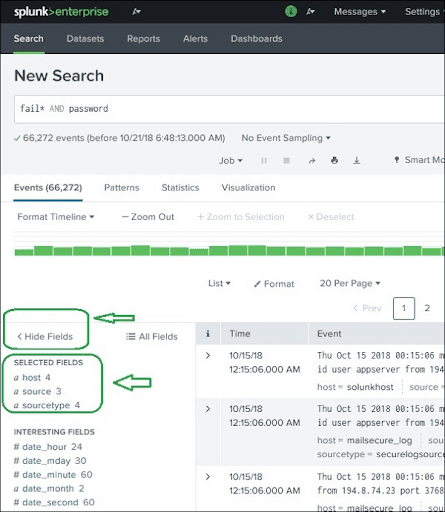
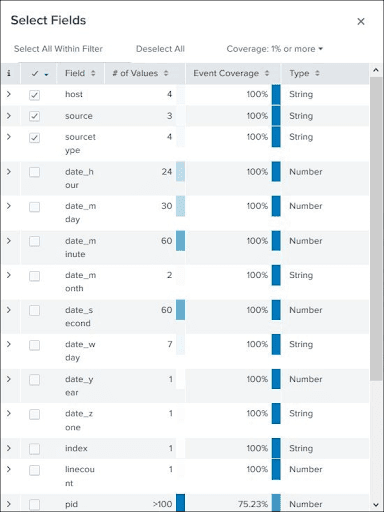
Selecting the Fields
By selecting or deselecting the fields from the fields list, we can display the fields. By pressing the “all fields” option, we can see all fields. By using the checkboxes, we can select the fields for display.
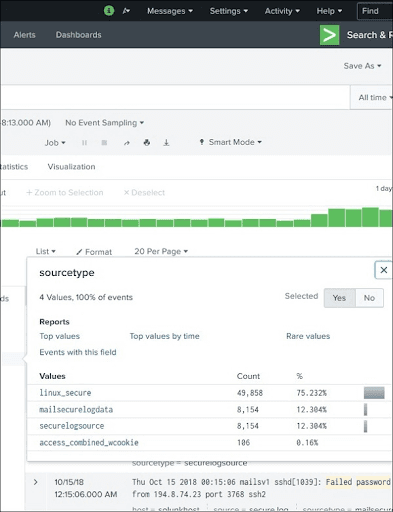
Field Summary
By pressing the field name, we can see the statistics or summary of the field. It displays distinct values for a field, like their percentages and their counts.
The following screenshot displays distinct values of the selected field.
Using the Fields in the Search
We can insert the field names into the search box with particular values for the search.
Splunk Search Language
The Search Processing Language of Splunk is a language that contains various functions, commands and arguments, and we use them to get the required results from a dataset. For instance, when we get the result set for a search term, we may continue to filter some more terms from the result set. For filtering, we must add some advanced commands to the existing commands.
Elements of SPL(Search Processing Language)
- Search Terms: Search Terms are the phrases, Keywords, or terms that we specify in the search bar for getting particular records from a dataset that satisfy the search criteria.
- Commands: Search Processing Language provides various built-in commands, and we use them to streamline the data analysis in the result set. For example, we use the “head” command to get the top 3 results from the search process.
- Functions: Besides commands, Splunk provides some built-in functions that take input from the field for analysis and gives the output after applying computations on that field.
- Clauses: When we have to get the results combined by a particular field, or we have to rename the field in the output, we use the “group by” clause and “as” clause.
Search Optimisation of Splunk
Splunk Contains optimization features, processes, analyses of our searches for getting the highest efficiency. Through the following optimization goals, we can get the maximum efficiency:
- Parallel Processing: The in-built optimizations can rearrange the search processing. Thus, we can run various commands parallelly on indexers before dispatching search results to search head for the final processing.
- Early Filtering: These optimizations refine the results too early. Thus, we can reduce the amount of data being processed in the search process. This early or initial filtering prevents not required lookup and determining computations for the events that are not included in the last search results.
Analyzing the Search Optimisations
Splunk has various tools to analyze how search optimization works. These tools assist us to find out how we use the filter conditions and what is the order of the optimization steps. It provides us with the expenditure of different steps that are not present in search activities.
Turning off the optimization
We can turn off built-in optimization and observe the variation in time taken for search results. The results can be or cannot be higher than the built-in search. We can turn off the search optimization for particular results.
Splunk Reports
In Splunk, we create the reports from the search action that displays visualizations and statistics of the events. We can run the reports anytime, and they can give the latest results every time we run them. We can share the reports with others, and we can add them to the dashboards.
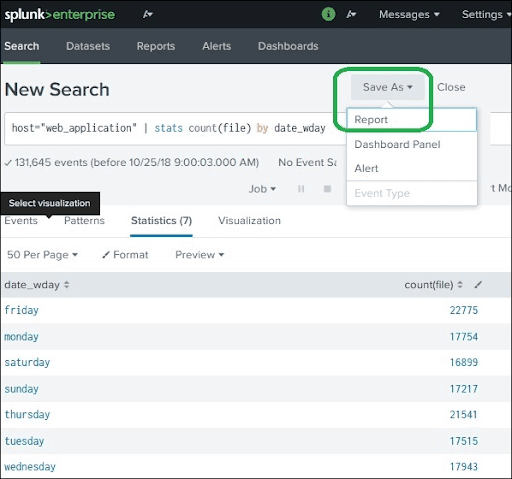
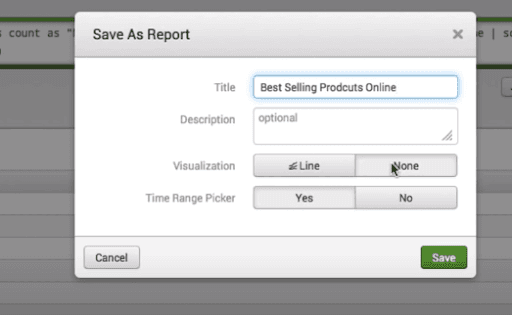
We can create the reports easily, and we use the “save as” option for saving the search operation results. By pressing the report options from the dropdown, we will go to the next window in which we can enter the report details like name and description of the report.
In the following screenshot, we can see the “Report” option.
If we select the time picker, it enables us to set the time range when we execute the report.
In the following screenshot, we can see the “Time Range Picker” Option.
Report Configuration
After saving the report, we will configure the report in the next screen. In the next screen, we configure report scheduling, report permissions. We also have an option to add the reports in the dashboards.
Report Configuration screen:
If we press the “view” option, we can see the report on the screen. After creating the report, we will get the configuration options.
In the below screenshot, we can see the configuration options.
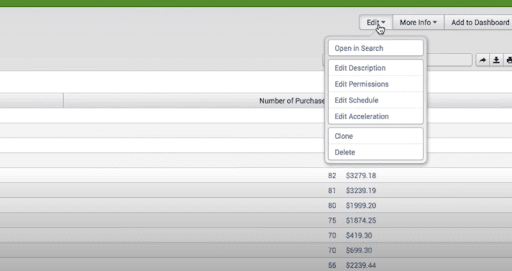
Changing Report Search Option
When we edit the report schedule, permissions, we have to change the initial search string. By using the “Open in Search” option, we can change the initial search string.
Splunk Dashboard
In Splunk, we use dashboards for representing the charts or tables that are related to business meaning. The panels of the dashboard keep the summarised data or chart in a visually attractive manner. We can insert multiple panels, and therefore we can insert multiple charts and reports to the dashboard.
How to Create a Dashboard
For creating the dashboard, first, we select the visualisation tab to see the search result as a pie chart. To place that pie chart on the dashboard, we have to select the option “Save As/Dashboard Panel.”
Pie Chart Dashboard:
After that, on the next screen, we have to fill the details of the dashboard panel.
Dashboard Panel Details:
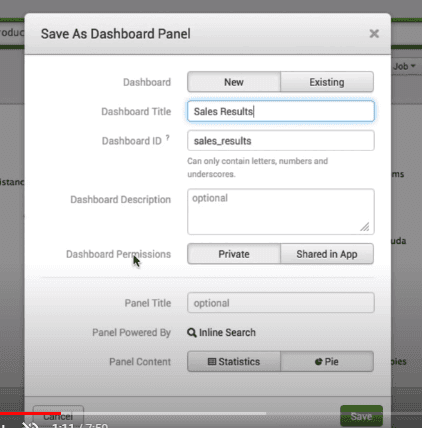
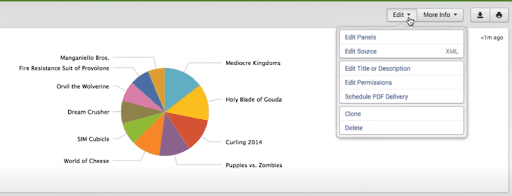
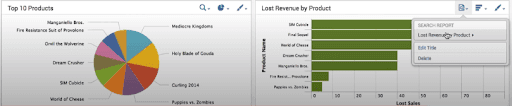
We can save the dashboard by clicking the “save” button. After that, we will get the “view dashboard” option, by selecting that option we can see the dashboard. Along with the dashboard, we can see the options to delete, export and edit the dashboard.
In the following screenshot, we can see the editing and exporting options.
How to add the panel to the dashboard
We can add the second chart to the dashboard by adding the new panel, including the chart. After adding the chart, we fill in the details of the chart and press the “Save” button to save the dashboard. Finally, we will get the dashboard that contains two different charts and panels.
In the below screenshot, we can see the second chart.
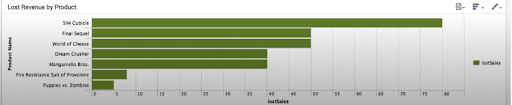
The dashboard contains two charts:
Splunk Datasets
Splunk consumes various kinds of data sources and develops tables that are identical to relational tables. These tables are known as just tables or table datasets. They give easy methods for filtering or analyzing the lookups and data. We also use these tables for creating the pivot analysis.
How to Create a Dataset
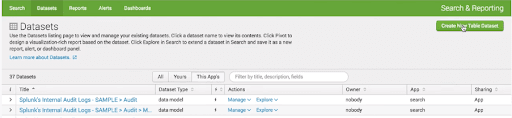
We use Splunk Datasets Add-on for creating and managing the datasets. We can download the Splunk Datasets Add-on
After installing the add-on, we can see the “Create New Table Dataset” button.
How to select a dataset
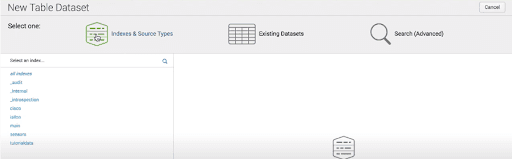
When we click the “Create New Table Dataset” option, it provides the following options:
- Search: By using the result of the search query, we can create a new dataset.
- Indexes and Source Types: Choose the index and source types from the existing source types and Indexes.
- Existing Datasets: By creating a new dataset, we can change the existing datasets.
In the following screenshot, we can see those options.
After clicking “ok” on the above screen, we can choose the fields for our dataset. After selecting the required fields, we will get the dataset.
Splunk Schedules and Alerts
Scheduling is a mechanism of configuring a trigger for running the report automatically without user interference. Following are the reasons for scheduling a report:
- By Running a report at various intervals: daily, weekly or monthly, we get the results for that particular period.
- We can enhance the performance of the dashboard because reports complete running in the background before users open the dashboard.
- We can send the reports automatically through emails after it completes running.
How to Create a Schedule
We can create a schedule by editing the report schedule feature. First, we go to the “Edit Schedule” option that is present in the “Edit” button.
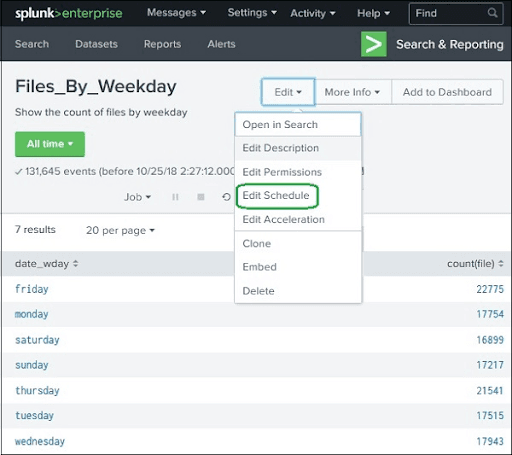
After pressing the edit schedule button, we will get the options to create the schedule.
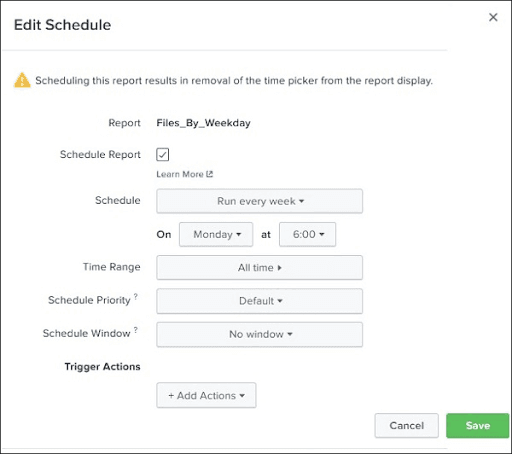
In the following screenshot, we can see the Schedule details. After filling those details, we press the “save” button to save the schedule.
Essential Features of the Scheduling
Following are the essential features of scheduling:
Schedule Priority: If we schedule multiple reports at the same time, then schedule priority will decide the priority of a particular report.
Time Range: It suggests the time range from which report should get the data. The time range can be the last 4 hours or the last 15 minutes.
Schedule Window: When we have multiple report schedules with the same priority, then we have to select a time slot that helps the report for running whenever during the slot.
Splunk Alerts
Alerts are the actions that we trigger when a particular criterion is satisfied that a user defines. The objective of the alerts is logging an action, output a result to the lookup file and sending an email.
How to Create an Alert
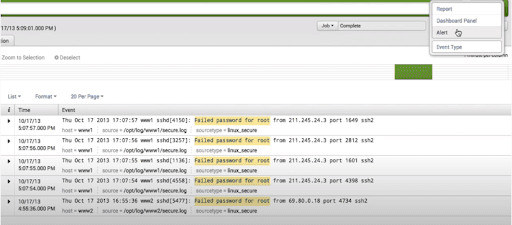
By running the search query, we get a result, and we save that result as an alert.
After creating the alert, we configure the properties of the alert.
In the following screenshot, we can see the details of the alert.
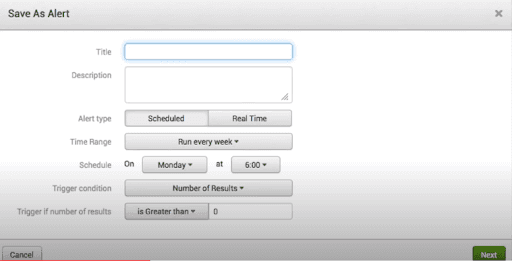
After filling the details, we will save the alert.
Splunk Lookups
Sometimes, the results of a search query may not communicate the field meaning. For instance, we can get the field that catalogues product id value in the form of numeric results. These numbers cannot convey what type of product it is. However, if we catalogue the product Id together with the product name, then it provides us with a good report that makes us understand the meaning of search result.
How to Create and Use a LookUp File
For creating the lookup file in the dataset, we have to implement the following steps:
Create a Lookup File
By using the following details, we will create Lookup. We will save the following details as a lookup file.
After Choosing the Lookups option, we will add Lookup file to the Splunk environment through settings screens as displayed below:
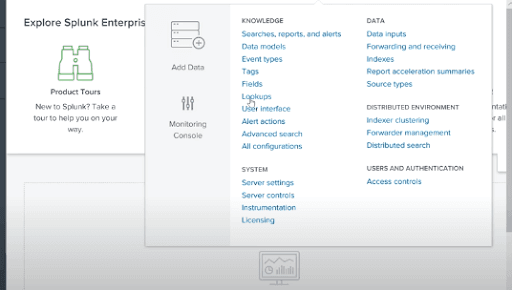
After uploading the Lookup file, we can configure and create.
Lookup configuration and creation screen:
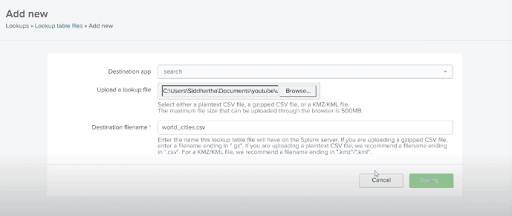
After that, we search the “world_cities.csv” file, and we upload it as our lookup file. The “world_cities.csv” file will be the Destination filename.
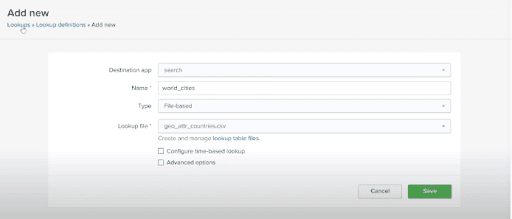
Creating the Lookup definitions
To get the lookup values from the lookup file, we have to create the lookup definition. In the following screenshot, we can see how to create the lookup definition.
Lookup Definition Details:
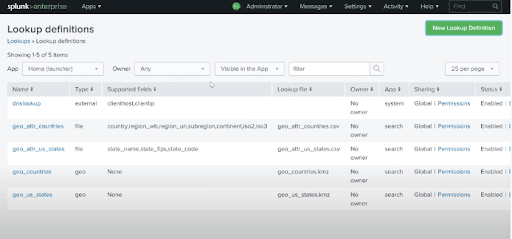
After creating the Lookup definition, we can see it in the following screen:
Splunk Event Types
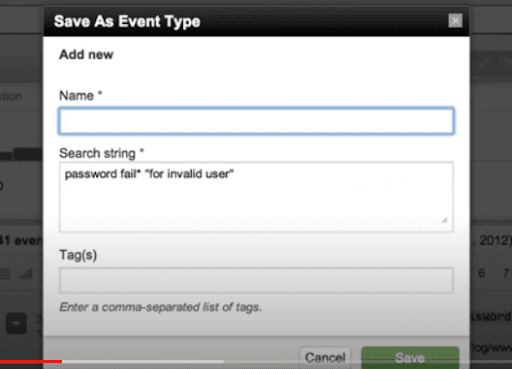
In the Splunk Search, we create our events from the datasets according to a particular criterion. For instance, we search the events that have an http status code “200”. After searching the event, we can save that event as the event type with the “status200” name, and we use this event for future searches.
The event type depicts the search that returns a particular event type or a group of events.
How to Create an Event Type
We have two methods for creating the event type after deciding the search benchmark. One method of creating the event type is to implement a search and after that, save it as the Event Type. Another method is to add the new event type from the settings tab.
Creating the Event Type through Search
Examine the search for event types that have http status 200. After implementing the search query, we select the “Save As” option for saving the query as the event type.
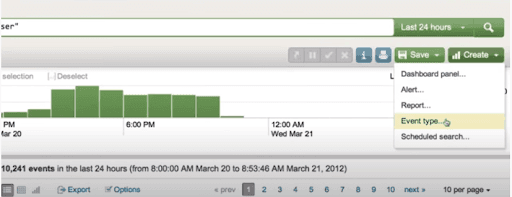
Creating the Event Type through “New Event Type” button
The other method for creating Event Type is using the “New Event Type” button of the settings tab.
Splunk Charts
Splunk Basic Chart
Splunk has amazing visualizations features that display various charts. We create the charts from the search query results where we use suitable functions for providing numerical outputs.
How to Create the Charts
For creating a basic chart, first, we must assure that the data is available in the statistics tab. After that, we press the visualisation tab for getting the respective chart.
Changing the type of chart
We can change the type of the chart by choosing a different chart from the chart names.
Splunk Overlay Charts
Sometimes, we may face situations in which we have to place one chart on another chart for comparing or seeing the trends of those two charts. Splunk endorses this feature by using the chart overlay feature of the visualisation tab. For creating an overlay chart, first, we have to make a chart with two variables and after that, add another variable to make it overlay chart.
Example for Overlay Chart:
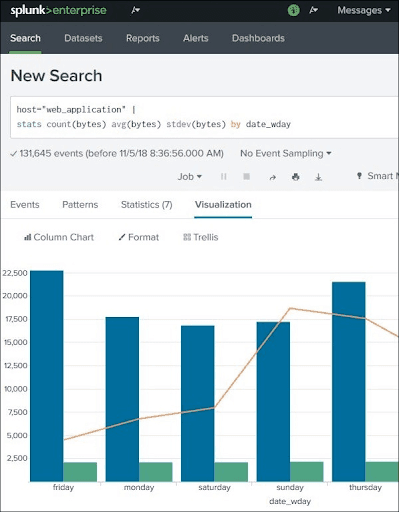
In the above Overlay chart, the three variables are
- count
- avg
- stdev.
Conclusion
Splunk handles and provides insights into the machine data. The machine data is useful in maximizing the performance of the machines. By using the data ingestion, reports and dashboards, Splunk uploads and analyses the machine data. I hope this article provides you with the required information about Splunk.
If you have any queries, let us know by commenting in the below section.
 On-Job Support Service
Online Work Support for your on-job roles.

Our work-support plans provide precise options as per your project tasks. Whether you are a newbie or an experienced professional seeking assistance in completing project tasks, we are here with the following plans to meet your custom needs:
- Pay Per Hour
- Pay Per Week
- Monthly
| Name | Dates | |
|---|---|---|
| Splunk Training | Aug 04 to Aug 19 | View Details |
| Splunk Training | Aug 08 to Aug 23 | View Details |
| Splunk Training | Aug 11 to Aug 26 | View Details |
| Splunk Training | Aug 15 to Aug 30 | View Details |

Viswanath is a passionate content writer of Mindmajix. He has expertise in Trending Domains like Data Science, Artificial Intelligence, Machine Learning, Blockchain, etc. His articles help the learners to get insights about the Domain. You can reach him on Linkedin


