
- Advanced OpenStack Tutorial
- Configuring Account Server - Openstack
- Installing OpenStack Dashboard
- OpenStack Object Storage Tutorial
- OpenStack Interview Questions
- OpenStack Tutorial
- Attaching volumes to an instance – OpenStack
- Automating OpenStack Installations of Opscode Chef Server and Chef Client - OPENSTACK
- Automatically assigning and modifying fixed networks of tenants – OpenStack
- Configuring Object Server - OpenStack
- Configuring OpenStack Compute for Cinder volume - Openstack
- Creating containers - Openstack
- Creating and Deleting a Neutron network – OpenStack
- Creating an external Neutron network – OpenStack
- Creating and Managing Keypairs - OpenStack
- Creating an OpenStack Object Storage sandbox environment
- Creating a sandbox Compute server with VirtualBox and Vagrant - OpenStack
- Creating a sandbox Network server for Neutron with VirtualBox and Vagrant – OpenStack
- How to Create the Service Tenant and Service Users - Openstack
- OpenStack – Detaching volumes from an instance
- Downloading objects In OpenStack
- Configuring OpenStack Keystone user & Role Management - OpenStack
- How to Configure Ubuntu Cloud Archive in OpenStack
- How to Create Sandbox Environment for the OpenStack
- Create Tenant Users and Roles in OpenStack
- Install and Configure Compute Node – OpenStack
- How to Install Compute Controller Services – OpenStack
- Installing and configuring OVS and API server for Neutron - OpenStack
- Installing and setting up Pacemaker and Corosync - Highly Available OpenStack
- Managing Images with OpenStack Image Service
- Manually associating and dissociating floating IPs of instances – OpenStack
- Monitoring Compute services with Munin – OpenStack
- Monitoring OpenStack services with Nagios
- OpenStack Networking
- Registering a remotely stored image – OpenStack Cloud
- OpenStack – Removing nodes from a cluster
- Setting up a Chef Environment for OpenStack
- Troubleshooting OpenStack
- Troubleshooting OpenStack Authentication and Networking
- Troubleshooting OpenStack Compute Services
- Uploading Large Objects In OpenStack
- Using OpenStack Dashboard to Launch and Terminate Instances
- Using OpenStack Object Storage
- Starting OpenStack Block Storage
- Stopping and starting Nova services - Openstack
- Why OpenStack is Popular?
Checking OpenStack Services provides tools to check on its services. In this section, we’ll show you how to check the operational status of these services. We will also use common system commands to check whether our environment is running as expected or not.
To check our OpenStack COMPUTE host, we must log in to that server, so do this now before following the given steps.
OpenStack Services Lists
| In this OpenStack Services Article, you will learn below things |
OpenStack Compute
To check that OpenStack Compute is running the required services, we invoke the nova-manage tool and ask it various questions about the environment, as follows:
Checking OpenStack Computer Services
To check our OpenStack Compute services, issue the following command:
| If you would like to Enrich your career with an OpenStack certified professional, then visit Mindmajix - A Global online training platform: “Openstack Certification Training” Course. This course will help you to achieve excellence in this domain. |
sudo nova-manage service listYou will see an output similar to the following. The indicates that everything is fine.
nova-manage service list
The fields are defined as follows:
- Binary: This is the name of the service that we’re checking the status of.
- Host: This is the name of the server or host where this service is running. With the appropriate permissions, you can select which host instances are launched on and which roles can boot instances on this hos
- Zone: This refers to the OpenStack Zone that is running that service. A zone can run different services. The default zone is called a nova.
- Status: This states whether or not an administrator has enabled or disabled that service.
- State: This refers to whether that’s running service is working or not.
- Updated_At: This indicates when that service was last checked.
If OpenStack Compute has a problem, you will see XXX in place of. The following command shows the same:

nova-compute compute.book nova enabled XXX 2013-06-18 16:47:35If you do see XXX, the answer to the problem will be in the logs at /var/log/nova/.
If you get intermittent XXX and :-) for a service, first, check whether the clocks are in sync.
Openstack Image Service (Glance)
The OpenStack Image Service, Glance, while critical to the ability of OpenStack to provision new instances, does not contain its own tool to check the status of the service. Instead, we rely on some built-in Linux tools. The OpenStack Image Service (Glance) doesn’t have a tool to check its running services, so we can use some system commands instead, as follows:
ps -ef | grep glance
netstat -ant | grep 9292.*LISTEN
These should return process information for Glance to show that it’s running, and 9292 is the default port that should be open in the LISTEN mode on your server, which is ready for use. The output of these commands will be similar to the following:
| Related Article: OpenStack Advanced Interview Questions |
ps -ef | grep glanceThis produces output like the following:

To check if the correct port is in use, issue the following command:
netstat -ant | grep 9292

tcp          0                 0 0.0.0.0:9292                           0.0.0.0:*                                 LISTEN
Other services that you should check
Should Glance be having issues while the above services are in working order, you will want to check the following services as well:
rabbitmq: For rabbitmq, run the following command:
sudo rabbitmqctl statusFor example, output from rabbitmqctl (when everything is running OK) should look similar to the following screenshot
| Related Article: OpenStack Tutorial for Beginners |
.png&w=1920&q=75)
If rabbitmq isn’t working as expected, you will see output similar to the following indicating that the rabbitmq service or node is down:

ntp: For ntp (Network Time Protocol, for keeping nodes in time-sync), run the following command:
ntpq -pntp is required for multi-host OpenStack environments, but it may not be installed by default. Install the ntp package with sudo apt-get install -y ntp)
This should return output regarding contacting NTP servers, for example:

MySQL Database Server: For MySQL Database Server, run the following commands:
PASSWORD=openstack
mysqladmin -uroot –p$PASSWORD status
This will return some statistics about MySQL if it is running, as shown in the following screenshot:

Checking OpenStack Dashboard (Horizon)
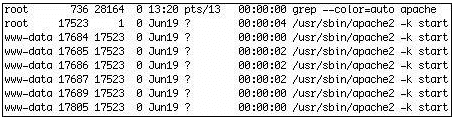
Like the Glance Service, the OpenStack Dashboard service, Horizon, does not come with a built-in tool to check its health. Horizon, despite not having a built-in utility to check service health, does rely on the Apache webserver to serve pages. To check the status of the service, then, we check the health of the web service. To check the health of the Apache web service, log into the server running Horizon and execute the following command:
ps -ef | grep apacheThis command produces output like the following screenshot:
.png&w=16&q=75)
To check that Apache is running on the expected port, TCP Port 80, issue the following command:
netstat -ano | grep :80This command should show the following output:
tcp 0 0 0.0.0.0:80 0.0.0.0:* LISTEN off (0.00/0/0)To test access to the webserver from the command line issues the following command:
telnet localhost 80This command should show the following output:
Trying 127.0.0.1...
Connected to localhost.
The escape character is '^]'.
Checking OpenStack Identity (Keystone)
Keystone comes with a client-side implementation called the python-keystone client. We use this tool to check the status of our Keystone services.
To check that Keystone is running the required services, we invoke the keystone command:
# keystone user-listThis produces output like the following screenshot:

Additionally, you can use the following commands to check the status of Keystone. The following command checks the status of the service:
# ps -ef | grep keystoneThis should show output similar to the following:
keystone 5441 1 0 Jun20 ? 00:00:04 /usr/bin/python /usr/bin/keystone-allNext, you can check that the service is listening on the network. The following command can be used:
netstat -anlp | grep 5000This command should show output like the following:
tcp 0 0 0.0.0.0:5000 0.0.0.0: LISTEN 54421/python
Checking OpenStack Networking (Neutron)
When running the OpenStack Networking service, Neutron, there are a number of services that should be running on various nodes. These are depicted in the following diagram:
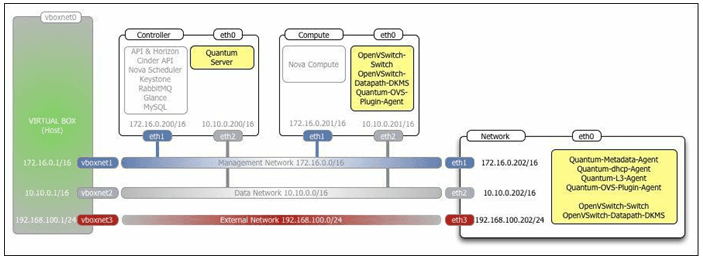
On the Controller node, check that the Quantum Server API service is running on TCP port 9696 as follows:
sudo netstat -anlp | grep 9696The command brings back output like the following:
tcp 0 0 0.0.0.0:9696 0.0.0.0:* LISTEN 22350/python
On the Compute node, check that the following services are running using the ps command:
ovsdb-server
ovs-switchd
quantum-openvswitch-agent
For example, run the following command:
ps -ef | grep ovsdb-serverOn the Network node, check that the following services are running:
ovsdb-server
ovs-switchd
quantum-openvswitch-agent
quantum-dhcp-agent
quantum-l3-agent quantum-
metadata-agent
To check our Neutron agents are running correctly, issue the following command from the Controller host when you have the correct OpenStack credentials sourced into your environment:
quantum agent-listThis will bring back output like the following screenshot when everything is running correctly:

Checking OpenStack Block Storage (CINDER)
To check the status of the OpenStack Block Storage service, Cinder, you can use the following commands:
Use the following command to check if Cinder is running:
ps -ef | grep cinderThis command produces output like the following screenshot:
Use the following command to check if the iSCSI target is listening:
netstat -anp | grep 3260This command produces output like the following:
tcp 0 0 0.0.0.0:3260 0.0.0.0:* LISTEN 10236/tgtdUse the following command to check that the Cinder API is listening on the network:
netstat -an | grep 8776This command produces output like the following:
tcp 0 0.0.0.0:8776 0.0.0.0:* LISTEN
To validate the operation of the Cinder service, if all of the above is functional, you can try to list the volumes Cinder knows about using the following:
cinder list
This produces output like the following:

Checking OpenStack Object Storage (Swift)
The OpenStack Object Storage service, Swift, has a few built-in utilities that allow us to check its health. To do so, log into your Swift node and run the following commands:
Use the following command for checking the Swift Service
Using Swift Stat:
swift stat
This produces output like the following:

Using PS:
Note
There will be a service for each configured container, account, object-store.
ps -ef | grep swiftThis should produce output like the following screenshot:

Use the following command for checking the Swift API:
ps -ef | grep swift-proxyThis should produce the following screenshot:

Use the following command for checking if Swift is listening on the network:
netstat -anlp | grep 8080This should produce output like the following:
tcp 0 0 0.0.0.0:8080 0.0.0.0:* LISTEN 9818/pythonWe have used some basic commands that communicate with OpenStack services to show that they’re running. This elementary level of checking helps with troubleshooting our OpenStack environment better.
 On-Job Support Service
Online Work Support for your on-job roles.

Our work-support plans provide precise options as per your project tasks. Whether you are a newbie or an experienced professional seeking assistance in completing project tasks, we are here with the following plans to meet your custom needs:
- Pay Per Hour
- Pay Per Week
- Monthly
| Name | Dates | |
|---|---|---|
| OpenStack Training | Jul 25 to Aug 09 | View Details |
| OpenStack Training | Jul 28 to Aug 12 | View Details |
| OpenStack Training | Aug 01 to Aug 16 | View Details |
| OpenStack Training | Aug 04 to Aug 19 | View Details |

Ravindra Savaram is a Technical Lead at Mindmajix.com. His passion lies in writing articles on the most popular IT platforms including Machine learning, DevOps, Data Science, Artificial Intelligence, RPA, Deep Learning, and so on. You can stay up to date on all these technologies by following him on LinkedIn and Twitter.


