- Django Interview Questions
- Python Array Examples
- Python enum
- Python Enumerate with Example
- Python Flask Tutorial For Beginners
- Python For Beginners - Way To Success
- Python For Data Science Tutorial For Beginners
- Python for loop
- Python GET and POST Requests
- Python IDEs for Python Programmers
- Python Interview Questions
- Python Lists with Examples
- Python Partial Function Using Functools
- Python Print
- How to generate random numbers in python
- Python Regular Expression (RegEx) Cheatsheet
- Python Sleep Method
- Python List Methods
- Python Split Method with Example
- Python String Functions
- Python Tutorial
- Python Variable Types
- Python vs Java
- Python vs SAS vs R
- Python Operators
- Code Introspection in Python
- Comprehensions in Python
- Python Exception Handling
- Defining Functions - Python
- Generators & Iterators in python
- Install Python on Windows and Linux
- Introduction to Python Programming
- Lists concepts in Python
- Loops in Python
- Regular Expression Operations in Python
- Python Serialization
- String Formatting - Python
- R vs Python: Which is better R or Python?
- Six Digit Salary With Python
- Top 20 Python Frameworks List
- Why Learn Python
- Python Substring
- OOPs Interview Questions
- Career Shift To Python : Success Guaranteed
- Face Recognition with Python
- Go vs Python
- Pyspark Interview Questions
- Python Pandas Interview Questions
- OpenCV Interview Questions
- Python Project Ideas
- Flask Interview Questions and Answers
- Array Interview Questions
- What is PyCharm?
- What is Seaborn in Python?
- What is Anaconda Navigator
- Numpy Broadcasting - Detailed Explanation
- Genpact Interview Questions
- Python Developer Job Description
- Pandas Projects and Use Cases
- DataFrame Tutorial
- How to install Python on Windows
- Pyspark DataFrame
Data Science is one of the most sought-after and pursued fields today. With the market growing by leaps and bounds, there is a high demand for talented data scientists who can assist businesses in gaining valuable insights. Having expertise with at least one programming language is a minimum to step into this field. Python is an excellent skill needed for a data scientist career.
In this blog, we'll look at all the topics that come under Python Data Science to make you interview-ready. All these interview questions are collected after consulting with MindMajix's Python Data Science certification training experts.
For your better understanding, we have segregated the questions in the following manner.
Top 10 Frequently Asked Python Data Science Interview Questions
1. What are built-in data types in Python?
2. How to find duplicate values in a dataset?
3. What is list comprehension in Python?
4. What is the difference between range, xrange, and range?
6. What are the deep learning frameworks?
7. How to add titles to subplots in Matplotlib?
8. What are the different parts of a plot in matplotlib?
9. What is the difference between remove(),del(), and pop() in python?
10. What is the bias/variance trade-off?
Basic Python Data Science Interview Questions
1. What are built-in data types in Python?
Python data types define the variable type. Here are a few built-in data types in Python:
Numeric (int, float, and complex)
String (str)
Sequence (list, tuple, range)
Binary (bytes, byte array, memory view)
Set (set)
Boolean (bool)
Mapping (dict)
| If you want to enrich your career in Google, then visit Mindmajix - a global online training platform: Python Data Science Training This course will help you to achieve excellence in this domain. |
2. Which Python libraries are used for data analysis?
The reason for Python's popularity is its extensive collection of libraries. These libraries include various functionalities and tools to analyze and manage data. The popular Python libraries for data science are:
- TensorFlow
- SciPy
- NumPy
- Pandas
- Matplotlib
- Keras
- Scikit-learn
- PyTorch
- Scrapy
- BeautifulSoup
3. What is negative Indexing in Python?
Negative Indexing is used in Python to begin slicing from the end of the string i.e., the last. Slicing in Python gets a sub-string from a string. The slicing range is set as parameters, i.e., start, stop, and step.
Slicing in Python gets a substring from a string. In Python, negative Indexing begins slicing from the string's end, the last. The parameters of slicing include start, stop, and step.
Let's see the syntax.
#slicing from index start to index stop-1
arr[start:stop]

# slicing from index start to the end
arr[start:]

# slicing from the beginning to index stop - 1
arr[:stop]

# slicing from the index start to index stop, by skipping step
arr[start:stop:step]
4. What is dictionary comprehension in Python?
In Python, dictionary comprehension allows us to create a dictionary in one way by merging two sets of data, either lists or arrays.
E.g.
rollNumbers =[10, 11, 12, 13]

names = [max, 'bob', 'sam', 'don']

NewDictionary={ i:j for (i,j) in zip (rollNumbers,names)}

The output is {(10, 'max'), (11, 'bob'), (12, 'sam'), (13, 'don')
5. How would you sort a dictionary in Python?
- Dictionary.keys(): This returns keys in an arbitrary order.
- Dictionary.values(): This returns a list of values.
- Dictionary.items(): This returns all data as a list of key-value pairs.
- Sorted(): This method takes one mandatory and two optional arguments.
[ Related Articles: Python For Data Science Tutorial For Beginners ]
6. What is the difference between lists and tuples in Python?
The below table illustrates the differences between Python lists and Python tuples:
|
Lists |
Tuples |
|
Lists are mutable. |
Tuples are immutable. |
|
Lists include several built-in methods. |
Tuples don’t have any built-in methods because of immutability. |
|
Memory consumption is more in lists. |
Consumes less memory compared to lists. |
|
Insertion and deletion are easier in lists. |
Accessing elements is easier with the tuple data type. |
|
Iterations are time-consuming. |
Iterations are comparatively faster. |
7. Which library is better, Seaborn or Matplotlib?
One thing to note is that Seaborn is built on top of Matplotlib. Both Seaborn and Matplotlib act as a backbone for data visualization in Python. Here are a few things to know before deciding on seaborn or Matplotlib:
- Matplotlib is better for basic plotting, while seaborn is better for advanced plotting.
- Matplot supports interactive plotting from within Python, while seaborn does not.
- Matplotlib has a lower learning curve compared to seaborn.
- Seaborn allows regression model visualization, while Matplotlib does not.
- Matplotlib supports interactive plotting, while seaborn doesn't.
- Seaborn provides better documentation than Matplotlib.
- Matplotlib provides an extensive set of library functions than seaborn.
Note: This question asks about your preferences. The library you choose might depend on the task or your familiarity with the tool.
8. What is the difference between a series and a DataFrame in Pandas?
Series can only contain a single list with an index, whereas a DataFrame contains more than one series.
A series is a one-dimensional array that supports any datatype, including integers, float, strings, etc. In contrast, a dataframe is a two-dimensional data structure with columns that can support different data types.
9. How to find duplicate values in a dataset?
The Pandas duplicated() method is used in Python to find and remove duplicate values. It helps analyze duplicate values and returns a True Boolean series for unique elements.
Syntax:
DataFrame.duplicated(subset=None,keep='last')Keep - Controls how to consider duplicate values.
First - Consider the first value as unique and the rest as duplicates.
Last - Consider the last value as unique and the rest as duplicates.
False - Considers all of the same values as duplicates.

10. What is the lambda function in Python?
Lambda functions are similar to user-defined functions but don't have any names. They are anonymous functions. They are effective only when you want to create a function with simple expressions. It means single-line statements.
They are mostly preferred while using functions at once.
You can define a lambda function like the one below:
lambda argument(s) : expression
Lambda: It's a keyword to define an anonymous function.
Argument: It's a placeholder that holds the value of the variable you want to pass into the function expression. A lambda function can have multiple variables depending on the requirement.
Expression: It's the code you want to execute.
11. Is memory deallocated when you exit Python?
The answer is no. The modules with references to other objects are only sometimes freed on exiting Python. Also, it's impossible to deallocate the memory portions reserved by the C library.
12. What is a compound datatype?
Python provides several compound data types to process data in groups. Some of the common are
- Lists - A group of elements where the order is essential.
- Tuples - A series of values where the order is critical.
- Sets - A set of values where membership in the group is important.
- Dictionaries - A particular set of keys with a value associated with each key.
[ Learn Top Data Science Interview Questions that help you grab high-paying jobs
13. What is list comprehension in Python?
Python list comprehension defines and creates new lists based on the values of existing values.
It contains brackets to have the expression executed for each element and the for loop to iterate over each element. The benefit of list comprehension is it's more time efficient and space-efficient than loops.
Syntax:
newList = [ expression(element) for element in oldList if condition ]Let's see an example,
Based on the list of fruits, you want a new list containing only the fruits with the letter "a" in the name.
fruits = ["apple", "orange", "goa", "kiwi", "carrot"]

newlist = [x for x in fruits if "a" in x]

print(newlist)
Output:
['apple', ‘orange’, ‘goa’, ‘carrot’]14. Explain tuple unpacking.
Unpacking a tuple means splitting the elements of the tuple into individual variables.
For example,
fruits = ("apple", "banana", "cherry")

(green, yellow, red) = fruits

print(green)
print(yellow)
print(red)
Output:
apple
banana
cherry
15. What's the difference between / and // in Python?
Python has two division operators, namely / and //.
A single-slash operator does float division and returns the value in decimal form.
A double-slash operator does the floor division and returns the value in natural number form.
For example,
11 / 2 returns 5.5
11 // 2 returns 5
16. How do you convert integers to strings?
Python's built-in str() function is the most popular method for converting an integer to a string. You may use numerous ways to accomplish this, but this function will convert any data type into a string.
17. What is the difference between a library and a module?
Python modules are collections of related code packed together in a program. It's a single file containing functions, classes, or variables designed to perform specific tasks. It's a .py extension file. Popular built-in Python modules include sys, os, random, math, etc.
Python libraries are a collection of modules or packages. It allows us to do specific tasks without having to write code. It doesn't have any particular context. Popular built-in Python libraries include Pytorch, Pygame, Matplotlib, and more.
18. What is PEP8?
PEP stands for Python Enhancement Proposal. PEP8 is a document that provides a set of guidelines and practices on how to write Python code. Its primary focus is to improve the readability and consistency of the Python code.
19. What are mutable and immutable objects in Python?
In Python, every variable holds an instance of objects. There are two types of objects, i.e., Mutable and Immutable objects.
- When an object is susceptible to internal change or can change its values after creation is known as a mutable object.
E.g., Lists, Dicts, Sets
- Similarly, when the objects are not susceptible to internal change or can not be modified once they are created are immutable objects.
E.g., Int, Float, Bool
20. What are generators and decorators in Python?
A generator in Python is a special function that can control the iteration behavior of the loop. A decorator allows us to modify the functionality of existing code.
Intermediate Python Data Science Interview Questions
21. What is the zip() and enumerate() function in Python?
The enumerate() function returns indexes of all time in iterables. An iterable is a collection of lists, sets, and dictionaries.
Whereas the zip() function aggregates the multiple iterables.
22. How do map, reduce, and filter functions work?
- The map function applies the supplied function on each iterable and then returns a new, updated list. It assigns the same function to every item of a sequence.
- The reduce function performs the same operation on each item in a sequence. It returns an item rather than a list. The result of one operation serves as the initial parameter for the next.
- The filter function eliminates a portion of a sequence. It filters the iterable (list, set, or tuple) that is provided and tests each element to determine whether it is true or false using a different function sent as an argument.
23. What is the difference between del(), clear(), remove(), and pop()?
- del(): Deletes the with respect to the value's position. Which value was deleted is not returned. It also changes the index to the right by decreasing it by one value. It could also be used to delete the complete data structure.
- clear(): Clears the list.
- remove(): Since it deletes in relation to the value, you can use it if you know which particular value to remove.
- pop(): By default, delete the last element and return the deleted value. It is frequently employed for creating referencing.
24. What is the difference between range, xrange, and range?
- range(): It's a function of BASE Python and returns a list object.
- xrange(): Returns a range object.
- arange(): It's a function in the Numpy library and can return fractional values.
25. What is the difference between pass, continue, and break?
Break: The break statement allows terminating the loop. If it is used inside the nested loop, the current loop gets terminated, and flow continues for the following code after the loop.
The below flowchart illustrates the break statement working:

Continue:
This statement skips the code that comes after it, and the flow control is passed back to the beginning for the next iteration.
The below flowchart illustrates the working of the continue statement:

Pass:
This statement acts as a placeholder inside the functions, classes, loops, etc., that are meant to be implemented later. The Python pass statement is a null statement.
26. What is Regex?
A RegEx or regular expression is a series of characters that are used to form search patterns.
Some of the important RegEx functions in Python:
|
Function |
Description |
|
findall |
It returns a list that contain all matches. |
|
search |
If there is any match in the string, returns Match Object. |
|
sub |
It replaces one or more matches with a string. |
|
split |
It returns a list where the string has been split at each match. |
[ Visit here to know: Python Regular Expression (RegEx) Cheatsheet ]
27. What are namespaces in Python?
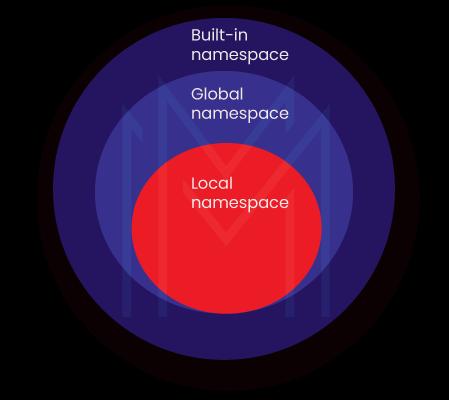
A namespace is a naming mechanism to ensure each item has a unique name. There appears to be space assigned to every variable mapped to the object. As a result, the specified area or container and the corresponding object are looked for whenever we call out this variable. Python maintains a dictionary for this.
Types of namespaces in Python:
The built-in namespace includes the global namespace, and the global namespace consists of the local namespace.
28. What do *args, **kwargs mean?
In Python, we use special symbols for passing arguments:
- *args (Non-Keyword Arguments)
- **kwargs (Keyword Arguments)
*args (Non-Keyword Arguments):
This is to pass a variable number of arguments to a function.
**kwargs (Keyword Arguments):
This is to pass a keyworded, variable-length argument list. We use kwargs with double stars because it enables us to pass through keyword arguments.
29. What is the difference between 'is' and '=='?
- ‘==’ is for value equality. It represents when two objects have the same value.
- 'is' is for reference equality. It represents when two references refer (or point) to the same object, i.e., if they're identical. If two objects consider the same memory address, they are similar.
30. Does Python have default values?
In Python, a default parameter is a fallback value in the default argument. The argument gets its default value if the function is called without the argument.
We can set the default value by using the assignment(=) operator and the syntax keywordname=value.
31. Explain run time errors in Python.
A runtime error is a type of error that happens during the execution of the program. Some of the common examples of runtime errors in Python are
- Division by zero.
- Using an undefined variable or function name.
- Executing an operation on incompatible types.
- Accessing a list element, object attribute, or dictionary key that does not exist.
- Accessing a file that does not exist.
32. What are the commonly used Python libraries for data science?
The widely used libraries for data science are
- NumPy
- Pandas
- Matplotlib
- Scipy
- Scikit-learn
[ Related page: Data Science Tutorial ]
33. How do you generate a sorted vector from two sorted vectors?
First, create a new array by combining the sizes of the first and second arrays. Then create a function that simultaneously checks array 1 and array 2, determines which of the two arrays contains the smaller integer, and adds that value to the new array.
34. What is the difference between long and wide data formats?
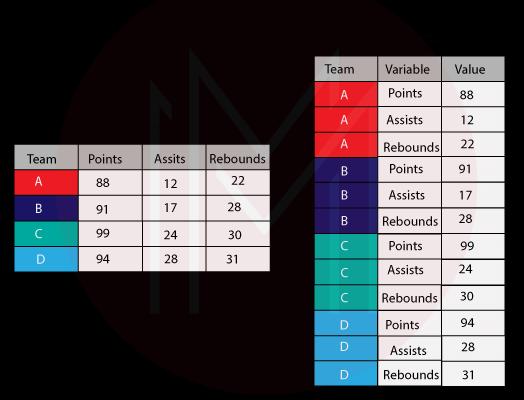
A dataset can be of two types - wide and long.
A wide format contains information that does not repeat in the first column. In contrast, a long format includes the information that repeats in the first column.
For example, consider two datasets that contain the same information expressed in different formats:
35. How to import a CSV file from a Pandas library URL?
Import pandas as pd
Data = pd.read_CV('sample_url')
36. What are universal functions for n-dimensional arrays?
A universal function executes mathematical operations on each element of the n-dimensional array.
Examples include np.exp() and np.sqrt(), which evaluate the exponential of each element and the square root of an array.
37. What are the deep learning frameworks?
Deep learning frameworks act as the interface for quickly creating deep learning models without digging too deeply into the complex algorithms. Some popular deep learning frameworks are
- TensorFlow
- Keras
- Pytorch
- Theano
- Apache MXNet
- DL4j
38. List a few methods of NumPy array.
- np.means()
- np.cumsum()
- np.sum(),
39. What is the difference between series and vectors?
- Vectors: It can only assign values for index position as 0,1,…, (n-1).
- Series: It only has one column. Series can be created from the array, list, and dictionaries. For every data series, it can assign unique index position values.
40. How to reshape Pandas DataFrame?
There are three ways of reshaping the Pandas DataFrame:
- stack(): This function puts columns one above the other to create a stacked representation of the data.
- Unstack(): This function is the reverse of the stack. Using this function, the row is unstacked to the columns.
- melt(): This method organizes the data frame into a format where one or more columns are identifier variables.
Advanced Python Data Science Interview Questions
41. What is the difference between duplicated and drop_duplicates?
Duplicates identify whether the records are duplicates or not. It results in True or False. Whereas, Drop-duplicates puts duplicates by a column name.
42. What are categorical distribution plots?
There are two categorical distribution plots - box plots and violin plots.
These allow us to choose a numerical variable and plot the distribution for each category in a designated categorical variable.
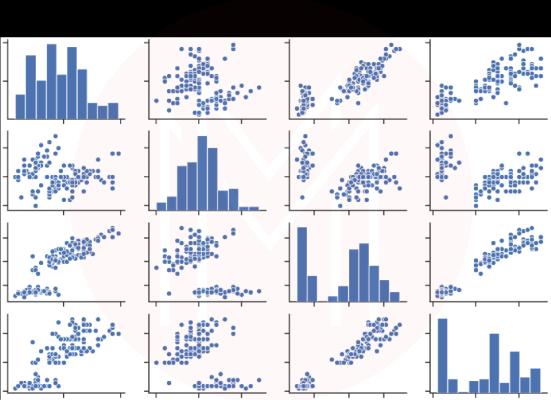
43. What is a Pairplot?
The Pairplot function allows us to plot pairwise relationships between variables in a dataset.
44. How to add titles to subplots in Matplotlib?
fig, axarr = plt.subplots(2, sharex=True, sharey=True)
axarr[0].plot(x, y)
axarr[0].set_title('Subplot 1')
axarr[1].scatter(x, y)
axarr[1].set_title('Subplot 2')
45. What is broadcasting in NumPy?
The ability of NumPy to handle arrays of various shapes during arithmetic operations is referred to as broadcasting. Element-to-element operations are impossible if the dimensions of two arrays are different.
However, it is still possible to perform operations on arrays with various shape types because of NumPy's broadcasting functionality. NumPy's broadcasting rule removes this limitation when the arrays' shapes satisfy specific conditions. For the smaller array and the larger array to have similar shapes, they are broadcasted to the same size.
[ Visit here to know about: Top Data Science Tools ]
46. What is the difference between pivot_table and groupby in pandas?
Both pivot_table and groupby are used to aggregate the dataframe. The only difference is the resulting shape.
47. What are the different parts of a plot in matplotlib?
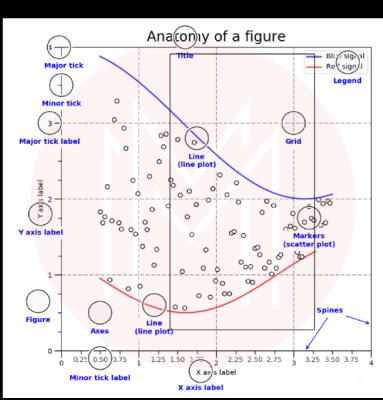
A Matplotlib consists of the following:
- Figure
The figure keeps track of all the child axes, canvas, and special artists (titles, figure legends, etc.).
- Axes
There are two Axis objects in the Axes that manage the data limits.
- Axis
These are the objects that have a number line-like design. They are in response to making the axis markings, known as ticks and ticklabels, and setting the boundaries of the graph (strings labeling the ticks). While a Formatter object produces the tick label strings, a Locator object decides where the ticks should be placed. When the appropriate Locator and Formatter are used together, you can adjust the labels and locations of the ticks precisely.
- Artist
The artist produced everything you see in the figure (even the Figure, Axes, and Axis objects). This includes text objects, line2d objects, collection objects, and patch objects. All the artists are drawn to the canvas when the figure is created. Most artists are linked to one axe, unable to be shared or moved between axes.
48. n Matplotlib, what are Subplots?
Grid-like plots within a single figure are called subplots. The subplots() function in the matplotlib.pyplot module can be used to plot subplots.
49. What is the difference between remove(),del(), and pop() in python?
- remove(): This removes the first matching value in a given list.
E.g.,
a = [0, 2, 3, 2]
a.remove(2)
a
Output:
[0, 3, 2]- del(): This removes the item at a specific index.
E.g.,
a = [3, 2, 2, 1]
del a[3]
a
Output:
[3, 2, 2]- pop(): This removes the item at a specific index and returns it.
E.g.,
a = [4, 3, 5]
a.pop(1)
a
Output:
[4, 5]50. What is the difference between list.append() and list.extend()?
- The append() function inserts its input as a single element at the end of a list. The list's length will increase by one.
- The extend() function extends the list by iterating through its arguments and adding each element to the list. The list's length will increase depending on how many elements were included in the iterable argument.
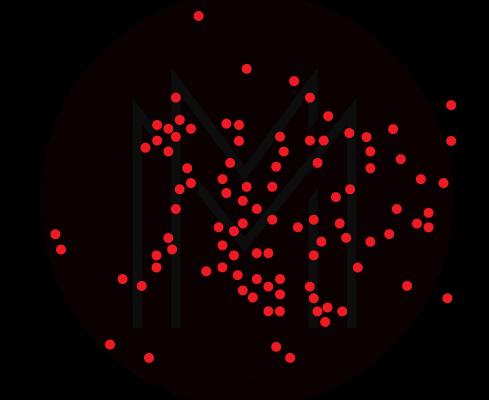
51. What is a Scatter plot?
A scatter plot is a two-dimensional data visualization showing how two variables relate to one another. The first is plotted against the x-axis, while the second is plotted along the y-axis.
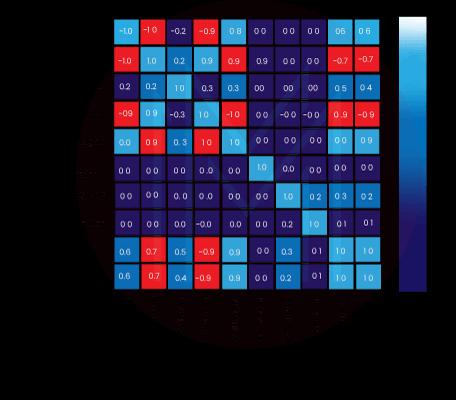
52. What is a heat map?
A heatmap is a two-dimensional graphic representation of data that uses a matrix to hold individual values. The values, represented by different shades of the same color, display the correlation values. Darker shades represent higher correlations between the variables, while lighter shades represent lower correlations.
53. How to find the median value?
You can find the median of the 'points' column from the 'reviews' dataframe
reviews[‘points’].median()
[ Also Read: What is Data Visualization? ]
54. How to apply functions after grouping on a particular variable?
You can find the min and max of 'price' for different 'variety' column from 'reviews' dataframe
reviews.groupby(‘variety’).[‘price’].agg([min, max])
55. How to plot a line chart and bar chart?
import seaborn as sns
sns.lineplot(data=loan_amnt)
sns.barplot(x=cr_data[‘cb_person_default_on_file’], y=cr_data[‘loan_int_rate’])

56. How to add x-label and y-label to the chart?
import matplotlib.pyplot as plt
plt.xlabel(“cred_hist_length”)
plt.ylabel(“loan_amnt”)
57. How to add a title to the chart?
import matplotlib.pyplot as plt
plt.title(“Average int_rate”)
58. How to add a legend to the chart?
import matplotlib.pyplot as plt
plt.legend()
59. How to identify missing values?
through .isnull() helps in identifying the missing values.
The code below gives the total number of missing data points in the data frame
missing_values_count = sf_permits.isnull().sum()
60. How do you treat dates in Python?
To convert dates from String to Date
import datetime
import pandas as pd
df[‘Date_parsed’] = pd.to_datetime(df[‘Date’], format=”%m/%d/%Y”)
61. What is logistic regression?
It's a machine-learning algorithm used for classification. It estimates the probability of the possible outcomes of a single trial.
62. What is SVM?
Support vector machines represent training data as a collection of points in space segmented into groups by a clear, as wide-spaced gap as possible. New samples are then projected into that area and expected to fall into a category depending on which side of the gap they fall.
[ Grace your interview by having these Python Interview Questions ]
63. What is the bias/variance trade-off?
The Bias Variance Trade-offs are important in supervised machine learning, particularly in predictive modeling. One can assess the method's performance by analyzing an algorithm's prediction error.
Error from Bias
- The bias in your model is the difference between its anticipated results and actual values.
- This is known as under-fitting.
Error from variance:
- The phrase "variance" describes how sensitive a specific set of training data is to your algorithm.
- This situation is over-fitting.
64. Write a function to create N samples from a normal distribution and plot them on the histogram.
This fairly simple Python problem consists of setting up a distribution, creating n samples, and displaying them. We can do this using the SciPy scientific computing library.
Create a normal distribution with a mean of 0 and a standard deviation of 1 initially. The rvs(n) function is then used to build samples.
65. In NumPy, compute the inverse of a matrix.
The numpy.linalg.inv(array) function allows you to find the inverse of any square matrix. The 'array', in this case, would be the matrix that needs to be inverted.
66. For an array filled with random values, write a rotate_matrix function which will rotate a list of random values 90 degrees in the clockwise direction.
This problem can be resolved in two ways. The first step is to establish exactly how each matrix entry's index changes with a 90° clockwise rotation. The second method involves visualizing a series of more effortless matrix transformations that, when applied one after the other, produce a 90-degree rotation clockwise.
67. Find the position of the letter "a" in the employee's first name, Amitah. Use 1-based indexing; for instance, the second letter would be in position 2.
You can do it in two ways. The worker "Amitah" is first filtered using the operator "==" The second one locates the letter "a" in a string by using the find() function.
68. Using a dataset of test scores, write Pandas code that returns cumulative bucketed scores of <50, <75, <90, <100.
def bucket_test_scores(df):
bins = [0, 50, 75, 90, 100]
labels=['<50','<75','<90' , '<100']
df['test score'] = pd.cut(df['test score'], bins,labels=labels)
Tips to clear Python Data Science Interview:
Following are a few preparation tips for Python Data Science Interviews:
- Resume Building:
First, prepare your resume well. Your resume should list at least 2-3 Python data science projects to show your knowledge and skill in the area.
- Research the Company:
If you are going to interview, do your research about the company first. In the case of Python data science, be aware of the libraries the company uses, the models they are building, and other information.
- Prepare Well:
Your fundamentals should be solid enough to handle the interviewer's coding challenge. Attempt mock tests and quizzes, and learn every detail while coding.
- Data structures and Algorithms:
They are the fundamental pillars of programming. Therefore, you must be well-versed in that as well.
- Know the basics of other technologies.
Pay attention to the basics of other technologies like JavaScript, CSS, etc. This demonstrates your willingness and ability to pick up new skills that will benefit the company to which you are applying.
Most Commonly Asked FAQs
1. What are built-in data types used in Python?
There are various built-in data types in Python, such as
- Numeric data types
- String data types
- Sequence types
- Binary types
- Mapping data type
- Boolean type
- Set data types
2. How are data analysis libraries used in Python?
Data analysis is a process that provides information to make business decisions. Steps in the process include data cleansing, transformation, and modeling. Data analysis libraries like Pandas, Numpy, etc., give users the necessary functionality in Python.
3. How is a negative index used in Python?
Python uses negative indexing to begin slicing from the final position in the string or the end.
4. What is the difference between lists and tuples in Python?
The major difference is tuples cannot be modified, whereas lists are modified.
5. What library would you prefer for plotting, Seaborn or Matplotlib?
Matplotlib is better for basic plots, while seaborn is better for more advanced statistical plots.
6. Which coding is best for data science?
Python is one of the most preferred coding languages in data science because of its versatility and the number of data science libraries available.
7. Should I learn Python or data science first?
It is essential to master Python before learning data science. Otherwise, you may need help implementing well-known libraries and working with scalable code that other engineers can contribute to.
Conclusion
Python Data Science professionals have lucrative careers and many job opportunities. These Python Data Science interview questions can help you get one step closer to your dream job.
If you have attended Python Data Science interviews or have any questions you would like to get answered, please share them in the comments section. We'll respond to you at the earliest.
 On-Job Support Service
Online Work Support for your on-job roles.

Our work-support plans provide precise options as per your project tasks. Whether you are a newbie or an experienced professional seeking assistance in completing project tasks, we are here with the following plans to meet your custom needs:
- Pay Per Hour
- Pay Per Week
- Monthly
| Name | Dates | |
|---|---|---|
| Data Science With Python Training | Feb 21 to Mar 08 | View Details |
| Data Science With Python Training | Feb 24 to Mar 11 | View Details |
| Data Science With Python Training | Feb 28 to Mar 15 | View Details |
| Data Science With Python Training | Mar 03 to Mar 18 | View Details |

Madhuri is a Senior Content Creator at MindMajix. She has written about a range of different topics on various technologies, which include, Splunk, Tensorflow, Selenium, and CEH. She spends most of her time researching on technology, and startups. Connect with her via LinkedIn and Twitter .


