- Home
- Blog
- Salesforce
- How to create dashboard in Salesforce

- Apex Class in Salesforce
- Approval Process In Salesforce
- Step By Step Guide to Becoming a Certified Salesforce Developer
- Bulkification in Salesforce
- Code Coverage In Salesforce
- Context Variables In Salesforce
- Controller Extension in Salesforce
- Controlling the program flow in Salesforce
- How To Create Data Modeling In Salesforce?
- Custom Controller in Salesforce
- Custom Reports In Salesforce
- DML Operations In Salesforce
- Top 10 Features of Salesforce Lightning
- Governor Limits in Salesforce
- How Salesforce Certification Can Boost Your Career?
- Salesforce Lookup Relationship
- Master-detail Relationship in Salesforce
- User Management And Object Level Security In Salesforce
- Price Book in Salesforce CPQ
- Product Bundle in Salesforce CPQ
- Quote Line Editor In Salesforce CPQ
- Why Learn Salesforce?
- Record Level Security In Salesforce
- Report Building in Salesforce
- Salesforce Automation Testing With Selenium
- Salesforce Collection of Map
- Salesforce Collection of Set
- Salesforce CPQ Implementation Guide
- Salesforce CPQ Tutorial
- Salesforce Developer Certification, Jobs And Salary Trends
- An Overview of Salesforce Development Environment
- Salesforce Interview Questions
- Salesforce Lightning Interview Questions
- Salesforce Lightning Tutorial
- Salesforce Enhances Its Marketing Cloud With AI And Google Partnership
- Salesforce Job Roles And Certifications
- Salesforce Tutorial
- Salesforce vs ServiceNow
- Salesforce Vs Siebel CRM'S
- Access Specifiers in SalesForce Cloud Computing - Salesforce
- An Introduction to Exception Handling – SalesForce
- An Introduction to Visualforce – SalesForce
- An Overview of Salesforce Security
- Annotation in SalesForce
- Classes, Inheritance and Overriding in SalesForce
- Configuring Salesforce Web-To-Lead Form
- Creating Visualforce Page using AJAX Programming - Salesforce
- How to Create Field Dependence in SalesForce
- How to Create Sample Apex Trigger in SalesForce
- How to Define Validation Rules in SalesForce
- Object Relationships Overview – SalesForce
- SalesForce Integration and Environment in Cloud Computing
- SalesForce Deployment and Assertions
- Shallow copy and Deep Copy in Cloud Computing - Salesforce
- Security and Audit Trail in Salesforce
- Salesforce SOQL
- SOSL Of Salesforce
- Standard Controller In Salesforce
- Test Class in Salesforce With Example
- Testing APEX In Salesforce
- Time Dependent Workflow Rule - Action
- Trigger Scenarios in Salesforce
- What is CRM? - A Complete Beginners Tutorial
- What is Salesforce Administrator?
- What is Salesforce CRM?
- Why You Should Learn Salesforce Skills
- Workflow Rules In Salesforce
- Configuring Tasks in Workflow Rules
- How to call APEX Class
- Context Variables
- Configuring Email alert in Workflow Rules
- Salesforce Web Services
- Salesforce Vlocity Interview Questions
- Salesforce CPQ Interview Questions
- Visualforce Interview Questions
- Salesforce Tools
- Salesforce Integration Interview Questions
- Custom Settings in Salesforce
- What is Salesforce Database?
- Salesforce Data Loader
- Salesforce Platform Events
- What is Salesforce Marketing Cloud - Definitive Guide
- Bucket Field In Salesforce - Bucket Column Salesforce
- What is Junction Object In Salesforce?
- Sharing Rules in Salesforce
- What is Salesforce Architecture?
- Salesforce Projects and Use Cases
- Salesforce Marketing Cloud Integration
- Microsoft Dynamics VS Salesforce
- Salesforce Admin Projects and Use Cases
Introduction to Salesforce Dashboards
Extensive Dashboards allows you to render decisions and take measures. Sometimes if you require to view in-details in brief, particularly according to the end-users and devices used, go to the dashboard, your service for outlining and exhibiting the salesforce data in a pictorial form. The dashboard of salesforce enables you to provide different adjacent reports through dashboard elements present on the dashboard page menu. Through dashboard elements, you can personalize how data is classified, outlined and exhibited for every element.
Features of Salesforce Dashboard
1. Dashboard Editor
It is a visible drag and drops tool mechanism which is used to create new dashboards and modify the available dashboards. It is the place where we can arrange, insert and edit the elements of the dashboard. To initiate a new dashboard, select “New Dashboard”.
Want to enhance your skills in dealing with the worlds best CRM, enroll in our Salesforce Training
2. Components
The dashboard consists of several components, and every component comprises a metric or chart that displays data from a particular report. Multiple components or elements can display data from multiple reports.
3. End-user
In salesforce, different users will have different privileges to use the data. A dashboard exhibits the data that the user working in the dashboard can access.
4. Filters
It lets the readers of the dashboard analyze the data from a particular perspective.
Components in Dashboard
- Chart:
It is used when you want to display the data graphically. You can select a particular chart from several types of charts.
- Gauge:
It is used when you have a unique value that you can display under a scale of practice values.
- Metric
To display a single key-value, we will use the metric
- Table
To display report data in column format, we will use tables.
- Visualforce Page
We will use a visualforce page to generate a personalized component.
Salesforce Tutorial For Beginners in 2021
Steps to Create a Dashboard in Salesforce
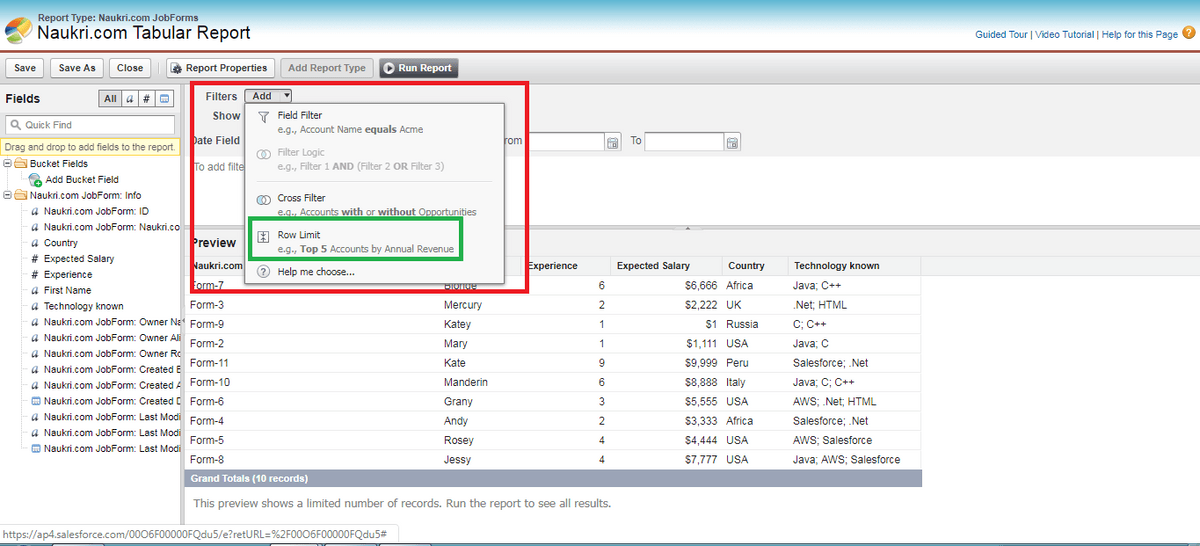
Before creating a dashboard, we should create a report that we use in the dashboard. Steps to create a report are as follows:
-
Select the Reports Tab
-
Select New Report and pick up the sales according to the report type.
-
Include the below filters
-
Select the entire contacts of the organization.
-
For creating a Date field, we will click “Create Date”.
-
For Extent, we will select “All time”.
-
Select Tabular format and choose the summary.
-
Pull Lead source from the Fields pane to the preview pane.
-
The columns like First name, Last name should be added in your report.
-
select Run Report.
-
Select Save As and save your sales report.
-
Select My Report file
-
Select save and come back to report.
[Related Article: Sharing Rules in Salesforce]
As our report is ready, we can visualize it through the dashboard.
-
Select the reports tab.
-
Select New Dashboard.
-
We have to drag & drop the pie chart from the component tab.
-
Select the data sources tab.
-
Select the sales from the sales report and include them in the pie chart component.
-
In a moment, the chart will be generated. You can edit it according to your requirements.
-
If you want, you can type the title and footer.
-
Select ok
-
Select save and save the dashboard with the name “sales Dashboard”.
-
Select save and Run Dashboard.

Salesforce Interview Questions and Answers
Dashboard Filters
They are used to give multiple combinations of data through a single dashboard. There is no need to create a separate dashboard for each user and we can allocate them a related filter.
Steps to create a Dashboard Filter:
-
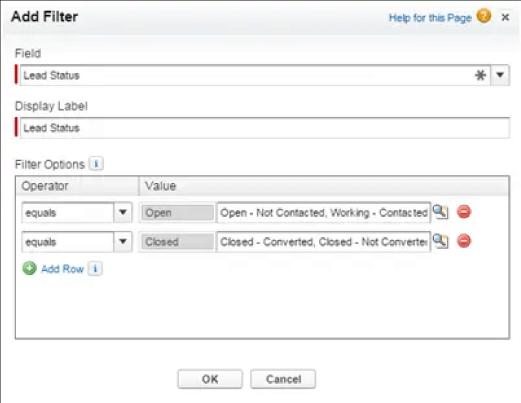
Select edit in the sales Dashboard and then select Filter.
-
Click the sale status field to filter from the Field Drop-down. When the dashboard has more than one component, a drop-down will display the filters that can filter the components.
-
Label the filter for identification purposes,
-
Within Filter options, pick up an operator and give values to filter.
-
To name the filter, we will use the Group Name field.

Conclusion
In salesforce, to visualise the data we will use dashboards. The dashboard makes us see the reports of the data from a particular perspective. In the dashboard, we can analyze according to our requirements. Based on that analysis, we can enhance our business. Through Dashboard filters, we can filter the data.
In the next topics, we will discuss in detail about, “Salesforce Lookup Relationship.” Keep following us for more info on Salesforce Administration
 On-Job Support Service
Online Work Support for your on-job roles.

Our work-support plans provide precise options as per your project tasks. Whether you are a newbie or an experienced professional seeking assistance in completing project tasks, we are here with the following plans to meet your custom needs:
- Pay Per Hour
- Pay Per Week
- Monthly
| Name | Dates | |
|---|---|---|
| Salesforce Training | Feb 24 to Mar 11 | View Details |
| Salesforce Training | Feb 28 to Mar 15 | View Details |
| Salesforce Training | Mar 03 to Mar 18 | View Details |
| Salesforce Training | Mar 07 to Mar 22 | View Details |

Arogyalokesh is a Technical Content Writer and manages content creation on various IT platforms at Mindmajix. He is dedicated to creating useful and engaging content on Salesforce, Blockchain, Docker, SQL Server, Tangle, Jira, and few other technologies. Get in touch with him on LinkedIn and Twitter.


