
- Introduction to Amazon Elastic File System
- Amazon On-Demand Instance Pricing
- AWS Kinesis
- Amazon Redshift Tutorial
- Amazon SageMaker - AIs Next Game Changer
- AWS Console - Amazon Web Services
- AWS Architect Interview Questions
- AWS Architecture
- Amazon Athena
- Top 11 AWS Certifications List and Exam Learning Path
- How to Create Alarms in Amazon CloudWatch
- Introduction To AWS CLI
- AWS Configuration
- AWS Data Pipeline Documentation
- AWS EC2 Instance Types
- AWS Elastic Beanstalk
- AWS Elastic Beanstalk Available in AWS GovCloud (US)
- AWS Free Tier Limits and Faq
- AWS EC2 Instance Pricing
- Choosing The Right EC2 Instance Type For Your Application
- AWS Interview Questions and Answers
- AWS Key Management Service
- AWS Lambda Interview Questions
- AWS Lambda Tutorial
- What Is AWS Management Console?
- Complete AWS Marketplace User Guide
- AWS Outage
- AWS Reserved Instances
- AWS SDK
- What is AWS SNS?
- AWS Simple Queue Service
- AWS SysOps Interview Questions
- AWS vs Azure
- AWS Vs Azure Vs Google Cloud Free Tier
- Introduction to AWS Pricing
- Brief Introduction to Amazon Web Services (AWS)
- Clean Up Process in AWS
- Creating a Custom AMI in AWS
- Creating an Elastic Load Balancer in AWS
- How to Deploy Your Web Application into AWS
- How to Launch Amazon EC2 Instance Using AMI?
- How to Launch Amazon EC2 Instances Using Auto Scaling
- How to Sign Up for the AWS Service?
- How to Update Your Amazon EC2 Security Group
- Process of Installing the Command Line Tools in AWS
- Big Data in AWS
- Earning Big Money With AWS Certification
- AWS Certification Without IT Experience. Is It Possible?
- How to deploy a Java enterprise application to AWS cloud
- What is AWS Lambda?
- Top 10 Reasons To Learn AWS
- Run a Controlled Deploy With AWS Elastic Beanstalk
- Apache Spark Clusters on Amazon EC2
- Top 35 AWS Services List
- What is Amazon S3? A Complete AWS S3 Tutorial
- What is AMI in AWS
- What is AWS? Amazon Web Services Introduction
- What is AWS Elasticsearch?
- What is AWS ELB? – A Complete AWS Load Balancer Tutorial
- What is AWS Glue?
- AWS IAM (Identity and Access Management)
- AWS IoT Core Tutorial - What is AWS IoT?
- What is Cloud Computing - Introduction to Cloud Computing
- Why AWS Has Gained Popularity?
- Top 10 Cloud Computing Tools
- AWS Glue Tutorial
- AWS Glue Interview Questions
- AWS S3 Interview Questions
- AWS Projects and Use Cases
- AWS VPC Interview Questions and Answers
- AWS EC2 Tutorial
- AWS VPC Tutorial
- AWS EC2 Interview Questions
- AWS DynamoDB Interview Questions
- AWS API Gateway Interview Questions
- How to Become a Big Data Engineer
- What is AWS Fargate?
- What is AWS CloudFront
- AWS CloudWatch Interview Questions
- What is AWS CloudFormation?
- What is AWS Cloudformation
- Cloud Computing Interview Questions
- What is AWS Batch
- What is AWS Amplify? - AWS Amplify Alternatives
- Types of Cloud Computing - Cloud Services
- AWS DevOps Tutorial - A Complete Guide
- What is AWS SageMaker - AWS SageMaker Tutorial
- Amazon Interview Questions
- AWS DevOps Interview Questions
- Cognizant Interview Questions
- Cognizant Genc Interview Questions
- Nutanix Interview Questions
- Cloud Computing Projects and Use Cases
- test info
- AWS Server and Administration
- AWS vs Alternatives
While more organizations are migrating their applications to the cloud, they also need to ensure that cloud-based services like Amazon Web Services (AWS) and other resources are available to the business. So, how do you ensure that these cloud services are not disabled? You can do that using an application monitoring tool like Amazon CloudWatch. In this article, we are going to all about What is Amazon CloudWaatch?.
The Amazon CloudWatch service is among the efficient ways of monitoring AWS applications and resources running on the AWS platform. Using cloud-based monitoring, CloudWatch collects operational data through logs, metrics, and events that provide a unified view of AWS resources and applications.
AWS Cloudwatch Tutorial
In this AWS Cloudwatch Tutorial, you will learn the below topics:
| AWS Cloudwatch Tutorial - Table of Content |
What is Amazon CloudWaatch?
Designed as an AWS component, Amazon CloudWatch provides cloud-based monitoring of AWS resources including – EC2 instances, elastic, load balancers, auto-scaling groups – along with other Amazon services like Amazon S3, SNS, SQS, and RDS. Amazon administrators can easily monitor multiple AWS instances and applications from a centralized dashboard.
Additionally, CloudWatch can also be used to:
- Detect any anomaly in your cloud environment.
- Create custom dashboards that include metrics of the AWS services that you use.
- Create and configure alarms that can monitor AWS metrics and initiate automated actions.
- Gain complete visibility into application performance, utilization of AWS resources, and overall health of your operations.
| Want to know more about AWS? Visit here to know What is AWS |
How does Amazon CloudWatch work?
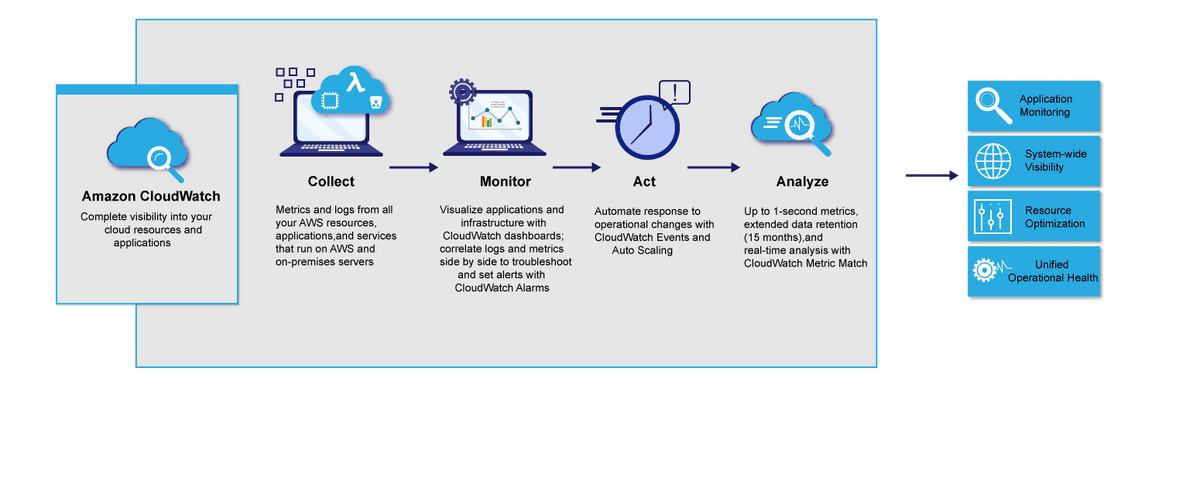
The Amazon CloudWatch primarily performs the following four actions:
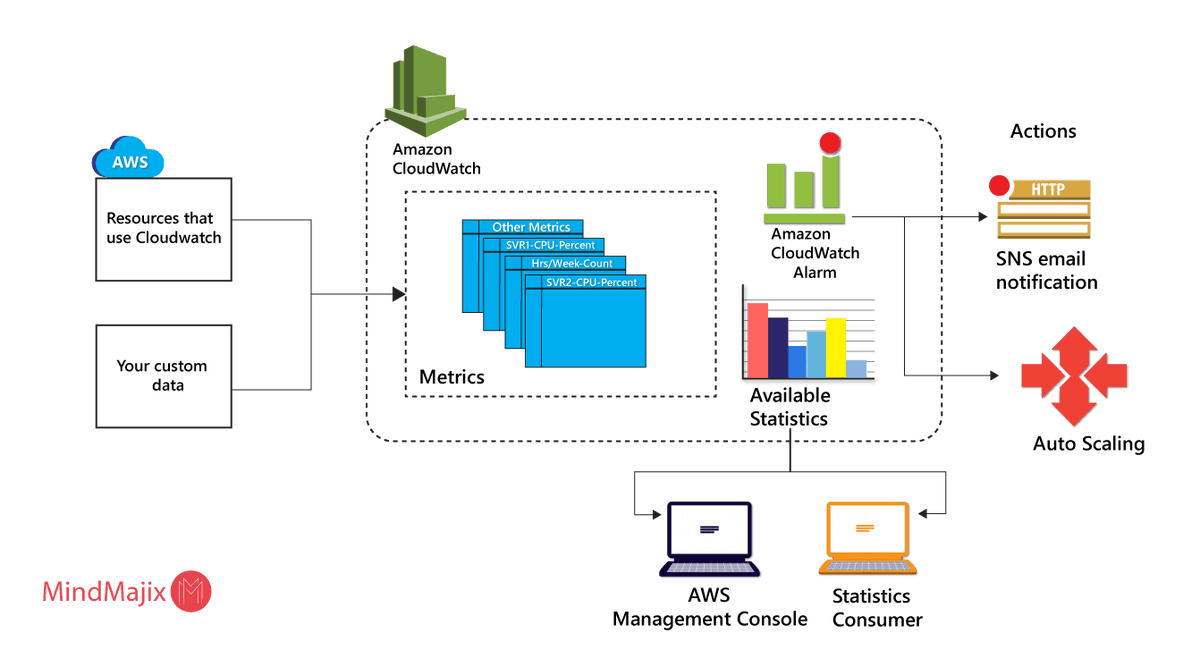
1. Collect metrics and logs
In the first step, CloudWatch collects metrics and logs from all your AWS services (for example, AWS EC2 instances). CloudWatch retrieves these metrics from the repository. This can also include custom metrics entered into the repository.
Here are some AWS services that publish CloudWatch metrics – Amazon API Gateway, AppStream version 2.0, Amazon Athena, and Amazon CloudFront.
2. Monitor and visualize the data
Next, CloudWatch monitors and visualizes this data using CloudWatch dashboards that provide a single unified view of all your AWS applications, resources, and services (running in premise or on the cloud). Additionally, you can correlate your collected metrics and logs to perform a visual analysis of the overall health and current performance of your resources.
3. Act on an automated response to any changes.
In this step, CloudWatch executes an automated response to any operational changes using alarms. For instance, you can configure an alarm to start or terminate an EC2 instance when selected conditions are satisfied. You can also use alarms to start services like Amazon EC2 auto-scaling or Amazon SNS.
If a configured alarm is triggered, you can set up automated actions like auto-scaling.
4. Analyse your metrics
The final step is to analyze and visualize your collected metric and log data – that can enable better insight and understanding. You can perform real-time analysis using CloudWatch Metric Math which helps you dive deeper into your data.
| Want to take your Cloud knowledge next level? Click here to learn AWS Online Training |
What is the need for Cloud-Based monitoring?
Be it on the premise or on the cloud, every business needs to ensure that its applications and services are running smoothly and productively. In addition to both web and cloud applications, a cloud-based monitoring tool is essential for monitoring cloud platforms, infrastructure, and networks.
For any web application deployed on the cloud, every business owner has questions related to the:
- The overall bandwidth consumed by the application on a daily basis
- The number of online users that are using the application
- The overall performance of the application on the cloud
- The level of customer satisfaction with the application
Cloud-based monitoring services like CloudWatch enable you to track how your application is performing on the cloud. Additionally, you can identify any performance bottlenecks or issues, thus enabling you to eliminate them and improve your application performance. This can help in business growth in the long run.
With the increasing number and complexity of AWS services, it’s no longer feasible to manually monitor your applications and services, hence you need an automation tool like CloudWatch.
What are the benefits of Amazon CloudWatch?
Amazon CloudWatch offers the following 5 benefits to businesses:
1. Access all monitoring data from a single dashboard
Amazon CloudWatch allows you to monitor data from different services using a single dashboard. CloudWatch is natively integrated with over 70 AWS-related services.
Cloud-based applications including AWS applications generate large volumes of data through metrics and logs. CloudWatch allows you to easily collect and integrate all data from various applications and services and provide a visual representation of the analyzed data on the dashboard.

2. Collects and analyze metrics from AWS and on-premise applications
Thanks to its seamless integration with over 70 AWS services, CloudWatch can collect and publish metric data automatically. This includes 1-minute native – and customized – metrics with 1-second granularity. CloudWatch is also supported on a hybrid AWS architecture that uses both on-premises and cloud-based resources.
Using this metric and log data, you can now optimize your AWS services and resources to achieve the best performance and throughput.
3. Improve your operational efficiency and optimize your available resource
The Amazon CloudWatch service provides real-time insights into cloud operations that enable you to optimize operational efficiency and reduce costs. By monitoring the utilization of AWS resources, you can be better informed of the kind of workload capacities that you require for your applications.
Through the use of configured alarms, CloudWatch can automate your actions based on preconfigured thresholds or on the basis of machine learning algorithms that can detect anomalies in your metric data.
4. Improve operational visibility
With the Amazon CloudWatch service, you gain operational visibility across all your running applications, networks, infrastructure stacks, and other AWS services. For instance, you can use CloudWatch to monitor the memory usage and bandwidth for any application, so as to optimize them for better performance.
Additionally, you can perform metric-related mathematical operations to derive operational insights from your data. For instance, you can aggregate memory usage across multiple EC2 instances. As a result, you gain complete visibility of your entire system and can detect and resolve any performance issues.
5. Extract valuable insights
Finally, Amazon CloudWatch enables you to extract valuable and actionable insights from generated logs of different AWS services and applications. You can explore, analyze, and then visualize your log data to monitor data like memory usage, CPU utilization, and capacity usage.
With CloudWatch, you only need to pay for the log queries that you run, which can also scale with higher log volume and complexity.
| Related Article: Top Amazon EC2 Interview Questions |
How to create CloudWatch Dashboards?
Amazon CloudWatch dashboards are customizable dashboards that provide a unified view of all your AWS resources – including those that are located in different AWS regions. As an AWS administrator, you can create an unlimited number of CloudWatch dashboards on your AWS account.
You can create the dashboard using the:
- CloudWatch console
- PutDashboard API
Here’s how you can create a CloudWatch dashboard using the CloudWatch console:
1. Open the CloudWatch console.
2. From the navigation pane, click Dashboards > Create a dashboard.
3. From the “Create new dashboard” box that appears, enter your dashboard name and then click “Create a dashboard.”
If you enter the dashboard name as “CloudWatch-Default,” your dashboard will be displayed on the CloudWatch home page. Alternatively, if you use the name “CloudWatch-Default-<Resource Group Name>,” the dashboard appears on the CloudWatch home page when you open the particular AWS resource group.
4. As required, perform any of the following actions in the “Add to this dashboard” box:
a. To add a graph to the dashboard:
-
- Select either Line or Stacked Area and then click Configure.
- From the “Add metric graph” dialog box, choose the metrics to be included in the graph and then click “Create widget.”
b. To add a number that displays a metric on the dashboard:
-
- Select Number and then click Configure.
- Select metrics to be included in the graph from the “Add metric graph” dialog box and then click “Create widget.”
c. For adding a text block to the dashboard:
-
- Select Text and then click Configure.
- From the “New text widget” dialog box, choose “Markdown” and then add and format your text.
- Click “Create widget.”
5. Repeat Step 4 to add more dashboard widgets if required.
6. Save your dashboard.
You can also create or modify a CloudWatch dashboard using the PutDashboard API function. Here are some of the common parameters that are used with this API:
- DashboardName (mandatory): specifies the dashboard name in String format.
- DashboardBody (mandatory): contains all the dashboard information including the widgets to be added and their location on the dashboard.
| If you want to learn the best Cloud Deployment Models, then read our updated blog - Top Cloud Deployment Models |
How to create and configure CloudWatch Alarms?
Amazon CloudWatch allows you to create both the following types of alarms:
Metric alarms monitor a single metric or a math metric that is based on a mathematical expression.
Composite alarms are triggered only if the condition for all other configured alarms is satisfied.
You can also create an alarm that is based on:
- Static threshold of a single metric
- Anomaly detection
- Metric math expression
Here’s how you can create a CloudWatch alarm – based on a single metric - using the CloudWatch console:
1. Open the CloudWatch console.
2. From the navigation pane, click Alarms > Create Alarm.
3. Select your metric and then perform either of the following actions:
- Select the service namespace containing the metrics that you want to include.
- Search for a metric in the search box and then press Enter.
4. From the “Graphed metrics” tab, perform the following actions:
- From Statistics, choose any of the available statistics or percentiles.
- From Period, specify the evaluation period of the alarm.
- Click “Select metric” to display the “Specify metric and conditions” page that shows all information of the metric and statistics that you have specified.
5. From the “Conditions” tab, perform the following actions:
- Specify the name and description of the alarm.
- Use the “Whenever <metric> is” field to specify the threshold value of the metric.
- Click “Additional configuration.”
- In “Datapoints to alarm,” specify the number of evaluation periods (or data points) required to trigger the alarm.
- From “Missing data treatment,” configure the alarm settings in the event of any missing data points.
- Click Next.
6. From the “Notification” tab, select the Amazon SNS topic that should be notified when the alarm is triggered.
7. Select the respective options if you want the alarm to perform auto-scaling or any other EC2 actions.
8. In the “Preview and create” tab, preview the alarm settings and then click “Create alarm.”
Here’s how you can create a CloudWatch alarm – based on anomaly detection - using the CloudWatch console:
1. Perform Steps 1 to 4 as specified above.
2. From the “Conditions” tab, perform the following actions:
- Select the “Anomaly detection” option
- Use the “Whenever <metric> is” field to specify the range of metric values that can trigger the alarm.
- Specify the anomaly detection number in the “Anomaly detection threshold” field
- Click “Additional configuration.”
- In “Datapoints to alarm,” specify the number of evaluation periods (or data points) required to trigger the alarm.
- From “Missing data treatment,” configure the alarm settings in the event of any missing data points.
- Click Next.
3. Perform Steps 6 to 8 (as specified above) to create the alarm.
Finally, here’s how you can create a CloudWatch alarm – based on a metric math expression - using the CloudWatch console:
1. Perform Steps 1 to 4 as specified in the first procedure.
2. Click “Add a math expression” to add a new row for the expression:
- Add a math expression under the “Details” column of the new row.
- Add a metric or another mathematical expression under the “Id” column.
- Add more math expressions if required.
3. Click “Select metric” to display the “Specify metric and conditions” page that shows all information of the metric math expression that you have specified.
4. Perform the remaining steps (as detailed from Steps 2d in the previous procedure.
5. Perform Steps 6 to 8 (as specified in the first procedure) to create the alarm.
| Explore AWS Sample Resumes! Download & Edit, Get Noticed by Top Employers! |
Conclusion
Using the Amazon CloudWatch service, you can monitor cloud-based applications and other AWS services and troubleshoot any performance issues. With its single and centralized dashboard, AWS administrators now have complete visibility into applications and services running in the same or different AWS regions.
Was this AWS Cloudwatch Tutorial helpful for your complete understanding? Post your feedback comments in the section below.
List Of AWS Courses Offered By Mindmajix
 On-Job Support Service
Online Work Support for your on-job roles.

Our work-support plans provide precise options as per your project tasks. Whether you are a newbie or an experienced professional seeking assistance in completing project tasks, we are here with the following plans to meet your custom needs:
- Pay Per Hour
- Pay Per Week
- Monthly
| Name | Dates | |
|---|---|---|
| AWS Training | Jul 25 to Aug 09 | View Details |
| AWS Training | Jul 28 to Aug 12 | View Details |
| AWS Training | Aug 01 to Aug 16 | View Details |
| AWS Training | Aug 04 to Aug 19 | View Details |

Pooja Mishra is an enthusiastic content writer working at Mindmajix.com. She writes articles on the trending IT-related topics, including Big Data, Business Intelligence, Cloud computing, AI & Machine learning, and so on. Her way of writing is easy to understand and informative at the same time. You can reach her on LinkedIn & Twitter.


