- 6 Hot And In-Demand Tech Areas In 2024
- How To Forward Your Career With Cloud Skills?
- Top 7 On-Demand IT Certifications
- Most In-demand Technologies To Upskill Your Career
- Top 10 Hottest Tech Skills to Master in 2024
- Top Skills You Need to Become a Data Scientist
- Groovy Interview Questions
- Facets Interview Questions
- Crystal Reports Tutorial
- VAPT Interview Questions
- Flutter Tutorial
- Saviynt VS Sailpoint
- Flutter vs Xamarin
- PingFederate Interview Questions and Answers
- Dart vs Javascript : What's the Difference?
- Terraform Private Registry
- Cylance Interview Questions and Answers
- Sophos Interview Questions and Answers
- Top Camunda Interview Questions
- NUnit Interview Questions and Answers
- Impala Interview Questions and Answers
- ETL Tutorial
- Ionic Interview Questions
- Grafana Tutorial
- What is VAPT? - A Complete Beginners Tutorial
- SnapLogic Interview Questions
- Saviynt Interview Questions
- What is PingFederate? - A Complete Beginners Tutorial
- SnapLogic Tutorial
- Grafana Interview Questions
- RHCE Interview Questions and Answers
- Web Services Interview Questions
- Domo Interview Questions and Answers
- Terraform Interview Questions
- What is Sophos? | Sophos Turorial for Beginners
- Top Servlet Interview Question And Answers
- NLP Interview Questions and Answers
- Microsoft Intune Interview Questions
- Top XML Interview Questions And Answers
- Tosca Commander
- Katalon vs Cypress
- SQLite Tutorial
- Tosca Tutorial - A Complete Guide for Beginners
- Xamarin Interview Questions and Answers
- UiPath vs Automation Anywhere - The Key Differences
- OpenShift Interview Questions
- What is Katalon Studio - Complete Tutorial Guide
- Kronos Interview Questions
- Tosca Framework
- Burp Suite Tutorial
- Mendix Interview Questions
- Power Platform Interview Questions
- Burp Suite Interview Questions
- What is Mendix
- What is Terraform ?
- Burp Suite Alternatives
- Dart vs Kotlin
- What is Kronos?
- ES6 Interview Questions
- Entity Framework Interview Questions
- COBOL Interview Questions
- Express JS Interview Questions
- OSPF Interview Questions
- LINQ Tutorial
- CSS3 Interview Questions and Answers
- Auth0 Tutorial
- MS Access Interview Questions
- What is SPARQL - A Complete Tutorial Guide
- ExpressJS Tutorial
- UML Tutorial
- HTML vs XML
- Cypress vs Jest
- Impacts of Social Media
- OWASP Interview Questions
- Security Testing Interview Questions
- OpenShift vs Docker
- ES6 Tutorial
- Spark SQL Interview Questions
- Spark SQL Tutorial
- What is OWASP?
- AppDynamics Interview Questions
- Dynatrace Interview Questions
- Rest Assured Tutorial
- New Relic Interview Questions
- REST API Tutorial
- Datadog Interview Questions
- Rest API Interview Questions
- Rest Assured Interview Questions
- PTC Windchill Interview Questions
- Easiest Tech Skills To Learn
- Python SQLite Tutorial - How to Install SQLite
- Datadog Tutorial - Datadog Incident Management
- RabbitMQ Interview Questions And Answers
- What is Dynatrace
- Datadog Vs Splunk
- Web Developer Job Description
- JP Morgan Interview Questions
- Types of Corporate Training
- Benefits of Corporate Training
- What is Corporate Restructuring?
- Blended Learning in Corporate Training
- What is Corporate Level Strategy?
- Flutter Projects and Use Cases
- How to Become a Web Developer
- How To Install Keras?
- How to Install Flutter on Windows?
- How to Install Cypress on Windows?
- How to Become a Computer Scientist?
- How to Install Katalon Studio in Windows
- How to Become a Programmer
- OWASP Projects and Use Cases
- How to Install Sophos?
- Workato Tutorial
- Workato Tutorial - What is Workato?
AppDynamics is the tool with which you can track the performance of applications and the behavior of users closely. You can measure business metrics accurately and compare with them stack performance. It will help to make quick business decisions. With AppDynamics, you can get complete visibility across a business.
With AppDynamics, you can achieve optimal performance and improve productivity. Also, you can cut down the operational cost in full-stack application development. Importantly, you can identify, prioritize, and solve business issues through the AI-based capabilities of the tool.
This blog packs everything you need to know about AppDynamics and its applications. You can find the AppDynamics architecture, key concepts, terminologies, and many more in detail. Let’s unpack!
| Table of Contents: What is AppDynamics |
What is AppDynamics?
AppDynamics is one of the application performance monitoring tools widely used across many companies. It aims to provide visibility to the code execution in application infrastructure. An end user can monitor, analyze, configure, and troubleshoot the execution of code.
With AppDynamics, you can fully visualize stack performance and insights. It allows you to make accurate and informed decisions. As a result, this tool helps to improve business results and user experience ultimately.
Not only business and user experience, but AppDynamics precisely visualizes security, network, infrastructure, and application features. You can improve business performance and productivity to greater heights with all features.
| If you want to enrich your career and become a professional in Appdynamics, then enroll in "Appdynamics Training". This course will help you to achieve excellence in this domain. |
How AppDynamics work?
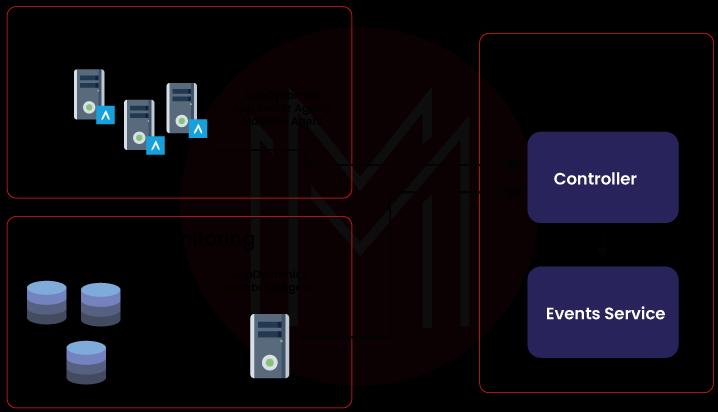
AppDynamics provides code-level visibility after installing agents and controllers on the applications to monitor. Each line of code is monitored by the AppDynamics agent and collects performance metrics. It forwards the metrics to the AppDynamics controller, which processes them and sends visual reports to the web browser. AppDynamics supports all major technologies in the IT industry, allowing any application to integrate AppDynamics for better full-stack development and maintenance in a distributed environment.

Now let us dive deep into each phase involved in monitoring an application using AppDynamics to know more.
Imagine a scenario where an organization's applications are deployed across multiple cloud platforms that use different service providers using versatile technologies. We deploy AppDynamics agents across the network to help discover individual business transactions. Cloud networks may combine public, private, or hybrid environments.
Within this network, the AppDynamics agents discover transactions from network topologies and share every possible detail about the transaction and its business metrics with the central AppDynamics controller. The controller uses artificial intelligence to create a baseline of the performance metrics received from the agents. These baselines will help us in backtracking the performance. If an anomaly in the network shows performance deviation from the baseline, we capture the performance to the individual line of code. This captured data helps us as a trigger to act early and gives the root cause of the performance deviance.
A detailed approach to identifying every transactional performance and the root causes will help your business avoid operational congestion in the network and reduce the time to resolve code-level issues if any.
Business owners can monitor real-time business metrics using AppDynamics which allows them to monitor, identify the problems quickly and respond with resolutions.
AppDynamics High-level Architecture
You can find the architecture of the AppDynamics workflow and its production monitoring architecture in this section. You can know what’s happening with different components and the AppDynamics actions.

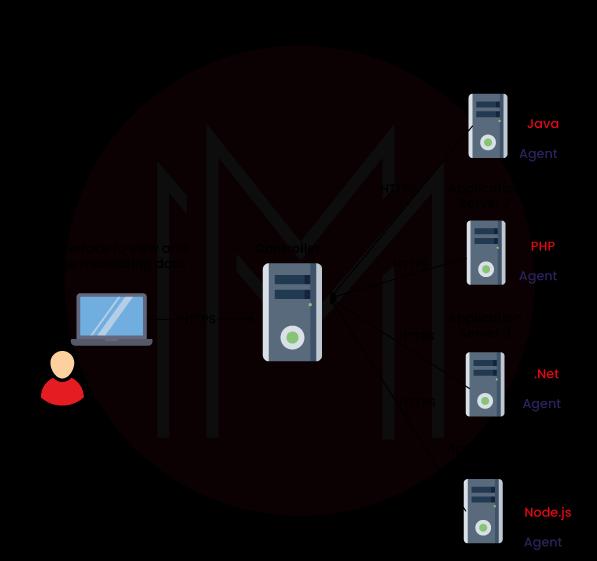
AppDynamics web interface is connected to the AppDynamics controller through a web browser (Uses port 8090 in most cases) with an HTTPS connection. AppDynamics controller receives the performance metrics and the operational data of the transactions across the network from the AppDynamics agents installed over the web. The application servers in the above image indicate different languages the agents support to make AppDynamics compatible with every business, irrespective of their coding language.
| Related Article: AppDynamics Interview Questions |
AppDynamics Machine Agent Infrastructure

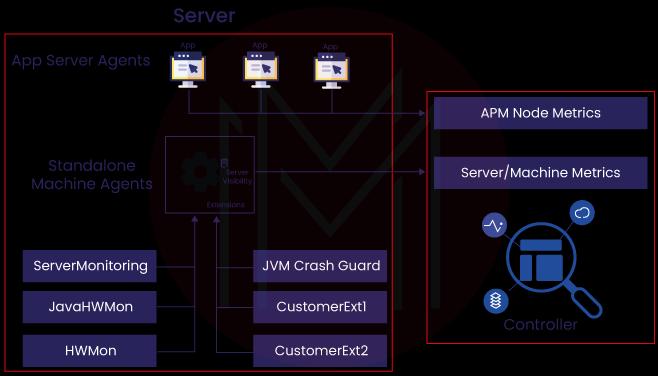
The AppDynamics machine agent collects basic hardware metrics like operating systems, memory utilization, and disk and network details. The agent acts as the delivery channel for AppDynamics server visibility. It offers many hardware metrics and monitoring capabilities. Machine agent uses only Java to report metrics collected in AppD Controller.
The machine agent gathers multiple extensions' information and sends it to the controller. You can run remediation scripts for policy actions and JVM crash guard with the machine agent. Also, you can estimate the correlations between servers and application performance issues indicated by app agents.

AppDynamics Production Monitoring Architecture

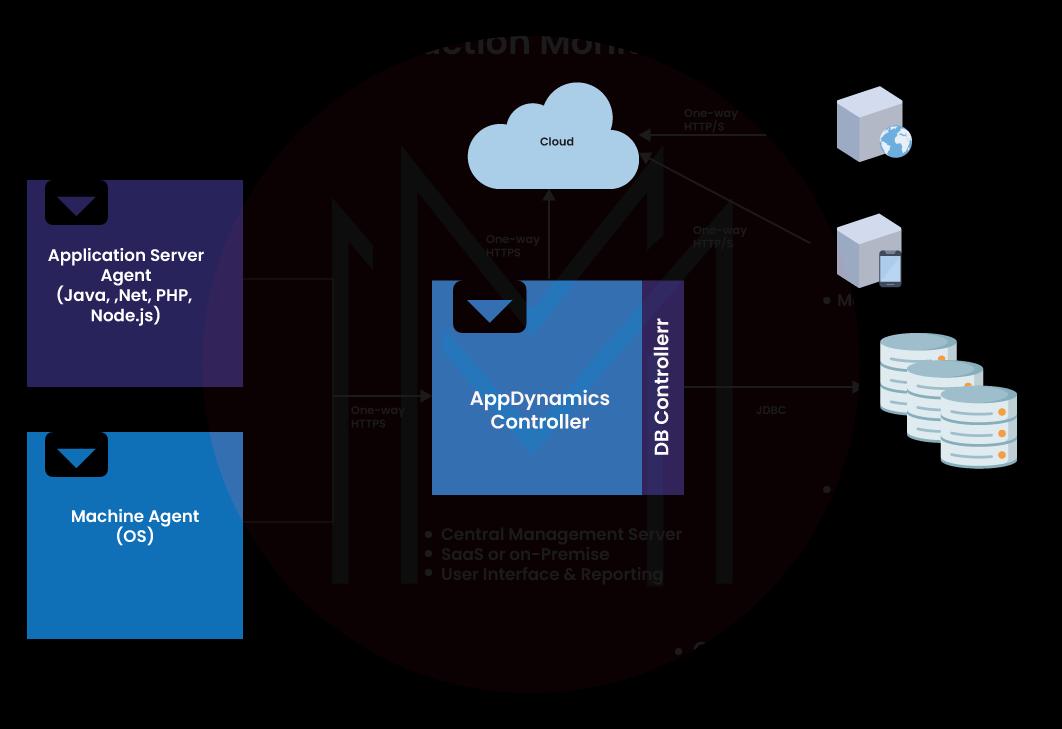
The AppDynamics and DB controller interact with the cloud to monitor and diagnose transactional operations over the network. The application server and machine agent together share the data with the controller.
Know that AppDynamics Pro architecture has many components such as AppDynamics controller and UI, App agents, machine agents, web EUM, Mobile APM, and databases. AppDynamics is the central rePro architecture repository and analytics engine. App agents are usually installed in JVM,.NET, and PHP applications. Machine agents collect data about machine performance and forward them to the controller. Web EUM allows you to track how web user experience. Similarly, mobile APM helps to follow mobile application performance.
AppDynamics Key Terminology
#1.Business Application
It is the top-level container to manage the tiers and control role-based access at the controller UI.
#2.Node
A node in an AppDynamics network is an application server installed on the infrastructure physically or virtually.
#3.Tier
A tier is a virtual group of nodes based on their business operations. One AppDynamics agent cannot take charge of more than one tier.
#4.Entry Point
It is an application code that initiates business transactions.
#5.Flow Map
It represents the process flow among the nodes, tiers, and backend components over the network infrastructure.
#6.Transactional snapshot
AppDynamics allows continuous monitoring of the operations across the network and shares all the collected data metrics with the controller. These screenshots will help businesses find the root cause of the performance disturbances if any.
#7.Health Rules
Guidelines that define the respective limits for the application performances throughout the network. AppDynamics provide default health rules for businesses, which you can alter according to the business performance requirements.
#8.Health
Health defines the process performance of the application and sends colored signals to the controller. Green, yellow, and red are the color schemes that determine the performance limits per the health rules.
#9.Server Health
It defines the health status of the servers and monitors whether the performance is aligned with the health rules defined.
#10.Transaction scorecard
The label defines the status of the transaction, whether it is slow, very slow, stalled, or has some errors.
AppDynamics FAQs
1. What is AppDynamics?
You can boost business productivity with AppDynamics. With AppDynamics, you can monitor any organization's software and hardware performance. You can easily find a solution to issues in configurations and performance.
2. Would AppDynamics change the product roadmap?
Yes. AppDynamics will change the product roadmap when there is a requirement.
3. What does an AppDynamics agent do?
Agents collect application metrics to build flow maps. They also monitor application codes, execution, and behavior. They find the widely used frameworks and services automatically.
4. How can I submit a support ticket in AppDynamics?
You can use the support portal on the AppDynamics website and raise a new request.
5. What is the benefit of AppDynamics?
You can resolve performance issues quickly. All the applications can be tracked and reported through visual analytics. Mainly, you can get good visibility across the application performance and drive business to new levels.
Conclusion
We hope that this blog has shed a good light on AppDynamics. Mainly, AppDynamics supports monitoring business transactions closely. You can watch the performance blockers and resolve issues quickly. As a result, you can improve business performance and productivity significantly. The AI-based capabilities offer great mileage to this tool by deriving helpful analytics and insights. If you want to know more about AppDynamics, you can visit the AppDynamics training page and select a course to enhance your knowledge.
 On-Job Support Service
Online Work Support for your on-job roles.

Our work-support plans provide precise options as per your project tasks. Whether you are a newbie or an experienced professional seeking assistance in completing project tasks, we are here with the following plans to meet your custom needs:
- Pay Per Hour
- Pay Per Week
- Monthly
| Name | Dates | |
|---|---|---|
| AppDynamics Training | May 09 to May 24 | View Details |
| AppDynamics Training | May 12 to May 27 | View Details |
| AppDynamics Training | May 16 to May 31 | View Details |
| AppDynamics Training | May 19 to Jun 03 | View Details |

Madhuri is a Senior Content Creator at MindMajix. She has written about a range of different topics on various technologies, which include, Splunk, Tensorflow, Selenium, and CEH. She spends most of her time researching on technology, and startups. Connect with her via LinkedIn and Twitter .


