
- 6 Hot And In-Demand Tech Areas In 2024
- How To Forward Your Career With Cloud Skills?
- Top 7 On-Demand IT Certifications
- Most In-demand Technologies To Upskill Your Career
- Top 10 Hottest Tech Skills to Master in 2024
- Top Skills You Need to Become a Data Scientist
- Groovy Interview Questions
- Facets Interview Questions
- Crystal Reports Tutorial
- VAPT Interview Questions
- Flutter Tutorial
- Saviynt VS Sailpoint
- Flutter vs Xamarin
- PingFederate Interview Questions and Answers
- Dart vs Javascript : What's the Difference?
- Terraform Private Registry
- Cylance Interview Questions and Answers
- Sophos Interview Questions and Answers
- Top Camunda Interview Questions
- NUnit Interview Questions and Answers
- Impala Interview Questions and Answers
- ETL Tutorial
- Ionic Interview Questions
- Grafana Tutorial
- What is VAPT? - A Complete Beginners Tutorial
- SnapLogic Interview Questions
- Saviynt Interview Questions
- What is PingFederate? - A Complete Beginners Tutorial
- SnapLogic Tutorial
- RHCE Interview Questions and Answers
- Web Services Interview Questions
- Domo Interview Questions and Answers
- Terraform Interview Questions
- What is Sophos? | Sophos Turorial for Beginners
- Top Servlet Interview Question And Answers
- NLP Interview Questions and Answers
- Microsoft Intune Interview Questions
- Top XML Interview Questions And Answers
- Tosca Commander
- Katalon vs Cypress
- SQLite Tutorial
- Tosca Tutorial - A Complete Guide for Beginners
- Xamarin Interview Questions and Answers
- UiPath vs Automation Anywhere - The Key Differences
- OpenShift Interview Questions
- What is Katalon Studio - Complete Tutorial Guide
- Kronos Interview Questions
- Tosca Framework
- Burp Suite Tutorial
- Mendix Interview Questions
- Power Platform Interview Questions
- Burp Suite Interview Questions
- What is Mendix
- What is Terraform ?
- Burp Suite Alternatives
- Dart vs Kotlin
- What is Kronos?
- ES6 Interview Questions
- Entity Framework Interview Questions
- COBOL Interview Questions
- Express JS Interview Questions
- OSPF Interview Questions
- LINQ Tutorial
- CSS3 Interview Questions and Answers
- Auth0 Tutorial
- MS Access Interview Questions
- What is SPARQL - A Complete Tutorial Guide
- ExpressJS Tutorial
- UML Tutorial
- HTML vs XML
- Cypress vs Jest
- Impacts of Social Media
- OWASP Interview Questions
- Security Testing Interview Questions
- OpenShift vs Docker
- ES6 Tutorial
- Spark SQL Interview Questions
- Spark SQL Tutorial
- What is OWASP?
- AppDynamics Interview Questions
- Dynatrace Interview Questions
- Rest Assured Tutorial
- New Relic Interview Questions
- REST API Tutorial
- Datadog Interview Questions
- Rest API Interview Questions
- Rest Assured Interview Questions
- PTC Windchill Interview Questions
- Easiest Tech Skills To Learn
- Python SQLite Tutorial - How to Install SQLite
- Datadog Tutorial - Datadog Incident Management
- What is AppDynamics - AppDynamics Architecture
- RabbitMQ Interview Questions And Answers
- What is Dynatrace
- Datadog Vs Splunk
- Web Developer Job Description
- JP Morgan Interview Questions
- Types of Corporate Training
- Benefits of Corporate Training
- What is Corporate Restructuring?
- Blended Learning in Corporate Training
- What is Corporate Level Strategy?
- Flutter Projects and Use Cases
- How to Become a Web Developer
- How To Install Keras?
- How to Install Flutter on Windows?
- How to Install Cypress on Windows?
- How to Become a Computer Scientist?
- How to Install Katalon Studio in Windows
- How to Become a Programmer
- OWASP Projects and Use Cases
- How to Install Sophos?
- Workato Tutorial
- Workato Tutorial - What is Workato?
The interview process for a Grafana job can vary depending on the company. Though the approach may vary, all interviews have the same goal—employers are looking for the best candidate for the role. To make sure you stand out, you'll need to clearly define the skills and worth you can contribute as a Grafana Professional.
In collaboration with Grafana pros and industry experts, we have put together a list of general Grafana interview questions and answers to help you with your preparation in applying for Grafana jobs. This blog contains 30 top Grafana questions which will definitely help you in a Grafana interview. It’s a must-read blog for anyone looking forward to making a career in Grafana.
Top 10 Frequently Asked Grafana Interview Questions
- What is a Grafana Dashboard?
- Why Grafana?
- What type of monitoring can be done via Grafana?
- Grafana vs Prometheus
- Grafana Vs Kibana
- What is Grafana Loki and How does it work?
- What are exemplars in Grafana?
- What are metrics and visualizations?
- What are Grafana plugins?
- Explain Grafana Alerts?
Top Grafana Interview Questions For Freshers
1. What is Grafana?
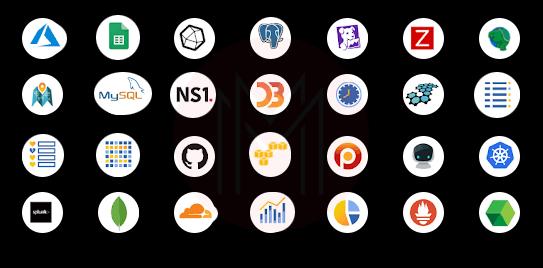
Grafana is an open-source data analytics tool for gathering metrics that make sense of enormous volumes of data and monitoring our applications via cool configurable dashboards. Grafana connects to Graphite, Prometheus, Influx DB, ElasticSearch, MySQL, PostgreSQL, and other databases.
Grafana's open-source nature allows us to create custom plugins for a range of data sources.
Time-series analytics is a technique for analyzing, tracking, and reviewing data over a long period of time.
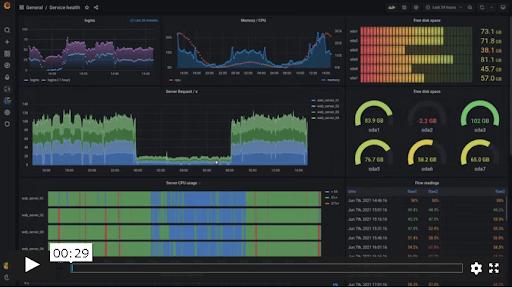
2. What is a Grafana Dashboard?
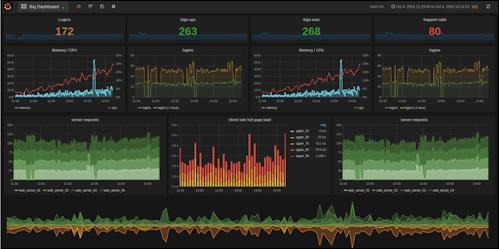
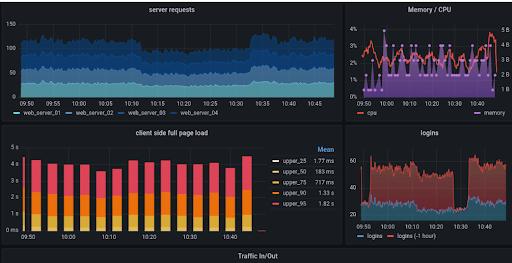
Grafana dashboards are made to bring data together in an organized and effective way. It employs queries, smart visualizations, and alerts to assist users in better comprehending their data's metrics. Grafana dashboards not only give meaning to data obtained from a variety of sources but can also be shared with other team members, allowing you to collaborate on data analysis.
Here's an example of a Grafana dashboard that's being used to keep track of things:
Graphite, Prometheus, Influx DB, ElasticSearch, MySQL, PostgreSQL, and other plugged-in data sources are used to populate the dashboards. These are just a few of the many data sources Grafana comes pre-loaded with.
| Enrol in our Grafana Training and Certification Course today and develop a strong foundation in Grafana. |
3. What are the features of Grafana?
Key features of Grafana:
i) Panels: From heatmaps to histograms. Geo maps to graphs. Grafana's visualisations are fast and flexible, allowing you to visualise your data however you want.
ii) Plugins: Plugins for Grafana enable you to connect your tools and teams. Data source plugins link to existing data sources via APIs and render data in real-time, removing the need for data migration or ingestion.
iii) Alerts: Grafana alerting allows you to centralise and unify all of your alerts by allowing you to create, manage, and silence them all from a single interface.
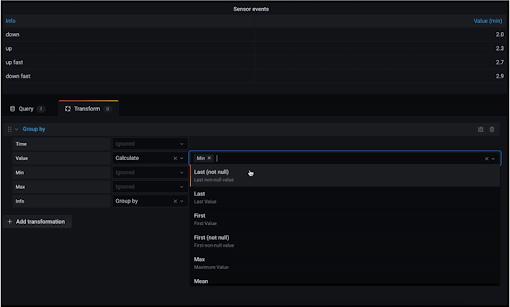
iv) Transformations: You may rename, summarise, aggregate, and calculate data across several searches and data sources using transformations.
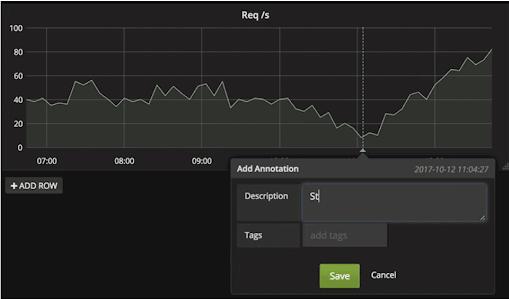
v) Annotations: Rich events from many data sources can be annotated into graphs. You may see all of an event's metadata and tags by hovering your mouse over it.
vi) Panel Editor: With a consistent UI for configuring data settings across all of your visualizations, the panel editor makes it simple to build, alter, and explore all of your panels.
4. Why Grafana?
- Your data should be brought together, not your database.
Grafana eliminates the need to ingest data into a backend store or vendor database. Grafana, on the other hand, takes a unique approach to provide a "single pane of glass" by bringing together all of your existing data, regardless of where it is kept.
Grafana allows you to visualize any existing data from a single dashboard, including data from your Kubernetes cluster, Raspberry Pi, multiple cloud services, and even Google Sheets. - Flexibility and versatility
Any of your data may be made into a dashboard that is versatile and customizable. Unlike other systems, Grafana allows you to develop bespoke dashboards for you and your team.
Using advanced querying and modification features, you may personalize your panels to create visualizations that are truly valuable to you. - The data is visible to all.
Grafana was founded on the idea that data should be accessible to everyone in your organization, not just the Ops team.
Grafana democratizes data, which helps to break down data silos and empower teams, and so promotes a culture where data can be easily used and accessed by those who need it. - Anyone can utilize the dashboards
Grafana dashboards not only provide meaningful meaning to data gathered from a variety of sources but they can also be shared with other team members, allowing you to study the data together.
Anyone can use Grafana to create and share dynamic dashboards that promote collaboration and transparency.

5. Is it possible to use Grafana without Prometheus?
Grafana can only access data from third-party systems like Prometheus, MySQL, Azure Monitor, and Amazon CloudWatch, among others. Grafana is so dependent on other systems for data because it lacks the ability to collect data on its own, whether via agents or other data pipelines.
6. Is Grafana a reporting tool?
Grafana isn't a reporting tool; it's a dashboard tool. Grafana is open-source and free, however, it lacks reporting capabilities. Grafana Enterprise Stack edition, which costs at least $3,500 per month, is the only way to get basic reporting functionality.
7. What type of monitoring can be done via Grafana?
Grafana is the most widely used open-source tool for querying, visualising and alerting metrics and logs from everywhere. Time-series databases like Graphite, Prometheus, Elasticsearch, OpenTSDB, and InfluxDB are used to query.
8. What databases work with Grafana?
Grafana was first launched in 2014 and can now connect to a variety of data sources such as MySQL, SQL Server, Graphite, Prometheus, and others. This tool is most commonly used to build a time-series data visualization, which illustrates the health or utilization of a resource over time.
9. What is Grafana Cloud?
Grafana Cloud is a scalable, highly available, and performant observability platform for your applications and infrastructure. It allows you to see all of your observability data in one place, whether it's stored in Grafana Cloud Metrics or on your own bare-metal and cloud systems. With built-in support for Prometheus, Elasticsearch, and Amazon CloudWatch, all you have to do is configure data sources in Grafana Cloud to start developing dashboards and querying metrics data.
10. What is Grafana Enterprise?
Grafana Enterprise is a paid version of Grafana that offers capabilities not available in the free source version. Grafana Enterprise gives you access to enterprise plugins, which allow you to use your existing data sources in Grafana. This means you can get the most out of your complicated, costly monitoring solutions and databases by viewing all of the data in a more efficient and effective manner.
Top Grafana Interview Questions For Experienced
11. What Is Prometheus Grafana?
Prometheus is an open-source data monitoring tool. Prometheus and Grafana are the industry standard tool combination for deploying a data visualization solution. Grafana is used to visualize the data, and Prometheus is used to fuel the backend.
Prometheus, on the other hand, has data visualization options. Grafana, on the other hand, continues to be the most often used data visualization tool. Prometheus data is retrieved using queries that are initiated from the dashboard. It is the most suitable open-source data model for storing time-series data.
12. Grafana vs Prometheus
| Parameters | Grafana | Prometheus |
| Metrics of performance. | The data is grouped and loaded in steps. | WAL replay is improved, and memory utilization is optimized. |
| Editing and Visualization of Data | Grafana includes a multitude of choices for showing time-series data as an open-source data visualization tool. It also provides users with other tools, such as plugins, to help them visualize their data. | Prometheus, on the other hand, must rely on console templates for visualization. It can graph data, but it has to rely on Grafana for full frameworks like queries and dashboards. |
| Memory | Grafana is nothing more than a data visualization tool. When it comes to data storage, it is hopeless. | Here, Prometheus has the upper hand. It excels in storing and organizing time-series data via important value labeling. |
| Alarms and Tracking | Grafana allows the user to set the time for alert rule evaluation. Users are told here if the triggered alert needs to be adjusted. | Prometheus' alarm system is split into two pieces. The alerting rules send messages to alert managers. The alerts are then controlled by alert managers, who may deliver notifications by email or through other channels. |
| Key Highlights |
|
|
| Supported Data Sources | AWS CloudWatch, Graphite, Azure Monitor, ElasticSearch | Prometheus collects data metrics from monitored targets by scraping HTTP endpoints. |
13. Describe Graphite Grafana.
The Graphite ecosystem offers a scalable platform for collecting and storing time-series data, as well as a robust collection of functions for querying and analyzing the data over time. Grafana can effortlessly collect Graphite metrics, giving you a powerful tool for collecting, visualizing, and increasing the value of your Graphite data.
A few benefits of integrating Grafana with Graphite have listed below:
- Because of the centralized, horizontally scalable, replicated design, you can easily manage and maintain your Graphite installation according to your unique architecture.
- When a monitoring stack comes fully formed and configured, there's no need to build systems from open-source components.
- Thanks to best-in-class query performance, you can easily create real-time dashboards that can be shared across your organization.
- With strong data-access controls, administrators can secure and regulate your metrics data.
14. Grafana Vs Kibana
| Parameters | Grafana | Kibana |
| Logs vs. Metrics (Logging vs. Monitoring). | Grafana's design is optimized for analyzing and visualizing system metrics including CPU, memory, disc, and I/O utilization. The platform does not allow for full-text data querying. | On the other side, Kibana is an Elasticsearch-based log message analysis tool. |
| Data sources and integrations | Grafana is a graphical user interface for analyzing metrics. As a result, it has built-in connections to Graphite, Prometheus, InfluxDB, MySQL, PostgreSQL, and Elasticsearch, as well as plugins for additional data sources. | Kibana, on the other hand, was designed just for Elasticsearch and does not support any other data sources. |
| Authentication and access control | Grafana has built-in user management and authentication options for restricting and controlling access to your dashboards, as well as the ability to leverage an external SQL or LDAP server. | Your Kibana dashboards are open and accessible to the public by default unless you use the X-Pack or open-source alternatives like SearchGuard. |
| Alerts | Since version 4. x, Grafana has had a built-in alerting engine that allows users to attach conditional rules to dashboard panels and receive triggered alerts to their preferred notification endpoint. |
Kibana doesn't come with an alerting feature by default. To give alerting to Kibana, users can either use a hosted ELK Stack like Logz.io, implement ElastAlert, or use X-Pack. |
15. Explain about AWS Grafana.
With Amazon Managed Grafana, you can view your metrics, logs, and traces without having to provision servers, configure and update software, or deal with the time-consuming task of protecting and scaling Grafana in production.
You can create, explore, and share observability dashboards with your team to spend less time managing your Grafana infrastructure and more time improving the health, performance, and availability of your apps.
You can connect Amazon Managed Grafana to a variety of observability data sources, including AWS data sources like Amazon Managed Service for Prometheus, Amazon CloudWatch, and Amazon Elasticsearch Service, third-party ISVs like Datadog, and Splunk, and self-managed data sources like InfluxDB. Amazon Managed Grafana integrates seamlessly with AWS services, allowing you to securely add, query, visualize, and analyze your AWS data.
16. How does AWS Grafana Works?
The process how AWS Grafana how is demonstrated in the below image:
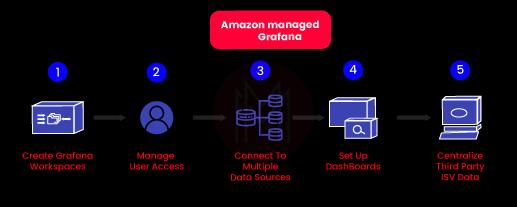
- Create Grafana workspaces: Create a workspace that is built, deployed, and managed automatically.
- Manage user access: Using AWS single sign-on integration, provide users access to the workspace.
- Connect to multiple data sources: Add multiple data sources
- Set up dashboards: Visualize and analyze logs, metrics, and track data across data sources all in one console.
- Centralize third-party ISV data: To add more data sources, upgrade to Grafana Enterprise (optional).
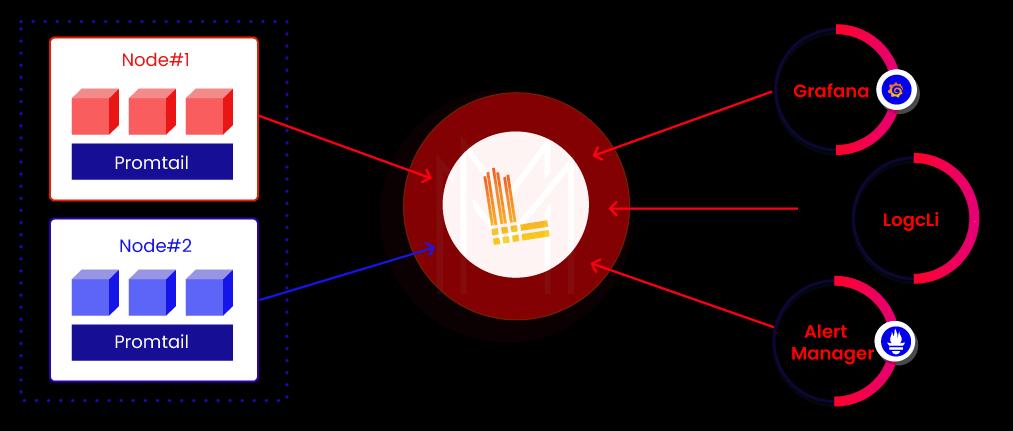
17. What is Grafana Loki and How does it work?
Grafana Loki is a log aggregation tool that collects and organizes logs from all of your apps and infrastructure. It offers a unique approach by indexing only the metadata of the log lines rather than the complete text.
The procedure of how Grafana Loki works is explained below:
18. Why use Grafana Loki?
- Because you may distribute logs in any format, from any source, and through a number of clients, getting started is simple.
- With 100 per cent persistence to object storage, you get petabyte-scale, fast throughput, cost-effective & durable storage, and cost-effective & durable storage.
- Your log lines can be used to create metrics and alarms.
- Ingestion logs have no formatting requirements, providing you more flexibility and the ability to format at query time.
- Follow your logs in real-time to see them as they arrive in the system, to have them updated after a set length of time, to see logs for a given day, and so on.
- Prometheus, Grafana, and K8s all have native integrations, allowing you to seamlessly move between metrics, logs, and traces.
19. What are exemplars in Grafana?
In Grafana, an exemplar is a specific trace that represents a recurrent pattern of data in a given time interval. It aids in the discovery of higher cardinality metadata inside time series data.
Consider the case when your company's website is seeing an increase in visitors. While more than 80% of users can access the website in less than two seconds, some users are experiencing a longer than typical response time, resulting in a negative user experience.
You must compare a trace for a rapid response to a trace for a slow response in order to determine the elements that are contributing to the latency. Given the enormous volume of data in a typical production setting, this will be a very time-consuming and arduous task.
You can use exemplars to assist isolate faults in your data distribution by isolating query traces with excessive latency within a time interval.
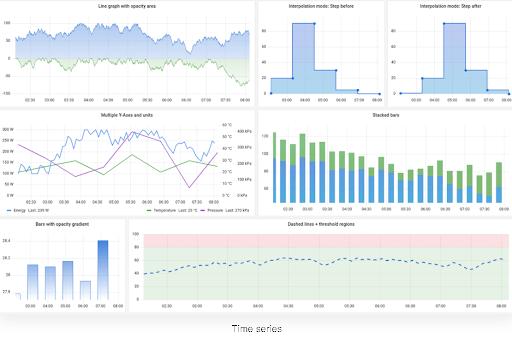
20. What is the Grafana time series?
The default and most popular approach to visualizing time series data is time series visualization. A line, a dot path, or a group of bars can all be used to represent it. Because of its flexibility, it can display virtually any time-series data.
Common time series options available in Grafana are
- Tooltip mode
- Legend mode
- Legend placement
Frequently Asked Grafana Interview Questions
21. What is a label in Grafana?
Labels are a type of key-value pair. To describe a log stream, we call them metadata. Labels are particularly crucial in Loki since they define a stream. More precisely, the stream is defined by the combination of each label key and value.
[ Check out: Grafana Tutorial]
22. What are metrics and visualizations?
Metrics are units of measurement that describe the size of something, such as the amount of memory in a computer system or the length of a desktop in centimetres. In Grafana, metrics are most useful when they are gathered often over time. This allows us to compare things like how system resource availability is altered when a programme is run.
In a time-series database (TSDB) like Prometheus, these types of metrics are recorded and associated with a time stamp. Although each TSDB has its unique data schema, they all share these two characteristics, and Grafana Cloud can visualize their varied metrics formats.
Visualization is a graph that shows how resource utilization has changed over time. Using visualizations to compare these time-stamped measurements over time makes it quick and straightforward to spot changes in a computer system, particularly as events occur.
23. What is Grafana Tempo?
Grafana Tempo is an open-source and user-friendly high-volume distributed tracing backend. Tempo is a low-cost operating system that only requires object storage and is strongly integrated with Grafana, Prometheus, and Loki. Tempo supports open-source tracing protocols such as Jaeger, Zipkin, and OpenTelemetry.
24. How can I configure Grafana so that viewing dashboards does not require a password?
[auth.anonymous]
# enable anonymous access
enabled = true

[auth.basic]
enabled = false
25. What are Grafana plugins?
Plugins make Grafana better by adding features that aren't currently present. You can use plugins to import data from a number of sources, bundle data sources and panels, and add new visualization types to dashboards.
Panels, data sources, and apps are the three types of plugins supported by Grafana.
- Panel plugins: To add new visuals to your dashboard, use panel plugins like the Worldmap Panel, Clock, and Pie Chart.
Panel plugins accomplish the following:
- It is possible to see the results of data source searches.
- Switch between dashboards as needed.
- It is possible to operate external systems, such as smart home devices.
- Data source plugins: Data source plugins now handle new databases, such as Google BigQuery. Data source plugins allow you to connect to external data sources and get data in a Grafana-friendly format. Using a data source plugin, you can use the data in any of your existing dashboards.
- App plugins: App plugins can be used to offer a tailored out-of-the-box monitoring experience.
26. What exactly is k6?
Grafana k6 is an open-source load testing tool for engineering teams that makes performance testing simple and efficient. k6 is free, open-source, and extensible.
k6 can be used to assess the reliability and performance of your systems, allowing you to detect performance regressions and problems sooner. k6 will help you create applications that are scalable, robust, and fast.
Some of the most common k6 use-cases are as follows:
- Load testing: k6 is designed to run high-load tests (spike, stress, and soak tests) while using minimal resources.
- Synthetic monitoring and performance: By running tests with a small amount of load, you may utilise k6 to frequently assess the performance and availability of your production system.
- Consistency and chaos testing: The architecture of k6 is extendable. You can use k6 to generate traffic as part of your chaotic experiments, or you can use it to trigger traffic from your k6 tests.
27. What is the Grafana panel?
Grafana panels are the user interface for creating a data source query as well as processing and structuring data for visualisations. A panel editor includes a query builder as well as a variety of options for data transformation and data addition to your panels.
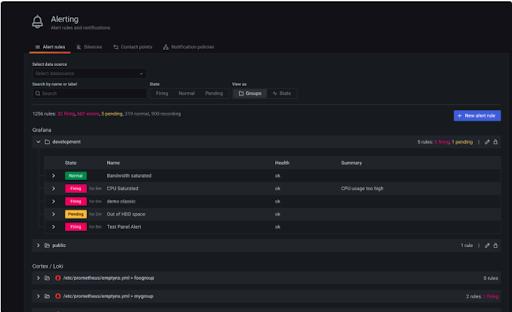
28. Explain Grafana Alerts
Alerts allow you to be notified as soon as a system problem arises. Robust and responsive notifications let you discover and resolve problems quickly, reducing service disruption.
Grafana 8.0 included new and improved alerting, which combines alerting data into a single, searchable dashboard. You'll be able to do things like:
- Set up and manage Grafana alerts.
- Create and manage Loki and Cortex-managed alerts.
- View alerting data from Prometheus and Alertmanager compatible data sources.
Grafana alerts are enabled by default for new OSS installations. For older movies, it's still an opt-in option.
Grafana alerting is made up of four main elements:
- Alerting rule -An alerting rule is a set of evaluation criteria that determines whether or not an alert will be triggered. It contains one or more queries and expressions, a condition, the frequency with which the condition is evaluated, and, optionally, the time over which the condition is met.
- Contact point - When the conditions of an alerting rule are met, the contact point is used to deliver notifications.
- Notification policy - A set of matching and grouping criteria used to define where and how often notifications should be sent.
- Silences - When a notice is silenced, it is based on the date and matching criteria.
29) What's the best way to check if the Grafana service is running or not?
You may verify that Grafana is up and running by using the status command, as shown below:
$ sudo systemctl status grafana-server30) How do I configure Grafana so that I can view dashboards without logging in?
Make the following changes to default.ini/grafana.ini to enable anonymous login (Grafana\conf).
- If you wish to make the login page disappear, do the following changes:
[auth] # Set to true to disable (hide) the login form, useful if you use OAuth #disable_login_form = false disable_login_form = true - Update disable_login_form to true.
[auth.anonymous] # enable anonymous access enabled = true - Specify the organization:
# specify organization name that should be used for unauthenticated users org_name = YOUR_ORG_NAME_HERE - You should be able to see your dashboard after restarting Grafana. If this isn't the case, please switch your organization's role from Viewer to Editor.
# specify role for unauthenticated users
org_role = Editor
Conclusion
By now, you've undoubtedly realised how useful and efficient Grafana is. So, if you've honed your skills and gained knowledge in this subject, it's time to proceed to appear for the interview. Thoroughly study these Grafana interview questions and prepare to ace the interview like a pro.
 On-Job Support Service
Online Work Support for your on-job roles.

Our work-support plans provide precise options as per your project tasks. Whether you are a newbie or an experienced professional seeking assistance in completing project tasks, we are here with the following plans to meet your custom needs:
- Pay Per Hour
- Pay Per Week
- Monthly
| Name | Dates | |
|---|---|---|
| Grafana Training | Aug 01 to Aug 16 | View Details |
| Grafana Training | Aug 04 to Aug 19 | View Details |
| Grafana Training | Aug 08 to Aug 23 | View Details |
| Grafana Training | Aug 11 to Aug 26 | View Details |

Madhuri is a Senior Content Creator at MindMajix. She has written about a range of different topics on various technologies, which include, Splunk, Tensorflow, Selenium, and CEH. She spends most of her time researching on technology, and startups. Connect with her via LinkedIn and Twitter .
