
- 6 Hot And In-Demand Tech Areas In 2024
- How To Forward Your Career With Cloud Skills?
- Top 7 On-Demand IT Certifications
- Most In-demand Technologies To Upskill Your Career
- Top 10 Hottest Tech Skills to Master in 2024
- Top Skills You Need to Become a Data Scientist
- Groovy Interview Questions
- Facets Interview Questions
- Crystal Reports Tutorial
- VAPT Interview Questions
- Flutter Tutorial
- Saviynt VS Sailpoint
- Flutter vs Xamarin
- PingFederate Interview Questions and Answers
- Dart vs Javascript : What's the Difference?
- Terraform Private Registry
- Cylance Interview Questions and Answers
- Sophos Interview Questions and Answers
- Top Camunda Interview Questions
- NUnit Interview Questions and Answers
- Impala Interview Questions and Answers
- ETL Tutorial
- Ionic Interview Questions
- Grafana Tutorial
- What is VAPT? - A Complete Beginners Tutorial
- SnapLogic Interview Questions
- Saviynt Interview Questions
- What is PingFederate? - A Complete Beginners Tutorial
- SnapLogic Tutorial
- Grafana Interview Questions
- RHCE Interview Questions and Answers
- Web Services Interview Questions
- Domo Interview Questions and Answers
- Terraform Interview Questions
- What is Sophos? | Sophos Turorial for Beginners
- Top Servlet Interview Question And Answers
- NLP Interview Questions and Answers
- Microsoft Intune Interview Questions
- Top XML Interview Questions And Answers
- Tosca Commander
- Katalon vs Cypress
- SQLite Tutorial
- Tosca Tutorial - A Complete Guide for Beginners
- Xamarin Interview Questions and Answers
- UiPath vs Automation Anywhere - The Key Differences
- OpenShift Interview Questions
- What is Katalon Studio - Complete Tutorial Guide
- Kronos Interview Questions
- Tosca Framework
- Burp Suite Tutorial
- Mendix Interview Questions
- Power Platform Interview Questions
- Burp Suite Interview Questions
- What is Mendix
- What is Terraform ?
- Burp Suite Alternatives
- Dart vs Kotlin
- What is Kronos?
- ES6 Interview Questions
- Entity Framework Interview Questions
- COBOL Interview Questions
- Express JS Interview Questions
- OSPF Interview Questions
- LINQ Tutorial
- CSS3 Interview Questions and Answers
- Auth0 Tutorial
- MS Access Interview Questions
- What is SPARQL - A Complete Tutorial Guide
- ExpressJS Tutorial
- UML Tutorial
- HTML vs XML
- Cypress vs Jest
- Impacts of Social Media
- OWASP Interview Questions
- Security Testing Interview Questions
- OpenShift vs Docker
- ES6 Tutorial
- Spark SQL Interview Questions
- Spark SQL Tutorial
- What is OWASP?
- AppDynamics Interview Questions
- Dynatrace Interview Questions
- Rest Assured Tutorial
- New Relic Interview Questions
- REST API Tutorial
- Datadog Interview Questions
- Rest API Interview Questions
- Rest Assured Interview Questions
- PTC Windchill Interview Questions
- Easiest Tech Skills To Learn
- Python SQLite Tutorial - How to Install SQLite
- Datadog Tutorial - Datadog Incident Management
- What is AppDynamics - AppDynamics Architecture
- RabbitMQ Interview Questions And Answers
- Datadog Vs Splunk
- Web Developer Job Description
- JP Morgan Interview Questions
- Types of Corporate Training
- Benefits of Corporate Training
- What is Corporate Restructuring?
- Blended Learning in Corporate Training
- What is Corporate Level Strategy?
- Flutter Projects and Use Cases
- How to Become a Web Developer
- How To Install Keras?
- How to Install Flutter on Windows?
- How to Install Cypress on Windows?
- How to Become a Computer Scientist?
- How to Install Katalon Studio in Windows
- How to Become a Programmer
- OWASP Projects and Use Cases
- How to Install Sophos?
- Workato Tutorial
- Workato Tutorial - What is Workato?
The tool monitors the performance and availability of the applications and records the information in the system. The goal of the Dynatrace tool is to monitor any applications that are assigned to it in the system and make them function more effectively by increasing their availability and performance. By monitoring the system's application performance management, artificial intelligence-related activities, and digital performance management, it multitasks. All of the application's information is contained in the tool's user interface. It comes with a tonne of modern features already built in.
| What is Dynatrace? - Table of Contents |
What is Dynatrace?
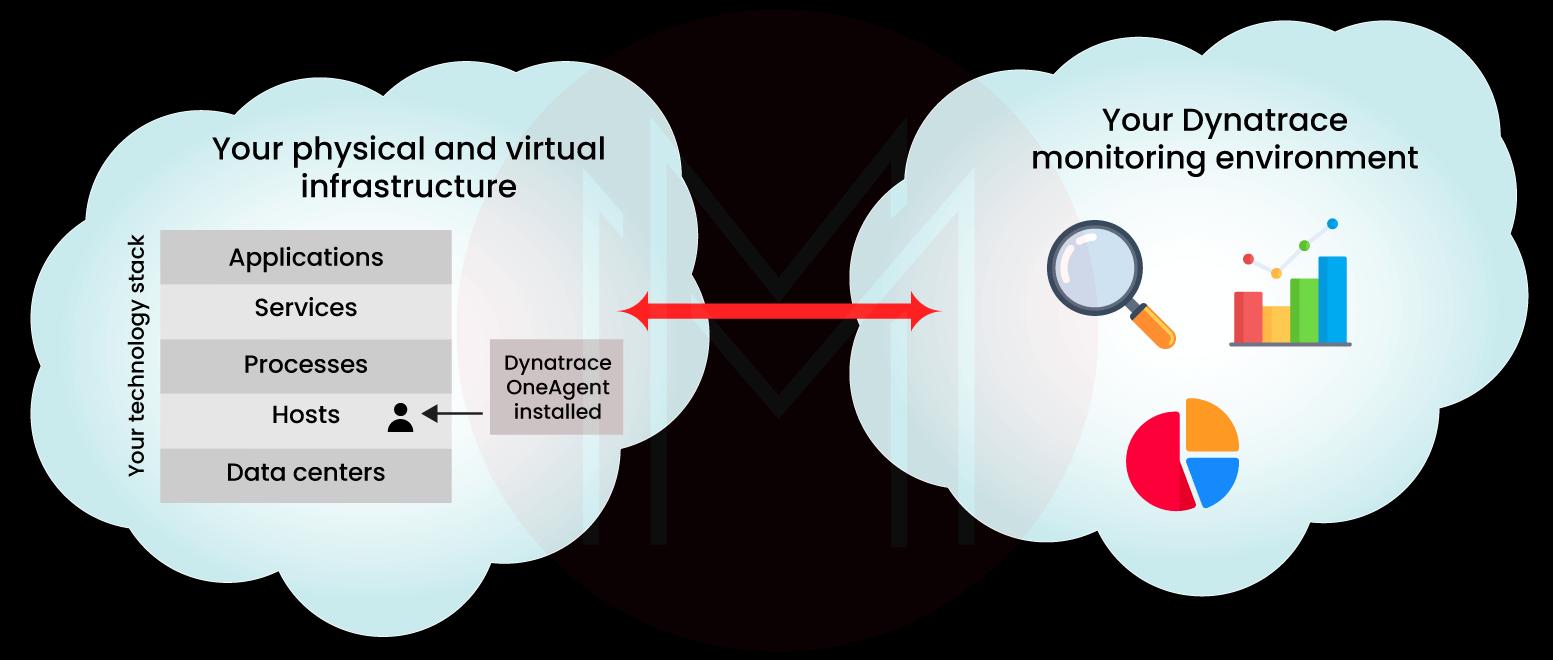
Dynatrace is the name of the application monitoring tool that provides customers with accurate performance monitoring and reliable system availability. The equipment is quick and dependable and makes use of numerous digital programmes to stay up to date with technology. Every transaction is kept track of and logged so that they can follow it from browser to database. Additionally, the infrastructure is watched. The programme examines the infrastructure for servers, databases, and codes to determine the root cause of any performance difficulties. Due to its complexity and use of more advanced technology, Dynatrace is difficult to comprehend. This tool is regarded as being wholly dedicated to application performance management.
Applications that provide end-to-end transaction details can be used with this APM tool to verify their performance and monitor them broadly. On a server, all of these specifics are kept. As a result, it is wise to review the logs and assess the performance concerns if the application experiences issues. The details of the transactions and the external services connected to them can both be determined with the use of this history tracing
 .
.| If you want to enrich your career and become a professional in Dynatrace, then enroll in "Dynatrace Online Training" - This course will help you to achieve excellence in this domain. |
How does Dynatrace Work?
Here are the key concepts to understand how Dynatrace works:
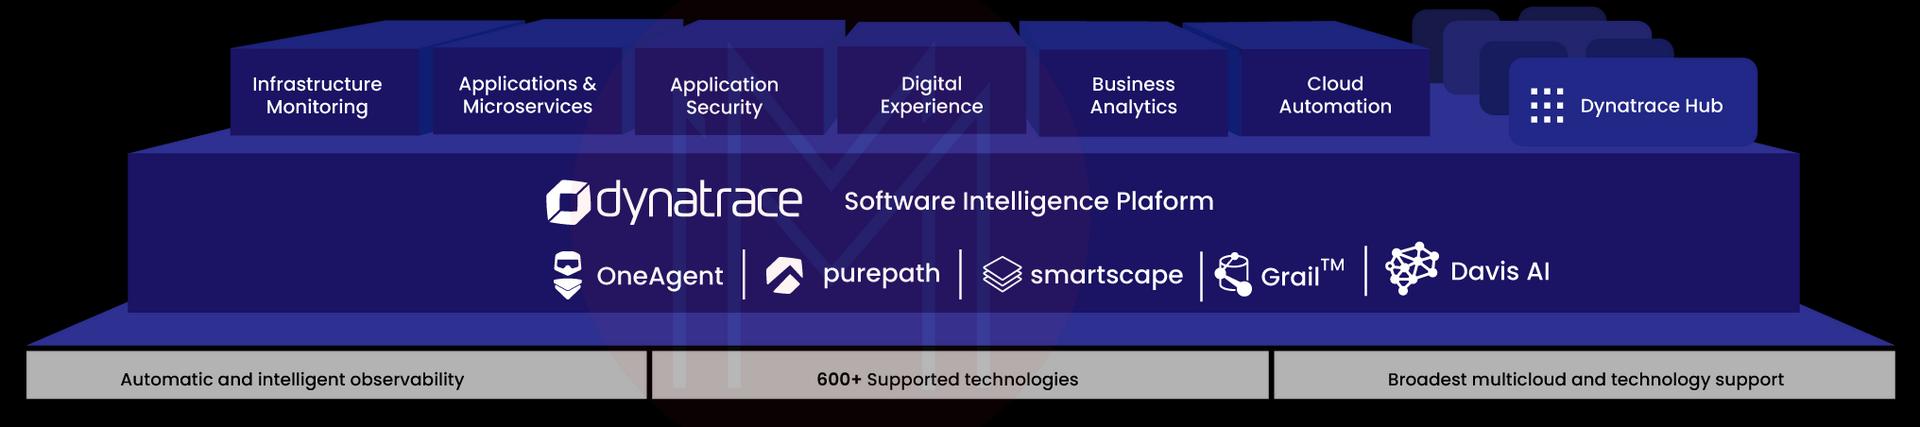
- OneAgent services: apps, microservices, infrastructure, and other dependencies in contemporary cloud systems are automatically discovered, activated, and instrumented.
- PurePath distributed tracing: captures and examines timing and context at the code level for all distributed traces across the entire stack, end to end.
- Smartscape topology: mapping of the dynamic interactions between all components across all tiers using the environment's structure.
- Grail data lakehouse: Massively parallel processing analytics engine for causational data lakehouses that uses Dynatrace Query Language for rapid, AI-powered analytics, context-rich, .
- Davis causal AI engine: Analyses all connections and dependencies inside complicated IT settings to provide accurate solutions that are ranked according to business effect. Davis notifies you when an issue arises, its effects on the business, and its underlying causes so that it may be immediately fixed.

what is dynatrace used for?
The all-in-one platform Dynatrace was created with a variety of application scenarios in mind.
- Infrastructure Monitoring: With the help of Dynatrace, you can automate and simplify infrastructure monitoring while getting complete insight into all of your hosts, virtual machines, containers, networks, events, and logs. To help you simplify tools and reduce MTTI, Dynatrace continuously auto-discovers your dynamic environment and collects infrastructure metrics into our Davis® AI engine.
- Applications and Microservices: Applications running across intricate enterprise cloud settings can benefit from Dynatrace's automatic code-level visibility and root-cause analysis. For transactions at every tier, Dynatrace automatically records the timing and code-level information. Additionally, it automatically recognizes and keeps track of microservices throughout the hybrid cloud, from mobile to mainframe.
- Application Security: By using automatic runtime application vulnerability management that is tailored for the cloud and Kubernetes, Dynatrace helps you to deliver apps more quickly and securely.
- Digital Experience Monitoring: Real User Monitoring (RUM) for each of your customers' trips, synthetic network-wide monitoring, and session replay that looks like a 4K movie are all features of Dynatrace DEM. This potent mix enables you to enhance user experience, optimize your applications, and deliver first-rate assistance across all digital channels.
- Business Analytics: You obtain real-time, AI-powered solutions to your most pressing business problems by connecting business measurements and KPIs to data that is currently flowing through our application performance and digital experience modules.
- Cloud Automation: You automatically receive accurate responses from Dynatrace AIOps. To enable speedy auto-remediation and intelligent cloud orchestration, Dynatrace gathers high-fidelity data in real-time and maps dependencies so that Davis®, the Dynatrace explainable AI engine, can show you the specific root causes of issues or abnormalities.
Applications of Dynatrace
- When we talk about application performance, we don't just mean how well the application functions. And the system's tool offers all the performance information from scratch. Real-time performance indicators are provided, and the system detects all issues immediately. This aids in problem diagnosis and provides appropriate solutions.
- The strength of this product is full-stack monitoring. Monitoring is therefore done at both the infrastructure and cloud levels. Users don't have to worry about the applications once Dynatrace is integrated into the system. To ensure adequate reliance in the system, the operation of the programmes is automatically detected, and all transactions are watched at every level.
- Applications are made continuously available thanks to AI, and all transactions are streamlined so that any problems may be fixed utilizing the system's real-time data. No record of a single transaction is lost. With all of the available technologies, the system is able to operate with better productivity and efficiency.
- I can speak from experience when I say that the security of the Dynatrace solution is invaluable. Dynatrace ensures that the systems and their applications are protected from any external environment and that external tools or applications cannot be used without that company's consent.
How is Dynatrace different from other cloud monitoring solutions?
Compared to other monitoring tools, Dynatrace takes a very different approach. The four main distinctions are as follows:
- Automatic: Dynatrace performs all operations automatically, including deployment, instrumentation, discovery, dependency mapping, baselining, problem identification, and root-cause analysis. On your hosts, immediately install Dynatrace OneAgent. I have finished.
- Full Stack: Dynatrace gives context, while other systems track and report on multiple metrics. From the end-user experience all the way down to the infrastructure, this entails comprehending and mapping every relationship and interdependency.
- AI at the core: At this time, AI is pervasive. The Davis® AI engine is at the core of our platform, evaluating billions of dependencies in milliseconds and delivering precise responses that are far above the capability of humans, unlike other solutions that have "bolted on" machine learning in an effort to decrease alert noise.
- Web Scale: The cloud-native architecture used in the construction of the Dynatrace Software Intelligence Platform allows for infinite scaling.
Dynatrace Deployment Models
- SaaS Solution: The cloud retains the data.
- Managed Solution: This combines the simplicity of SaaS with the control of an on-premises deployment, enabling customers to keep control over where their data is stored, whether in the cloud or on-premises.
SaaS users of Dynatrace just need to install OneAgent. Before installing OneAgent, Dynatrace Managed customers must configure their Dynatrace cluster.
Dynatrace Features
- Mobile app monitoring.
- Server-side service monitoring
- Real User Monitoring
- Cloud and virtual machine monitoring
- Container monitoring
- Root-cause analysis
- Network, process, and host monitoring
| Related Article - Dynatrace Interview Questions |
Benefits Of Dynatrace
- You should have a lot of data available for testing, and you should be able to evaluate your system's health using tools like CPU, memory, disc, network use, and storage issues.
- We can also investigate the issues that Dynatrace has identified and fix them.
- It enables programmers and testers to guarantee the efficiency and dependability of their applications.
- Before the client complains, we can identify the problems.
Dynatrace FAQs about
1. What is Dynatrace used for?
Dynatrace is used to build higher-quality software more quickly, update and automate enterprise cloud operations, and give your customers the finest possible digital experiences.
2. How does Dynatrace monitoring work?
Each application page that is rendered by your web servers uses a JavaScript tag that Dynatrace OneAgent injects into the HTML for real user monitoring. With these tags in place, the agent can keep an eye on how quickly and efficiently your customers' browsers on desktop and mobile devices respond to requests.
3. Is Dynatrace an APM tool?
In the category of Application Performance Management products, Dynatrace has been recognized as a Leader (APM). The benefits of Dynatrace's all-in-one platform, which was designed for IT, DevOps, and digital experience use cases and built on a single data model to enable greater automation and intelligence, are reflected in these customer evaluations.
4. What is the difference between Dynatrace and Splunk?
DynaTrace is an application monitoring solution, while Splunk is solely used as a syslog system. In order to gather events and logs from servers and other devices, you will use Splunk, and to monitor applications, warn users, give dashboards, etc., you will utilize DynaTrace.
5. What kind of tool is Dynatrace?
A software-intelligence monitoring platform called Dynatrace facilitates digital transformation by easing the complexity of business cloud settings.
6. Is Dynatrace real-time monitoring?
By offering real-time performance analysis, Dynatrace RUM gives you the ability to understand your customers. This includes every action a user does and the effects those actions have on performance.
7. What language is Dynatrace written in?
Kotlin managed to acquire attention among our development teams despite the fact that Java is the primary programming language we use at Dynatrace. This inspired several of our developers to start a community within the business to promote the usage of Kotlin.
8. What data does Dynatrace collect?
In order to identify the region from which users access your application, Dynatrace records end users' IP addresses and GPS coordinates. Dynatrace masks end-user IP addresses and GPS coordinates during Real User Monitoring and server-side monitoring when the option to Mask end-user IP addresses and GPS coordinates is enabled.
9. How do I monitor with Dynatrace?
Each application page that is rendered by your web servers uses a JavaScript tag that Dynatrace OneAgent injects into the HTML for real user monitoring. With these tags in place, the agent can keep an eye on how quickly and efficiently your customers' browsers on desktop and mobile devices respond to requests.
Conclusion
The Dynatrace tool has exceptional performance since it logs and monitors the system applications' performance using sensors, a digital interface, and artificial intelligence (AI). It is possible to eliminate procedures that are bad for the system and secure system performance.
Check out our "Dynatrace Online Training" provided by Mindmajix experts to advance your career today!
 On-Job Support Service
Online Work Support for your on-job roles.

Our work-support plans provide precise options as per your project tasks. Whether you are a newbie or an experienced professional seeking assistance in completing project tasks, we are here with the following plans to meet your custom needs:
- Pay Per Hour
- Pay Per Week
- Monthly
| Name | Dates | |
|---|---|---|
| Dynatrace Training | Jul 18 to Aug 02 | View Details |
| Dynatrace Training | Jul 21 to Aug 05 | View Details |
| Dynatrace Training | Jul 25 to Aug 09 | View Details |
| Dynatrace Training | Jul 28 to Aug 12 | View Details |

Madhuri is a Senior Content Creator at MindMajix. She has written about a range of different topics on various technologies, which include, Splunk, Tensorflow, Selenium, and CEH. She spends most of her time researching on technology, and startups. Connect with her via LinkedIn and Twitter .