
- 6 Hot And In-Demand Tech Areas In 2024
- How To Forward Your Career With Cloud Skills?
- Top 7 On-Demand IT Certifications
- Most In-demand Technologies To Upskill Your Career
- Top 10 Hottest Tech Skills to Master in 2024
- Top Skills You Need to Become a Data Scientist
- Groovy Interview Questions
- Facets Interview Questions
- Crystal Reports Tutorial
- VAPT Interview Questions
- Flutter Tutorial
- Saviynt VS Sailpoint
- Flutter vs Xamarin
- PingFederate Interview Questions and Answers
- Dart vs Javascript : What's the Difference?
- Terraform Private Registry
- Cylance Interview Questions and Answers
- Sophos Interview Questions and Answers
- Top Camunda Interview Questions
- NUnit Interview Questions and Answers
- Impala Interview Questions and Answers
- ETL Tutorial
- Ionic Interview Questions
- Grafana Tutorial
- What is VAPT? - A Complete Beginners Tutorial
- SnapLogic Interview Questions
- Saviynt Interview Questions
- What is PingFederate? - A Complete Beginners Tutorial
- SnapLogic Tutorial
- Grafana Interview Questions
- RHCE Interview Questions and Answers
- Web Services Interview Questions
- Domo Interview Questions and Answers
- Terraform Interview Questions
- What is Sophos? | Sophos Turorial for Beginners
- Top Servlet Interview Question And Answers
- NLP Interview Questions and Answers
- Microsoft Intune Interview Questions
- Top XML Interview Questions And Answers
- Tosca Commander
- Katalon vs Cypress
- SQLite Tutorial
- Tosca Tutorial - A Complete Guide for Beginners
- Xamarin Interview Questions and Answers
- UiPath vs Automation Anywhere - The Key Differences
- OpenShift Interview Questions
- What is Katalon Studio - Complete Tutorial Guide
- Kronos Interview Questions
- Tosca Framework
- Burp Suite Tutorial
- Mendix Interview Questions
- Power Platform Interview Questions
- Burp Suite Interview Questions
- What is Mendix
- What is Terraform ?
- Burp Suite Alternatives
- Dart vs Kotlin
- What is Kronos?
- ES6 Interview Questions
- Entity Framework Interview Questions
- COBOL Interview Questions
- Express JS Interview Questions
- OSPF Interview Questions
- LINQ Tutorial
- CSS3 Interview Questions and Answers
- Auth0 Tutorial
- MS Access Interview Questions
- What is SPARQL - A Complete Tutorial Guide
- ExpressJS Tutorial
- UML Tutorial
- HTML vs XML
- Cypress vs Jest
- Impacts of Social Media
- OWASP Interview Questions
- Security Testing Interview Questions
- OpenShift vs Docker
- ES6 Tutorial
- Spark SQL Interview Questions
- Spark SQL Tutorial
- What is OWASP?
- AppDynamics Interview Questions
- Dynatrace Interview Questions
- Rest Assured Tutorial
- New Relic Interview Questions
- REST API Tutorial
- Datadog Interview Questions
- Rest API Interview Questions
- Rest Assured Interview Questions
- PTC Windchill Interview Questions
- Easiest Tech Skills To Learn
- Python SQLite Tutorial - How to Install SQLite
- What is AppDynamics - AppDynamics Architecture
- RabbitMQ Interview Questions And Answers
- What is Dynatrace
- Datadog Vs Splunk
- Web Developer Job Description
- JP Morgan Interview Questions
- Types of Corporate Training
- Benefits of Corporate Training
- What is Corporate Restructuring?
- Blended Learning in Corporate Training
- What is Corporate Level Strategy?
- Flutter Projects and Use Cases
- How to Become a Web Developer
- How To Install Keras?
- How to Install Flutter on Windows?
- How to Install Cypress on Windows?
- How to Become a Computer Scientist?
- How to Install Katalon Studio in Windows
- How to Become a Programmer
- OWASP Projects and Use Cases
- How to Install Sophos?
- Workato Tutorial
- Workato Tutorial - What is Workato?
Datadog is an analytics and tracking solution that can be employed for event tracking for architecture and cloud services as well as performance measure calculation. The software can keep an eye on tools, servers, and databases.
Datadog can integrate with a wide range of services, tools, and computer languages thanks to a Rest application programme interface (API). Chef, Kubernetes, Ansible, Puppet, Bitbucket integrations and Ubuntu, for example. The user interface features customisable dashboards that can display real-time graphs made up of data from many sources. To know more about this Datadog Tutorial, read below!
| Datadog - Table of Contents |
What is Datadog?
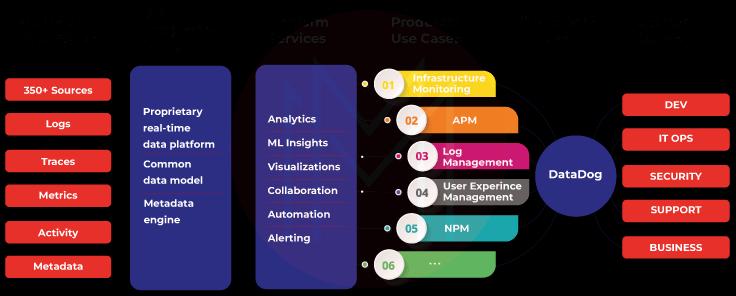
Simply put, Datadog is a SaaS monitoring and analytics platform for large-scale software and infrastructure.
Datadog integrates end-to-end tracing with real-time data from hosts, capsules, databases, and applications to facilitate full-stack observability. This leads to useful alerts and effective representations.
Datadog provides more than 200 supported connectors with leading vendors and APM libraries for numerous languages.
Datadog's typical use cases include
- DevOps monitoring automation
- Right-shift testing
- Business intelligence that is current Security analytics
- Digital experience tracking Etc
| If you want to enrich your career and become a professional in Datadog, then enroll in "Datadog Training". This course will help you to achieve excellence in this domain. |
How is Datadog used?
Datadog is a widely used programme and the company that makes it is expanding rapidly. Although Datadog is doing well, competition is heating up in the application performance management market, which is also expanding rapidly.
Datadog is a top-notch network and service monitoring service ideal for small and medium-sized IT companies. Once you get past the installation process and the agent-based architecture, it has a lot to offer, such as numerous integrations, dashboards, and customizable alerts.
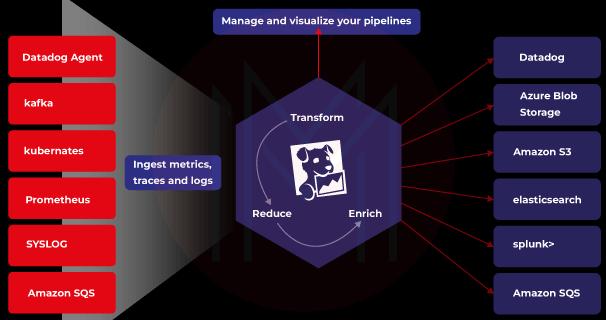
Datadog is a cloud-scale monitoring service that provides monitoring of databases, servers, tools, and services via a SaaS-based data analytics platform. The Datadog Agent is a piece of software that is installed on your hosts. It gathers events and metrics from hosts and sends them to Datadog, where monitoring and performance data may be analyzed.
The Datadog Agent is open-source, and its source code is available on GitHub at DataDog/datadog-agent. HTTP Strict Transport Security and Transport Layer Security (TLS) are used to secure all data exchanges between Datadog and its clients (HSTS). If encrypted communication is disrupted, the Datadog application is inaccessible.
What are the primary Datadog use cases?
Datadog lets you track metrics and get in-depth information about your IT infrastructure in real-time. Here are the main ways the Datadog can be used:
- Application Performance Monitoring (APM) can help organizations cut down on delays and get rid of errors.
- IT professionals can make, change, and manage alerts and notifications about their IT infrastructure.
- They can use it as a security platform to find threats and applications in their infrastructure that are set up wrong.
- They can set up multiple integrations that collect metrics, traces, and logs to send data to the platform.
- They can test the performance and environments of production.
- If you use Jenkins, which is an automation server for deploying software, the app can help you see Jenkins job metrics and pipeline execution.
Advantages of Datadog
Customers can ingest all metrics, traces, and logs from applications, infrastructure, and third-party services using Data Dog's simple-to-use, fully-featured application. The business uses a single platform to monitor systems as well. Other advantages of Datadog however are:
- Startups that use the cloud adore it:
Datadog has a reputation as a tool for cloud-native firms looking to monitor their infrastructure and applications. Many of these firms continued with the service as they grew, but they encountered restrictions on data ingestion and retention. As was already mentioned, Datadog is quite good at spotting problems, but determining their core causes is trickier.
- Robust and customizable UI:
Many Datadog users adore the platform's pre-built dashboards and simple user interface. The entire system may be seen through one single pane of glass. Without writing any code, you may design custom views using drag-and-drop widgets. You may simply create reports and see data in a wide range of forms thanks to a selection of visualization tools.
- Simple to set up and operate Datadog is easy to set up and use:
The Datadog agent can quickly install, configure, and connect to various services using API integrations. The intake and retention "rehydration" process may become much more expensive and difficult to manage as you delve even more into the logging analytics use case, though.

Features of Datadog
There are plenty of features of Datadog, however, the most prominent ones are:
- Offers an IT/DevOps squad with a single point of view of one‘s facilities such as servers, apps, metrics as well as other services
- Programmable dashboards
- Alerts based on urgent problems.
- More than 250 product integrations are supported.
- Logs, latency, and error rates are automatically gathered and analyzed.
- Accessibility to the API is made possible.
- Supports programmes created in languages like Java, Ruby, PHP, Python, Go and .NET
| Related Article: Datadog Interview Questions |
Capabilities available on Datadog
Depending on your browser's width, the Datadog website's navigation changes. Up to three different ways of navigation are possible. Just modify the width of your browser to adjust the navigation type.
Some prominent capabilities of the Datadog are
1. Integrations
- Datadog officially lists over 600 integrations.
- The Datadog API enables specialized integrations.
- The Agent is open source.
- Once connections have been set up, all data whether it resides in a center or an internet service is handled equally by Datadog.
2. Log management
You may deliver and process each log that the services and equipment produce using Datadog Log Management. The Live Tail allows you to view the logs in genuine without indexing them. Each of the logs from the apps and infrastructure may be ingested, and you can use filters to dynamically select which ones to index before archiving them.
3. APM and continuous profiler
Alongside your logs and infrastructure monitoring, Datadog Software Performance Monitoring, also called as APM or tracing gives you a comprehensive insight into the performance of your application. This includes detailed traces of individual requests in addition to automatically generated dashboards for key metrics like request volume and latency. Datadog can track a request's progress throughout a distributed system when it is submitted to a program and provide you with systematic information about the request's status.
4. Infrastructure
- The infrastructure list includes every machine.
- The tags that have been put on each machine are visible. You can identify which machines serve a specific purpose by tagging them.
- Your servers will likely be automatically categorized by Datadog. If a new engine is labeled, you may examine its statistics right away depending on the settings that were previously made for that tag. Explore tagging further.
5. Host Map
You may access the host map from the Infrastructure menu. It provides the potential to:
- Visualize your surroundings quickly.
- Determine outliers
- Recognize use trends
- Resource efficiency
6. Events
The much more recent events produced by the services and infrastructure are shown in the Event Explorer. Things like the following can happen:
- Deployment of codes
- Changes in service health
- Configuration alterations
- Observing alerts
The events gathered by the Agent and any installed integrations are automatically collected in the Event Explorer. Utilizing the personalized Agent checks, Datadog API, Events email API or the DogStatsD, you may also send your own unique events. You can use facets or search terms to filter your events in the Event Explorer. With the use of event analytics, you may combine or select events by an attribute and visualize them.
7. Dashboards
Dashboards have graphs with current performance indicators.
- Synchronized mouse movement on every graph in a screenboard.
- Events are vertical bars. They provide context for a metric.
- To focus on a specific time period on a graph, click and drag.
- The event stream follows you around as you move your cursor over the graph.
- Show use totals, hosts, or zones.
- Since Datadog provides a JSON writer for the graph, metrics can be processed mathematically and functionally.
- Share a stream-generated snapshot of a graph.
- An iframe supports the embedding of graphs. This makes it possible to share a live graph with a third party without sharing the information or any other personal information.
8. Monitors
On the basis of metric thresholds, integration readiness, network endpoints, and other factors, monitors offer alerts and notifications.
- Report any metric to Datadog.
- Configure multiple notifications by host, device, and more
- To send notifications to the correct individuals, use @ in alert messages.
- Plan outages to block notifications of computer shutoffs, off-line maintenance, and other events.
9. Network performance monitoring
Datadog Network Performance Measurement (NPM) allows you to see the network traffic flowing through any tagged item in the Datadog system, including hosts, services, and zones as well as containers. Group by anything, including data centers, teams, and even specific containers. Use tags to source- and destination-filter traffic. Through a customisable network page and network map, the filters are then aggregated into flows, each of which depicts the traffic between a single source and a single destination. Network parameters including speed, bandwidth, retransmit count, and source/destination details down to the IP, port, and PID levels are all included in each flow. Then, important statistics like traffic volume and TCP retransmits are reported.
10. RUM and session replay
Real-time user behaviors and experiences can be visualized and analyzed with Datadog Real User Monitoring (RUM). To better understand your users' behavior, you can record and view their online browsing sessions using Session Replay. You may resolve problems with program, infrastructural, and key metrics in one dashboard by correlating business and application data in the RUM Explorer in addition to seeing frontend errors, page dependencies and load times.
11. Serverless
Event-driven programming can be written using serverless technology and uploaded to a cloud provider that controls all of the core computing resources. In order to improve performance, you can filter to functions that are producing failures, high latency, or cold starts using Serverless, which collects traces, logs and metrics from any AWS Lambda functions that are running serverless apps into one view.
12. Cloud SIEM
Threats to your application or infrastructure are automatically discovered by Datadog Cloud SIEM also known as Security Information and Event Management. A planned attack, a system interacting with an IP that matches a threat intelligence list, or an unsafe configuration are a few examples. These risks can be connected and prioritized in the Security Explorer after being revealed in Datadog as Safety Signals.
13. Synthetic monitoring
You may develop and execute API and browser tests which proactively replicate user interactions with your applications using Datadog Synthetic Monitoring, and you can also keep an eye on all internally and externally network endpoints throughout your system's layers. To stop problems from cropping up in production, you can find faults, spot regressions, and automate rollbacks.
What kinds of technology does Datadog work with?
Datadog supports multiple technologies, including Azure, Amazon Web Services (AWS), Red Hat OpenShift, Kubernetes, Google Cloud, and Pivotal Platform.
Let's briefly examine how the following technologies interface with Datadog:
- More than 70 different AWS services provide the app with reliable system information, analytics, and tags.
- Kubernetes clusters can also be monitored and their status checked.
- Data is gathered from all relevant Google Cloud services via simple connectors.
- There are about forty different Azure service integrations that it supports.
Datadog Incident management
This manual covers how to report an incident using the Datadog Clipboard.
- Ctrl/Cmd + Shift + K will open the clipboard.
You can collect data from a variety of sources, including graphs, monitors, complete dashboards, or notebooks, using the Clipboard. This enables you to declare an incident with as much detail as feasible.
- Select a graph first from System - Metrics dashboard that you want to copy to the Clipboard for this instruction.
- Go to Dashboard > Panel lists and consisting - Metrics from the Datadog menu on the left.
- Copy one of the charts to the clipboard by hovering over it
- On the left side of the Datadog menu, go to Monitors > Manage Monitors and choose [Auto] Clock in sync with NTP.
- Click Add current page to copy the current page to the clipboard.
- Click Add Chosen Items To after selecting everything.
- Choosing a New Incident.
- Describe the situation.
- To start an incident, click Declare Incident.
Declaring an incident is also possible through a graph, a monitor, or the events API. Users using APM can declare an incident by clicking the Alarm symbol on just about any APM graph. As part of the Slack connection, you can also declare an incident and specify its title, severity, and client effects by using the /datadog incident shortcut. By selecting the Notify button in the upper right corner after creating the occurrence, you can add more notifications.
Datadog pricing
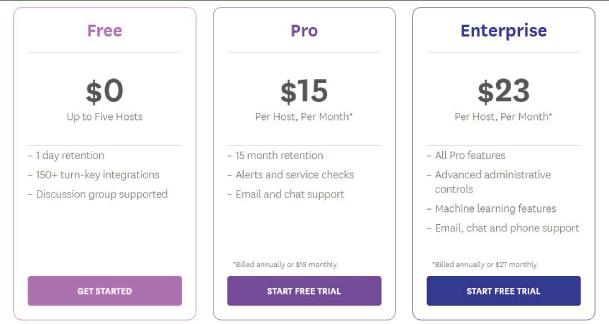
You must be familiar with the three Datadog pricing tiers before you begin utilizing the service.
- With the Free plan, you can keep metrics for up to one day and store events and metrics on up to 5 hosts for free.
- The Pro plan costs $15 per host per month and comes with more than 500 integrations, out-of-the-box dashboards with more features, and 15 months of metric retention.
- With the Enterprise plan, you'll get premium technical support via chat, email, and phone. You also get unlimited alerts and 15 months of data storage, but the plan costs $23 per host per month.
Datadog FAQ’s
1. What is Datadog used for?
Datadog is a monitoring and analytics tool for IT and DevOps teams. It can be used to track infrastructure and cloud services for performance metrics and event monitoring.
2. Does Google use Datadog?
Datadog interfaces with Google Cloud Run services to capture data in real-time and automatically scales with GCP infrastructure by monitoring newly created resources.
3. Is Datadog a DevOps?
Yes, Datadog helps organizations build a culture of being able to see what's going on, working together, and sharing data. These are all important parts of the DevOps movement.
4. Is Datadog Paas or SaaS?
Datadog is a modern Software as a Service (SaaS) tool that aggregates data from applications, infrastructures, third-party services, and cloud integrations to make your entire stack observable.
5. Why is Datadog better than Splunk?
The tool Datadog has a dashboard that can be easily changed to fit the needs. The Splunk tool doesn't have such a choice. The dashboard can't be changed or made to look different. Compared to the Splunk tool, setting up and installing the Datadog tool is pretty easy.
| Related Article: Datadog vs Splunk |
6. Who is the competitor of Datadog?
In the market for service monitoring, Amazon CloudWatch competes with Datadog. But only service providers can use Amazon CloudWatch, while Datadog is a full-stack monitoring platform. Anomaly detection can be improved by using CloudWatch with CloudWatch Logs and EKSor personalized metrics and dashboards
7. Is Datadog a database?
Datadog Database Monitoring adds to the ability to monitor the general health and availability of the database and the underlying infrastructure by letting users find the exact queries that affect application performance and the user experience.
8. Does Datadog use Grafana?
With the Datadog data source for Grafana, you can use Grafana to query and display Datadog metrics.
9. How does Datadog monitoring work?
Datadog can get logs from servers, AWS EC2 instances, containers, and other cloud-based environments. Logging lets you collect, process, and keep an eye on different logs from all over the system.
10. Is Datadog a free tool?
Datadog's dashboards can be changed to fit your needs, and it's free for up to 5 hosts (with 1-day data retention). After that, $15 per host per month is charged to the customer. There is also a free trial for 14 days. On the website, you can see the most up-to-date prices for the Datadog infrastructure.
Conclusion
Datadog offers a wide variety of useful functions and is completely free to use. This Datadog tutorial will show you how to use Datadog to manage setups, monitor and record metrics. So, you should now be aware of all that Datadog is capable of, from controlling settings to monitoring and recording metrics. Our Mindmajix experts offer a Datadog Training Course to know more about the datadog concepts.So enroll now and start learning!
 On-Job Support Service
Online Work Support for your on-job roles.

Our work-support plans provide precise options as per your project tasks. Whether you are a newbie or an experienced professional seeking assistance in completing project tasks, we are here with the following plans to meet your custom needs:
- Pay Per Hour
- Pay Per Week
- Monthly
| Name | Dates | |
|---|---|---|
| Datadog Training | Jul 18 to Aug 02 | View Details |
| Datadog Training | Jul 21 to Aug 05 | View Details |
| Datadog Training | Jul 25 to Aug 09 | View Details |
| Datadog Training | Jul 28 to Aug 12 | View Details |

Madhuri is a Senior Content Creator at MindMajix. She has written about a range of different topics on various technologies, which include, Splunk, Tensorflow, Selenium, and CEH. She spends most of her time researching on technology, and startups. Connect with her via LinkedIn and Twitter .